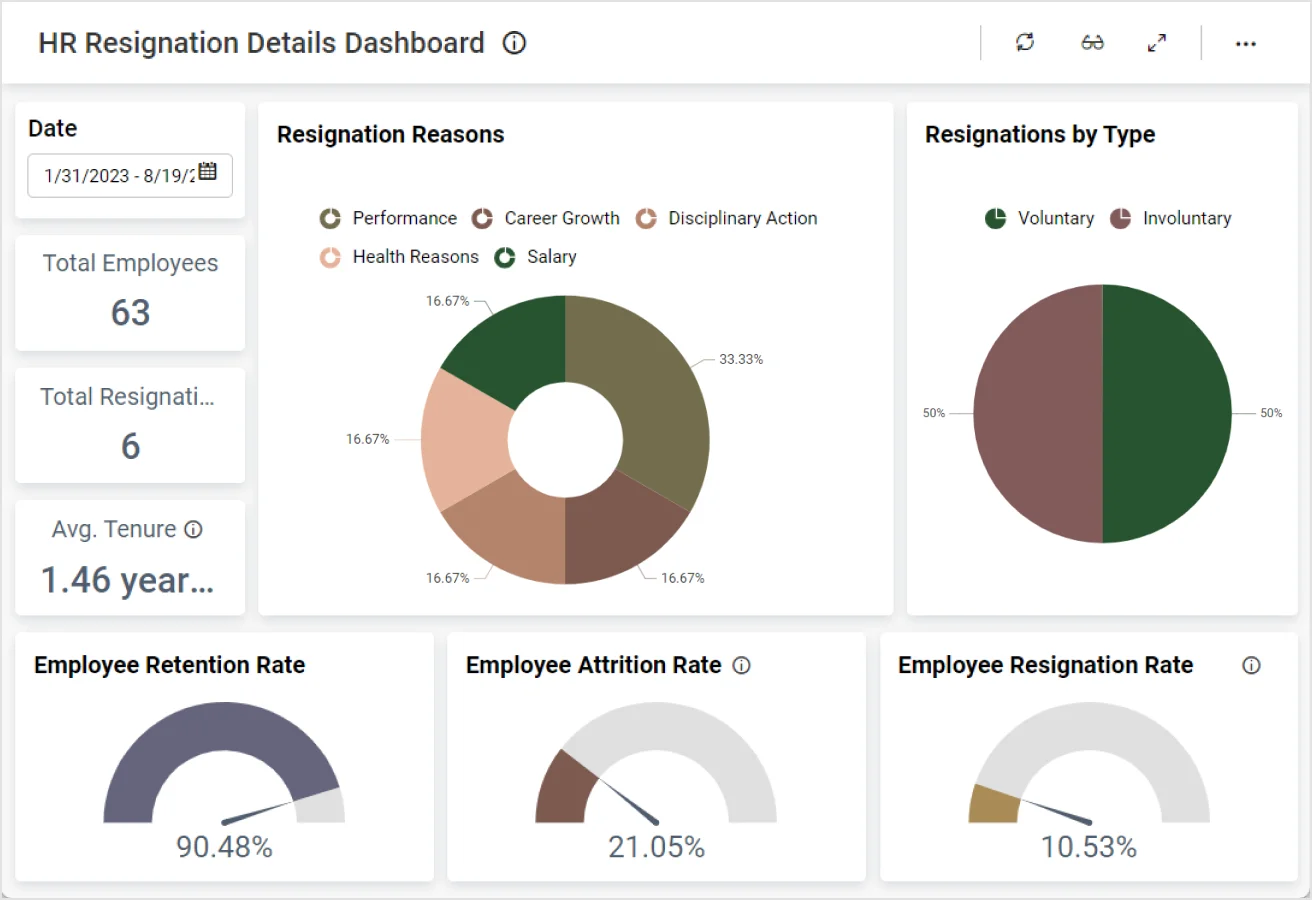
This dashboard allows human resources team members to track important employee resignation metrics. Using this employee resignation dashboard, leaders can answer the following questions:
Firstly, what is our employee retention rate?
Secondly, what is our tenure rate by age over the past six months?
Thirdly, how many resignations are involuntary?
Finally, which department has the most turnover?
This embedded dashboard example for employee resignations displays a wide range of informative visual aids, from pyramid charts to bar graphs. For example, HR professionals can track tenure rate by experience and average tenure rate by department with colorful bar graphs. Next, they can see the number of days an employee worked in their career through the use of a pyramid chart. Finally, the number boxes show the attrition rate, tenure rate, employee retention rate, and average years of experience.
In addition, the HR employee resignation details dashboard offers six-month trend metrics. Looking back six months, leaders can see tenure rate by age, number of absences by month, and average tenure rate by month. Important trend metrics help professionals identify potential solutions for forward improvement and growth.
Finally, the grid at the bottom of the dashboard gives detailed insights surrounding employees and their employment records. Business leaders can track, by employee, resignation dates, start dates, assigned departments, and reasons for resignation, whether voluntary or involuntary. In summary, this embedded dashboard example provides a wealth of information to keep you informed.
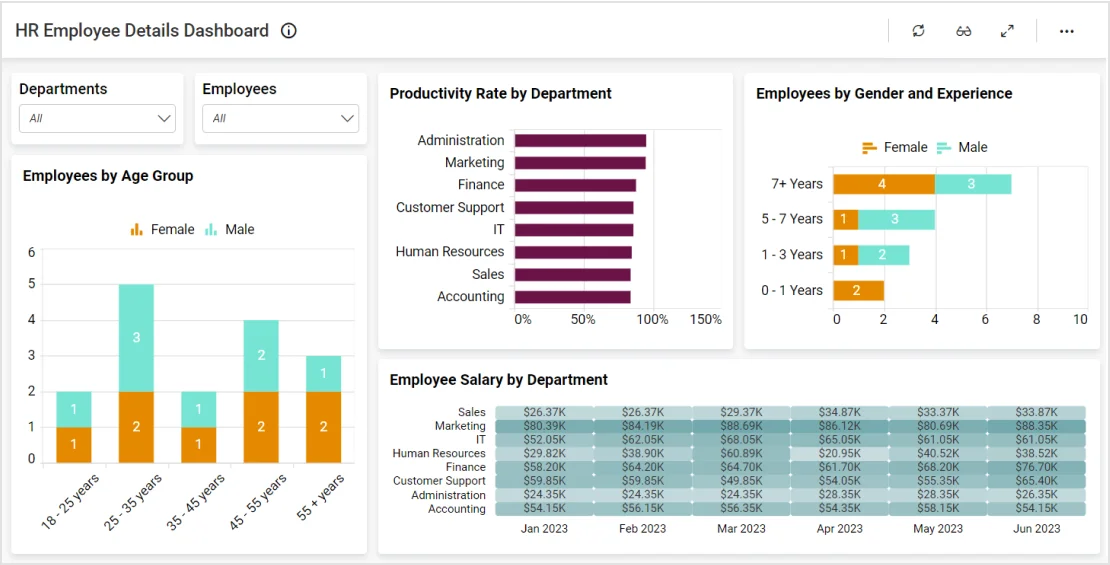
With the immense amount of data, you can narrow in on a specific search. Our dashboard offers you a filter feature where you can hone in on a specific date range and employee. As a result, leaders, like yourself, can simplify how you view your data. Check out this embedded dashboard example for employee details to learn how Bold BI's solutions can help your team.
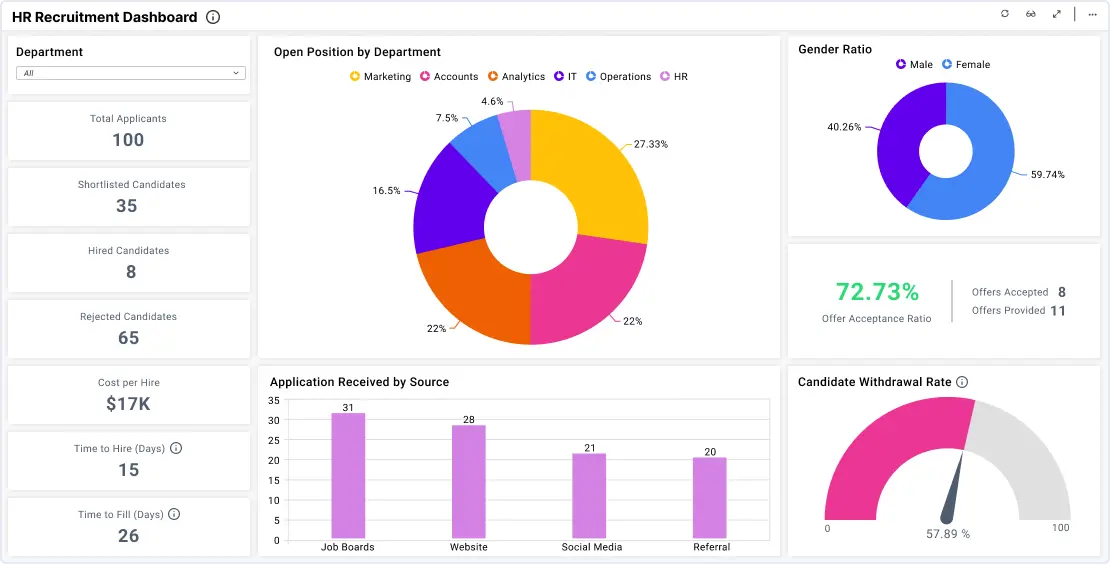
This hiring dashboard provides an overall view about the hiring process of a company along with important hr kpis and metrics.
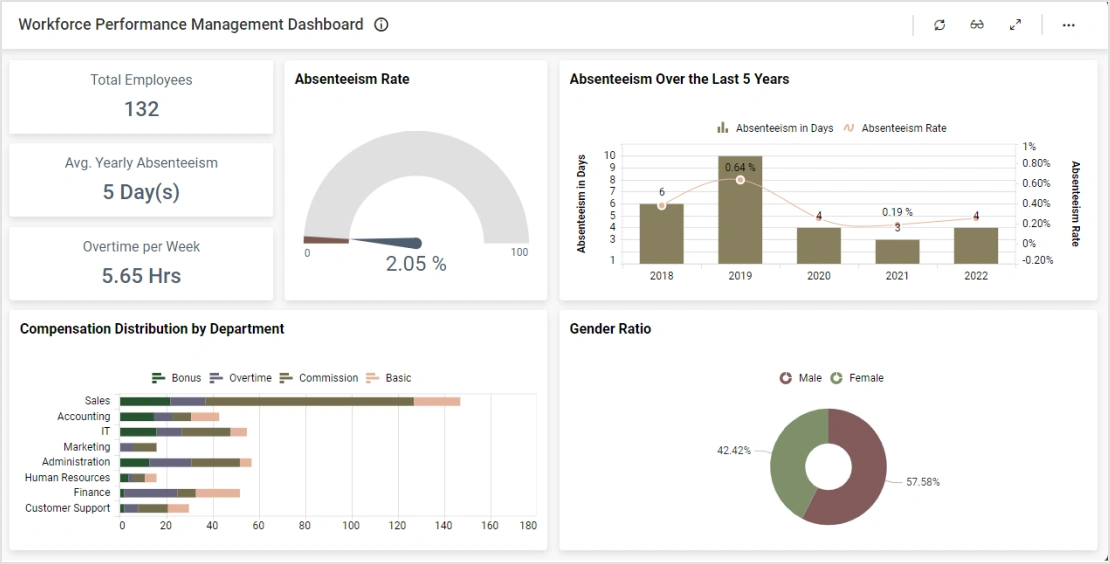
Learn More View DashboardThis workforce dashboard provides an overview about employee performance via HR kpis such as average employee tenure...
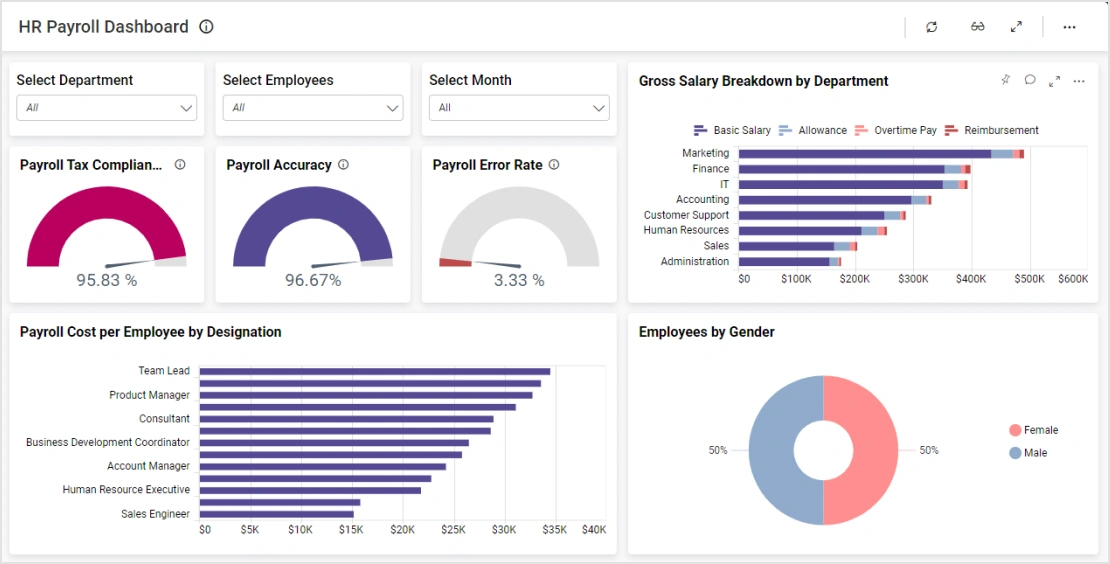
Learn More View DashboardThis dashboard allows HR team members to track key payroll metrics. With this dashboard...
Learn More View DashboardThis dashboard allows human resources team members to track key employee details. With this dashboard...
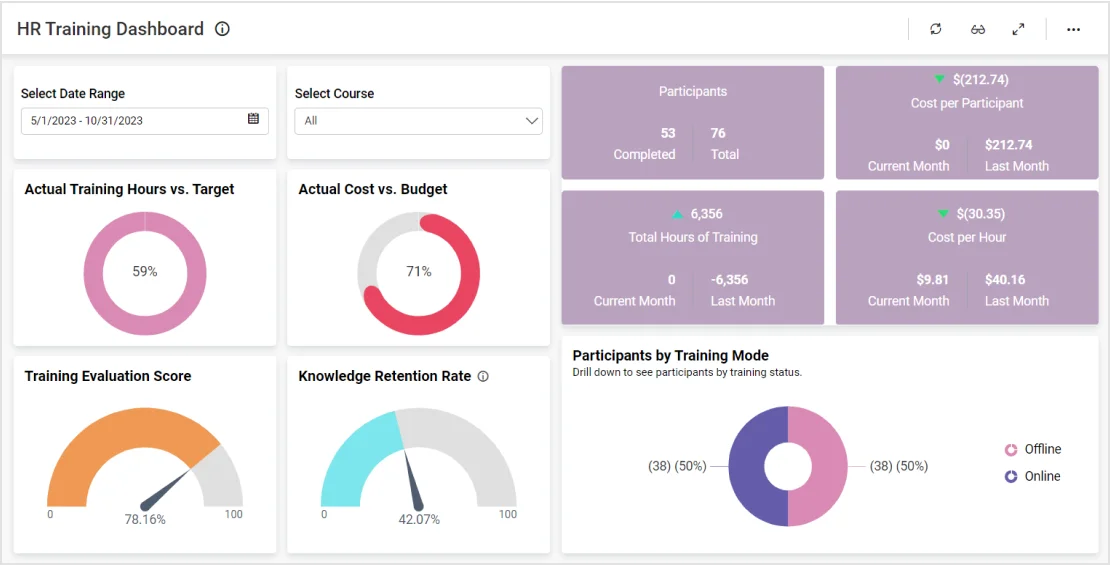
Learn More View DashboardThis dashboard allows human resources team members to track training progress. Using it, leaders can answer the following...
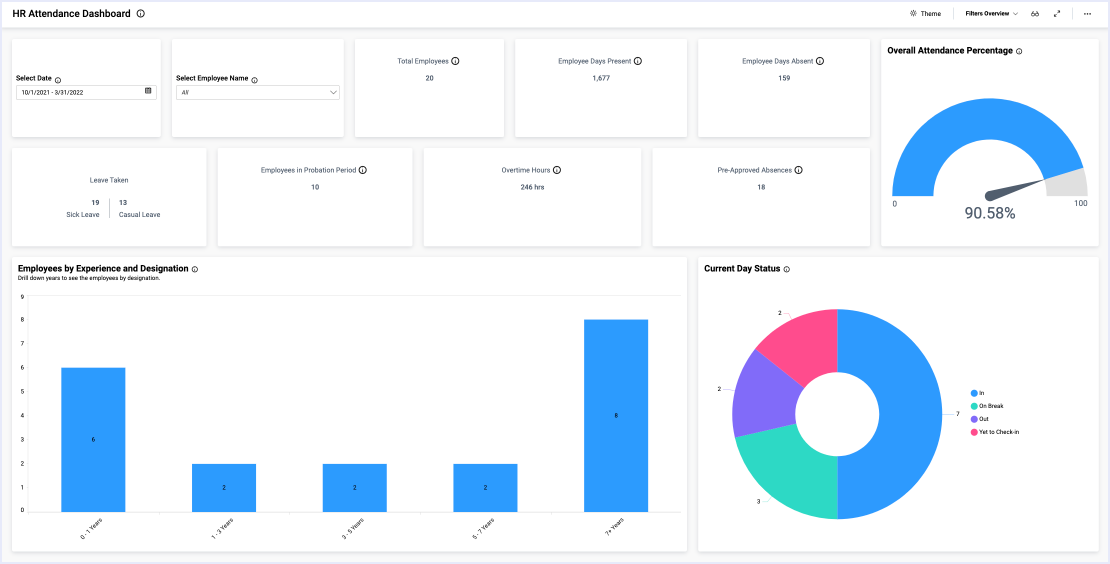
Learn More View DashboardThe HR Attendance Dashboard allows the human resources team to track key employee attendance metrics. With...
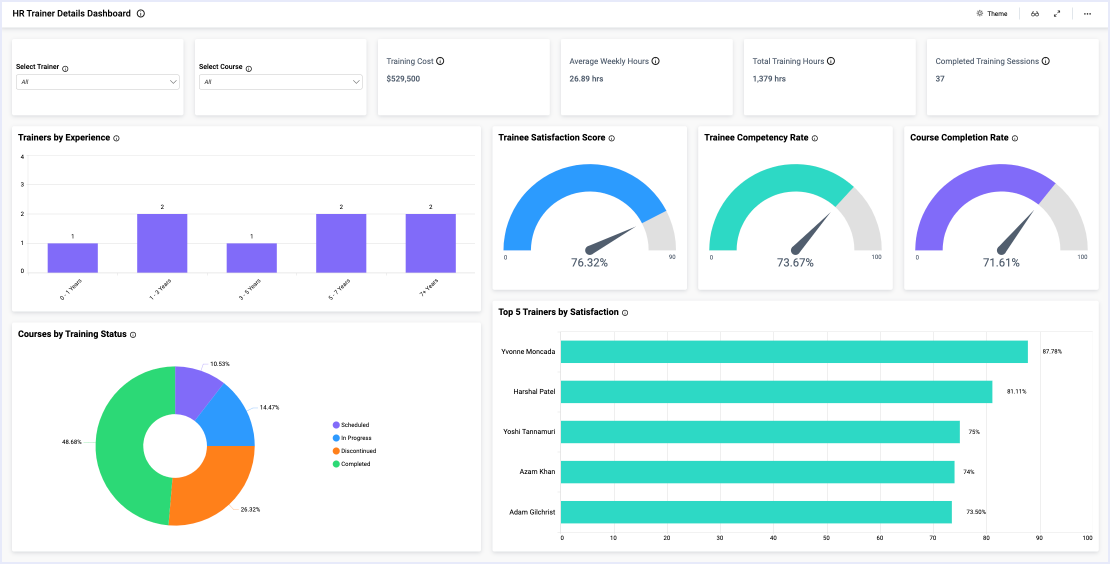
Learn More View DashboardThe HR Trainer Details Dashboard allows professionals to track trainer, trainee, and course metrics. With this dashboard...
Learn More View DashboardThe HR Training Feedback Dashboard allows professionals to thoroughly track a wide range of trainee and feedback metrics...
Learn More View DashboardThe HR Employee Attendance Dashboard allows business leaders to thoroughly track a wide range of attendance based metrics...
Learn More View DashboardIn the information technology field, you need to be able to monitor everything...
Learn MoreTry out all the features of Bold BI® with 30-day free trial and get to know how it suit to your needs of embedded analytics.
Platform