HR Trainer Details

Effortlessly track HR Employee trainer metrics such as performance by trainer, employee training costs, and total training hours.

HR Trainer Details

The HR Trainer Details Dashboard allows professionals to track trainer, trainee, and course metrics. With this dashboard, leaders can answer the following questions:

Firstly, how much do we spend annually on training?

Secondly, which trainers receive the highest satisfactory ratings?

Thirdly, how effective are the courses offered to our trainees?

Finally, how many hours per month do we spend on training?

Track Key Employee Trainer Metrics

First, with this embedded dashboard example for HR trainers, professionals can easily view a wide range of metrics, from average hours spent on training to total completed sessions.  With eye catching bar graphs, leaders can track the number of trainers by years of experience, the top five trainers by satisfaction rating, and training cost by course.  In addition, gauges show trainee satisfaction, competency, and completion rates.  

Next, HR dashboards like this one also provide valuable insights into training trends. Over a six-month period of time, graphs offer detailed metrics surrounding overall satisfaction levels and hours of training by month. This enables leaders to set future projections based on past performance. In addition, leaders can see the percentage of scheduled, in progress, completed, and discontinued courses.

Finally, the grid at the bottom of the dashboard gives detailed insight concerning all trainers.  From contact information to trainer ID, the trainer details grid also displays course speciality, average rating, and satisfaction level by trainer.

Filter Your Data

Considering the depth of data, our dashboard gives filter options to better track this information.  Leaders can easily filter the dashboard's data using the trainer and course name drop-down boxes at the top of the dashboard. This feature makes it easy to track and monitor metrics by a specific trainer or course. Check out this embedded HR dashboard example for HR trainers to learn how Bold BI's solutions can help your team.

HR Dashboard Examples

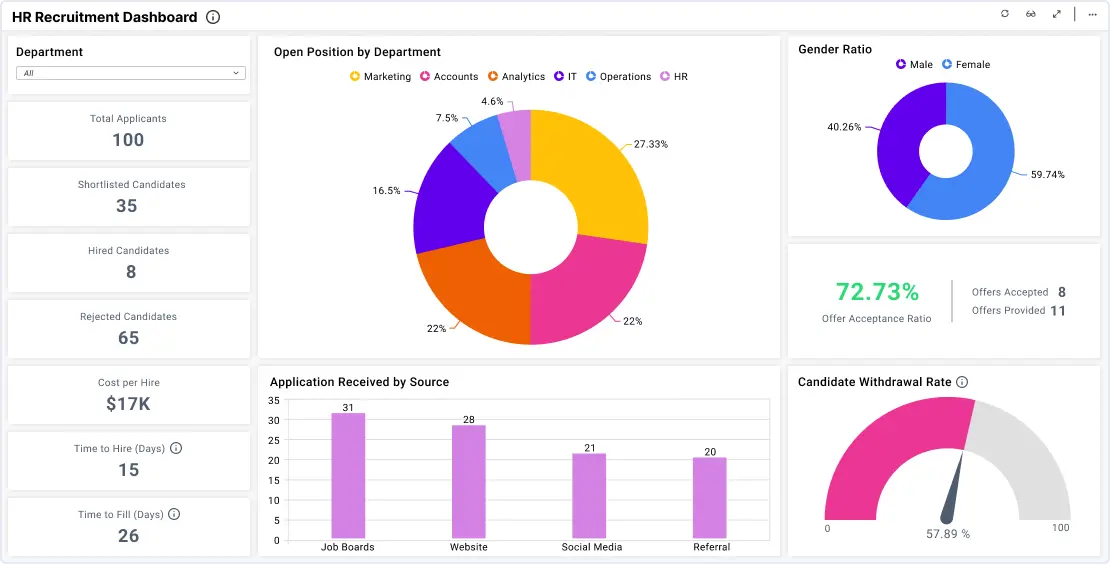
HR Recruitment Dashboard

This hiring dashboard provides an overall view about the hiring process of a company along with important hr kpis and metrics.

Learn More View Dashboard
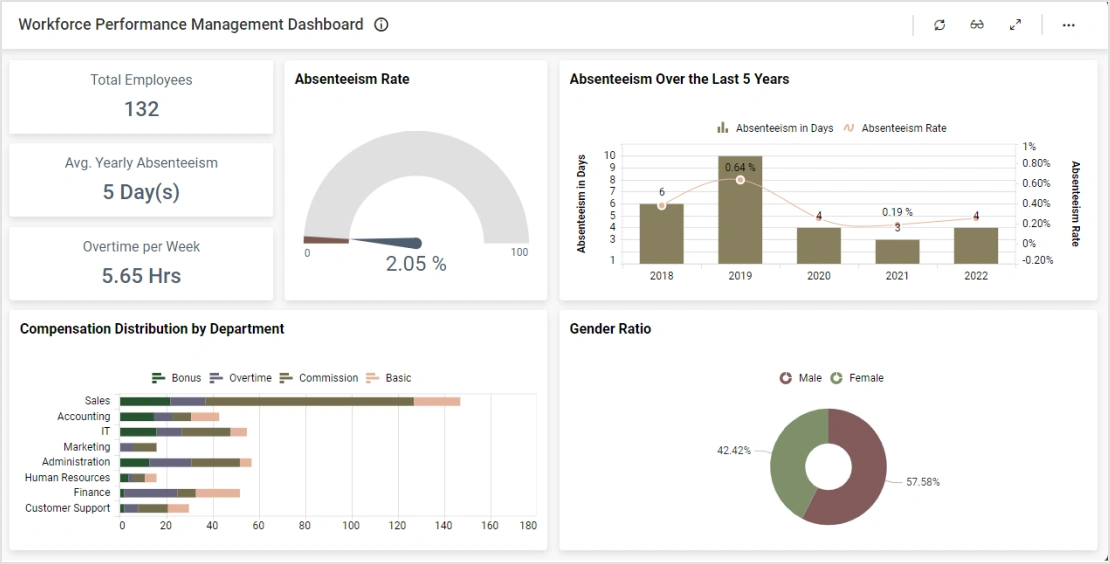
Workforce Performance Management Dashboard

This workforce dashboard provides an overview about employee performance via HR kpis such as average employee tenure...

Learn More View Dashboard
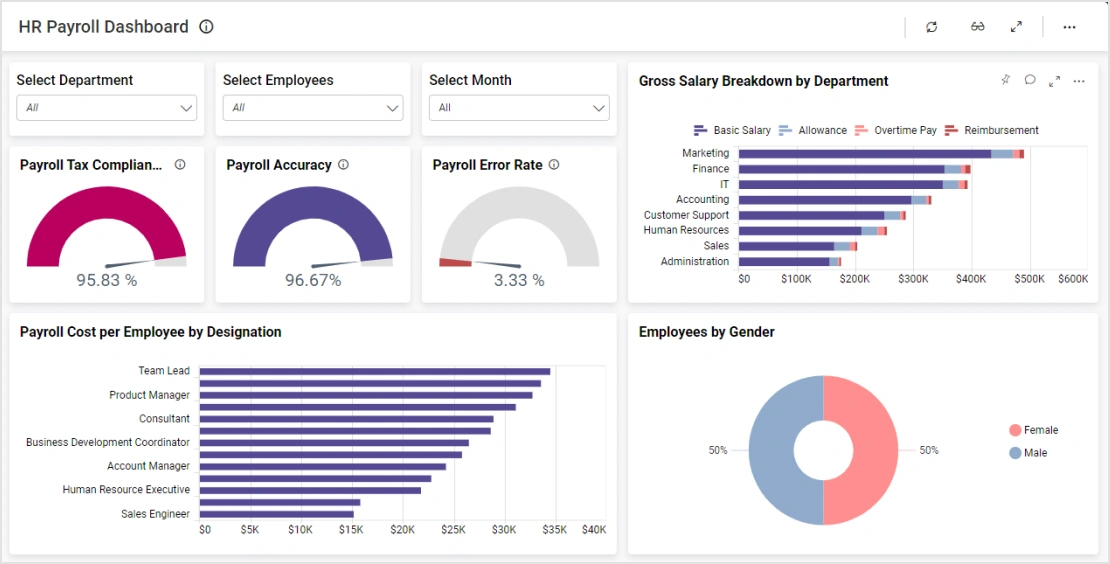
HR Payroll Dashboard

This dashboard allows HR team members to track key payroll metrics. With this dashboard...

Learn More View Dashboard
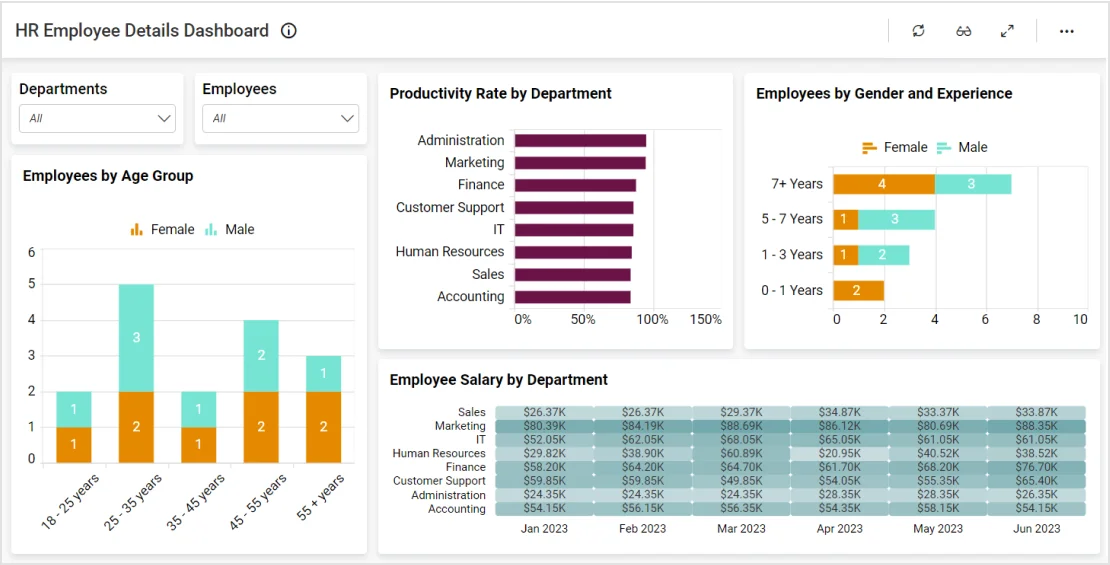
HR Employee Details Dashboard

This dashboard allows human resources team members to track key employee details. With this dashboard...

Learn More View Dashboard
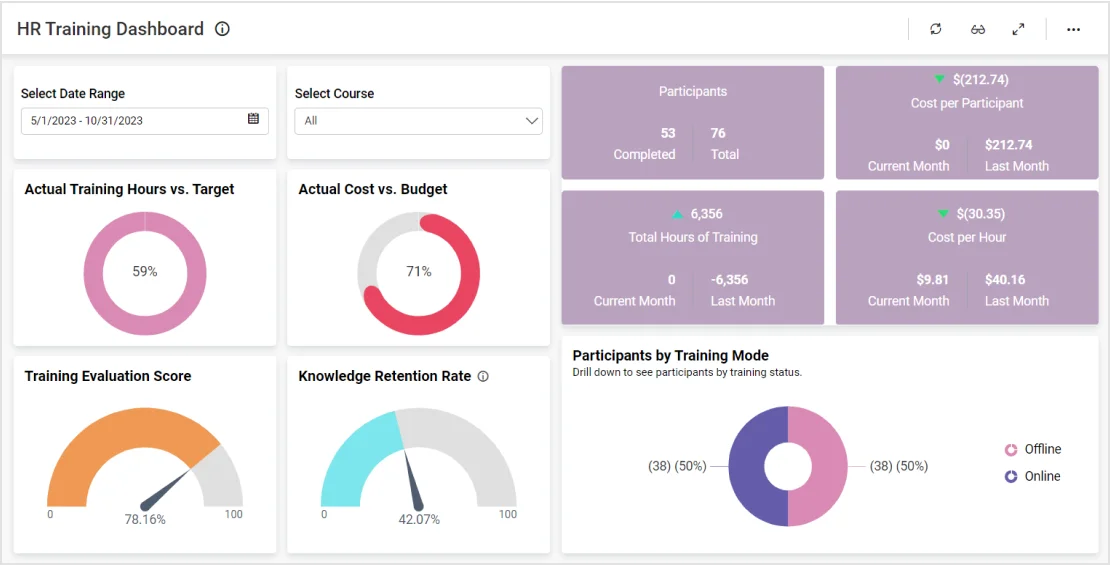
HR Training Dashboard

This dashboard allows human resources team members to track training progress. Using it, leaders can answer the following...

Learn More View Dashboard
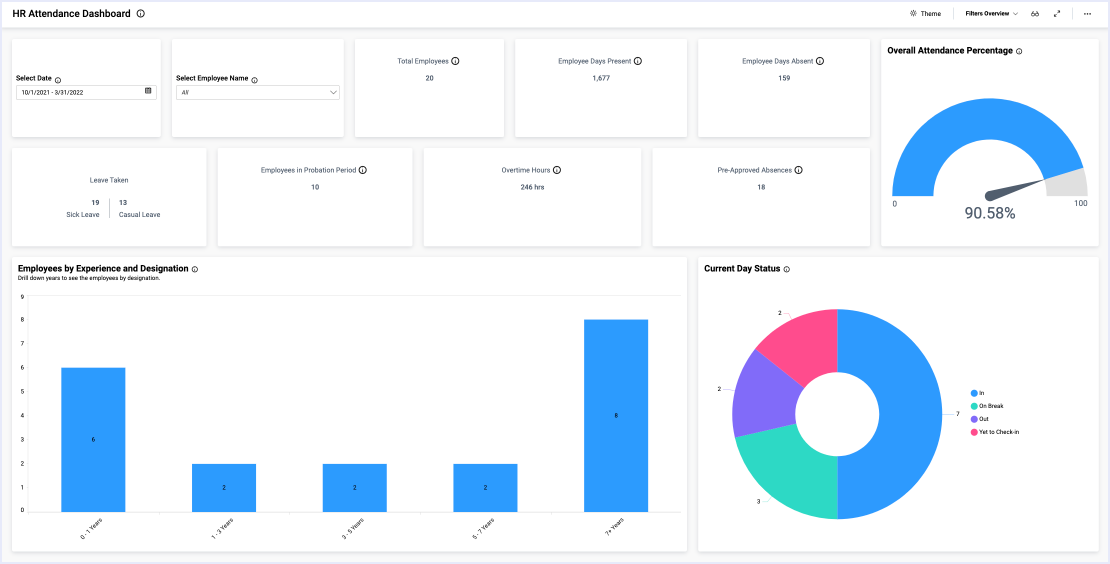
HR Attendance Dashboard

The HR Attendance Dashboard allows the human resources team to track key employee attendance metrics. With...

Learn More View Dashboard
HR Training Feedback Dashboard

The HR Training Feedback Dashboard allows professionals to thoroughly track a wide range of trainee and feedback metrics...

Learn More View Dashboard
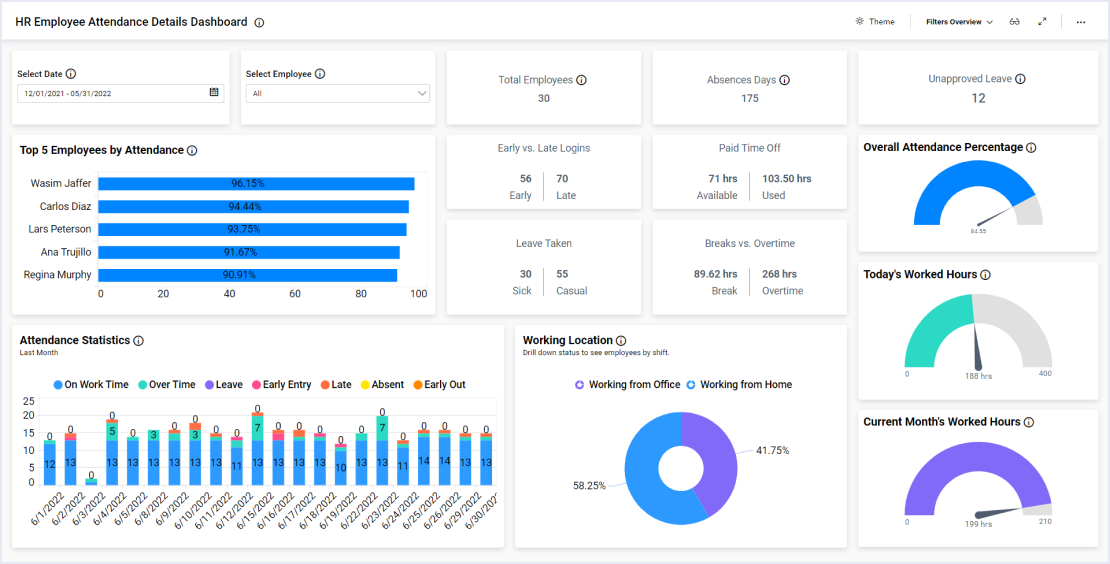
HR Employee Attendance Details Dashboard

The HR Employee Attendance Dashboard allows business leaders to thoroughly track a wide range of attendance based metrics...

Learn More View Dashboard
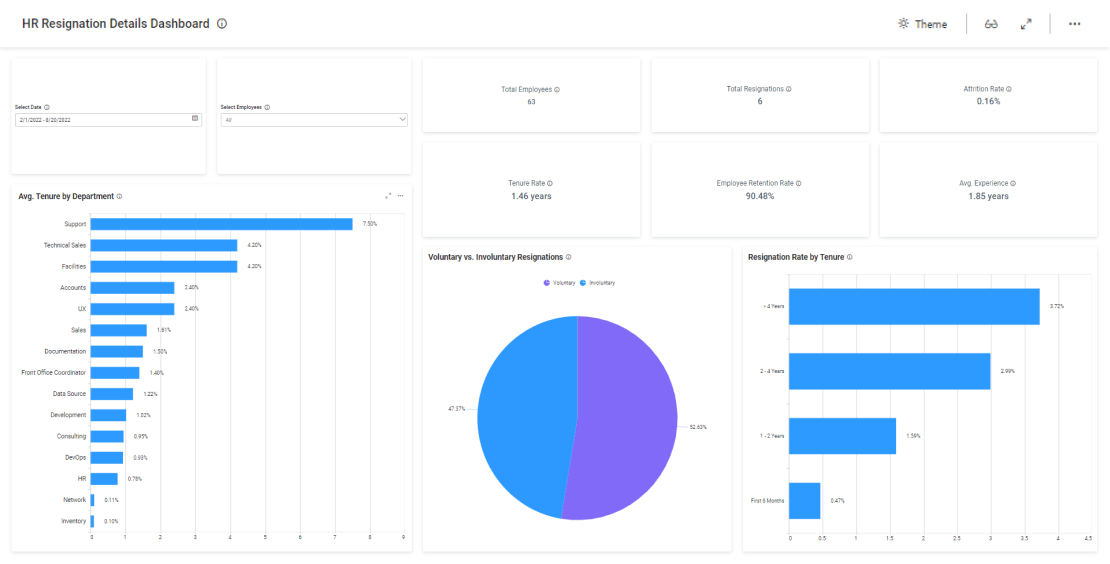
HR Resignation Details Dashboard

This dashboard allows human resources team members to track important employee resignation metrics. Using this...

Learn More View Dashboard

View Other Solutions

Hospitality

In the hospitality industry, you need to be able to monitor everything

Learn More
Information Technology

In the information technology field, you need to be able to monitor everything...

Learn More
Insurance

From evaluating claim settlement times to analyzing customer satisfaction...

Learn More

Start Embedding Powerful Analytics

Try out all the features of Bold BI® with 30-day free trial and get to know how it suit to your needs of embedded analytics.