
Embedded analytics help you integrate analytical capabilities within your business applications. Bold BI® helps you achieve this easily, so you can maintain your website and analytical processes in one place and increase your business productivity. In this blog, we look at how to create and embed a dashboard using Google Sheets data with live updates. Using this blog, you can learn how to convert your business data stored in Google Sheets into meaningful visualizations to make business decisions effectively. This blog covers:
- How Google Sheets data is represented
- How to connect to Google Sheets
- How to integrate Google Sheets data with other data sources
- How to create a dashboard using Google Sheets data
- How to schedule data refreshes for a Google Sheets dashboard
- How to embed a Google Sheets dashboard
How Google Sheets data is represented
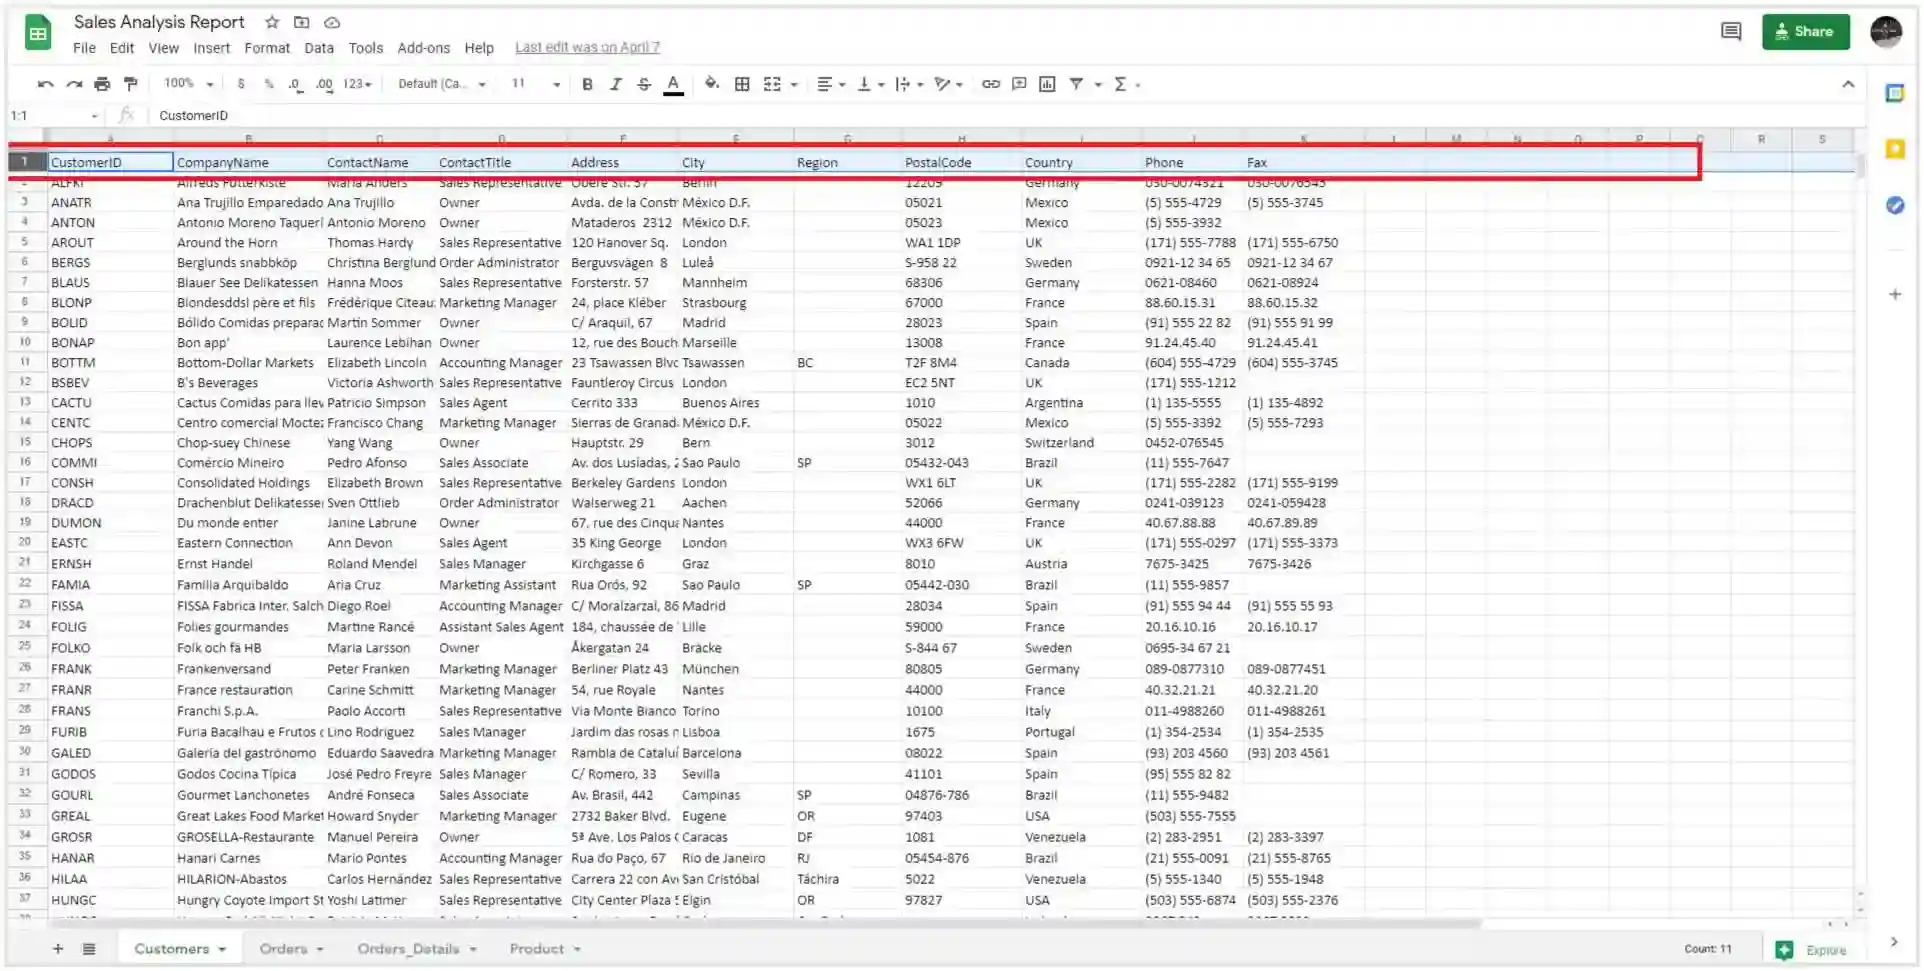
Google Sheets can be accessed through your personal Gmail account and is a free online spreadsheet workspace for personal or business use. The Google Sheets data structure is similar to Excel in that you can maintain a formatted document. Here is one such view of a document showing how Google Sheets data is represented.
How to connect to Google Sheets
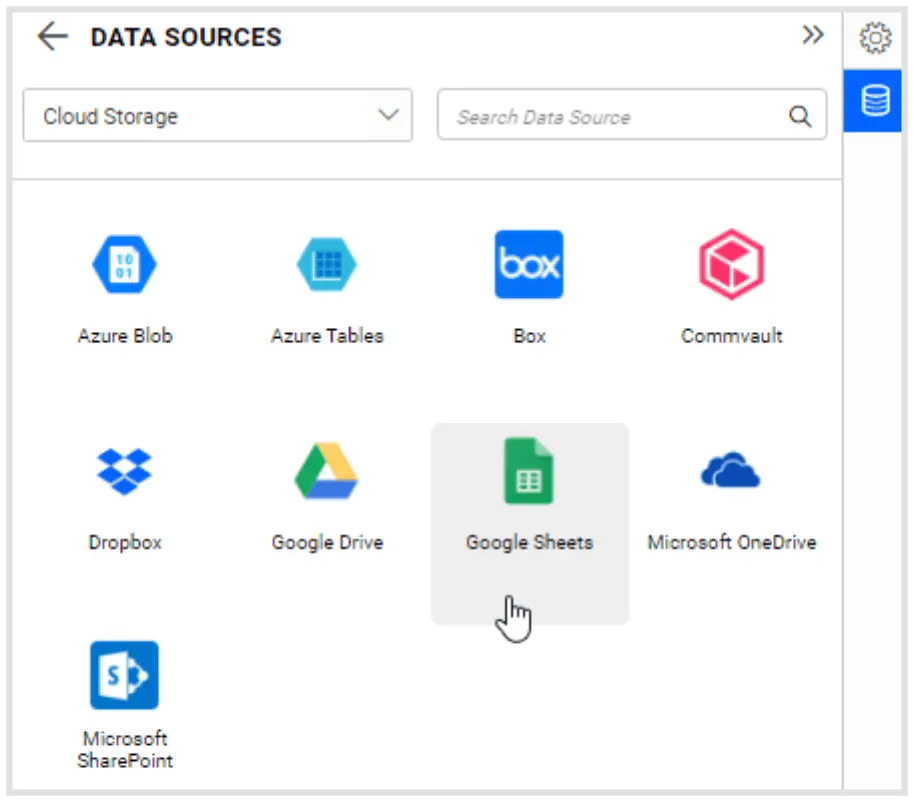
Bold BI allows you to connect Google Sheets data from a Google account to the Dashboard Designer. To create a Google Sheets data source from the Dashboard Designer, open the Data Sources configuration panel and select Google Sheets from the Cloud Storage category.
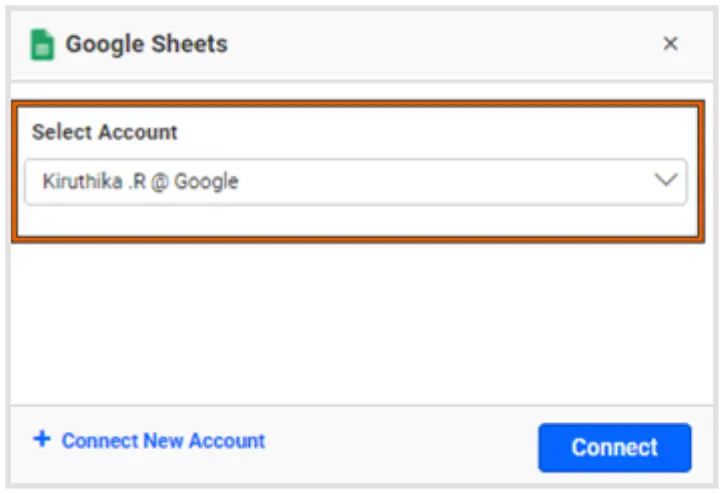
The Google Sheets connection window opens, as shown in the following image.
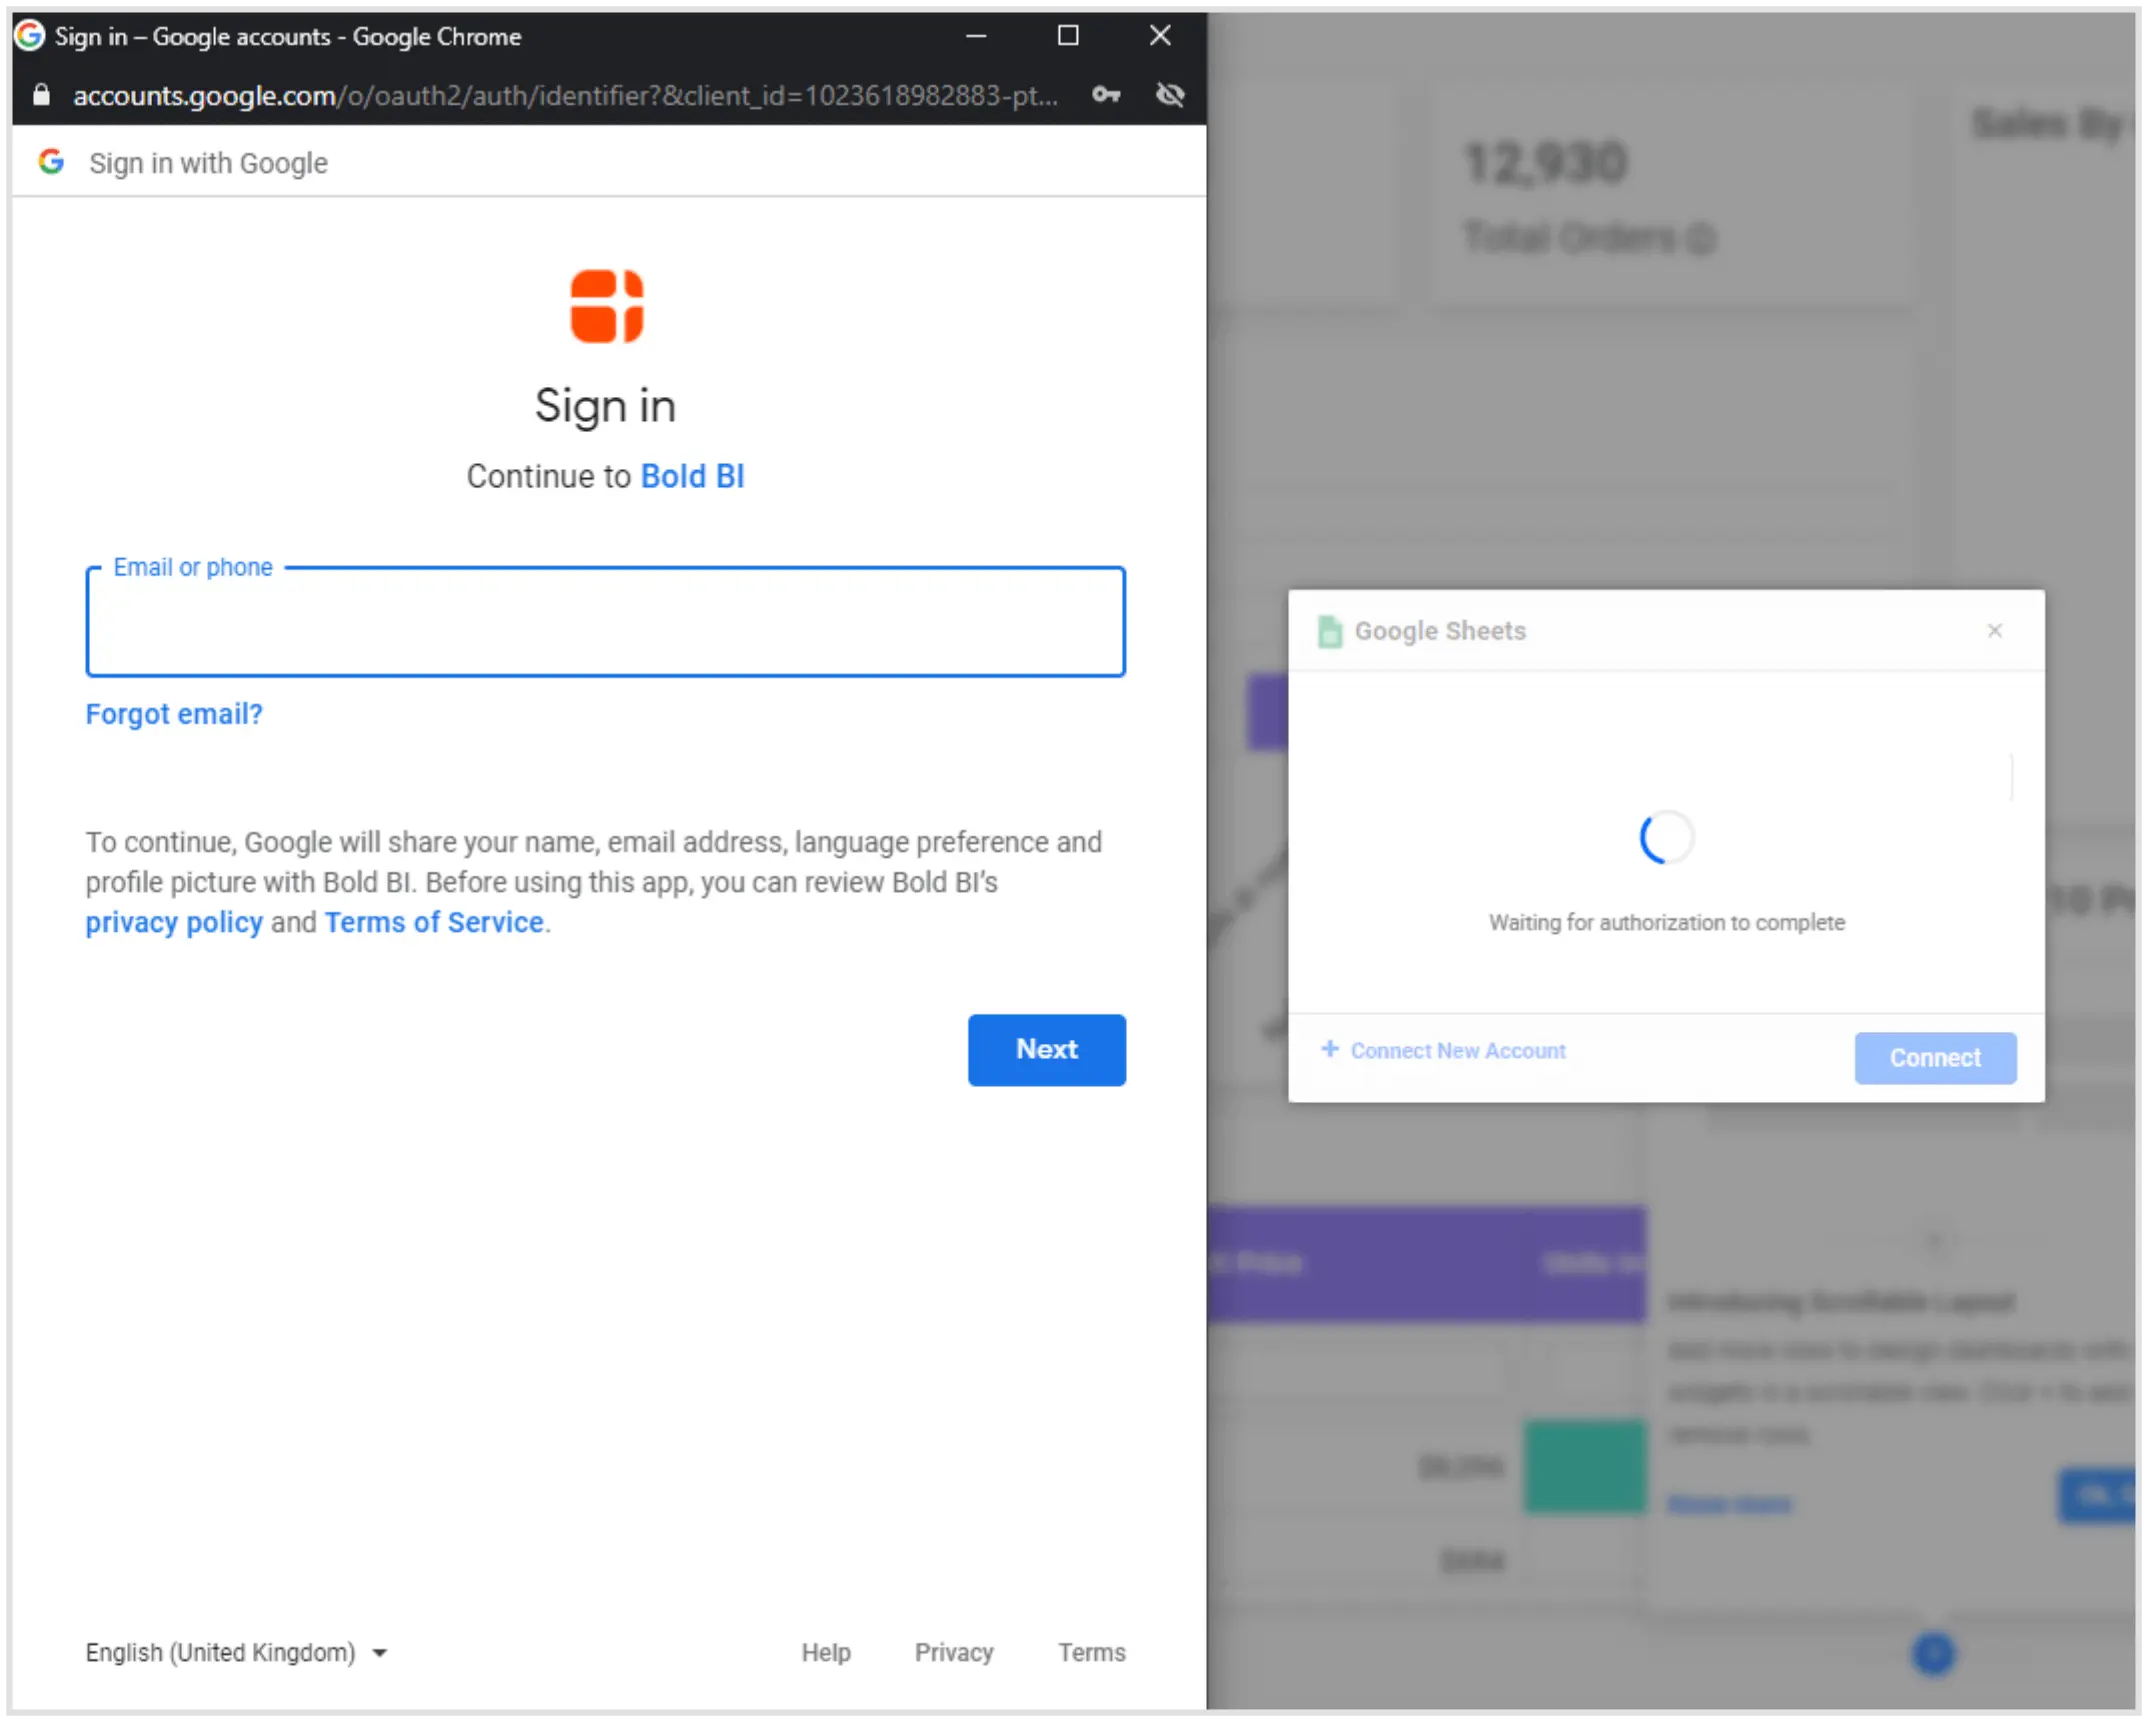
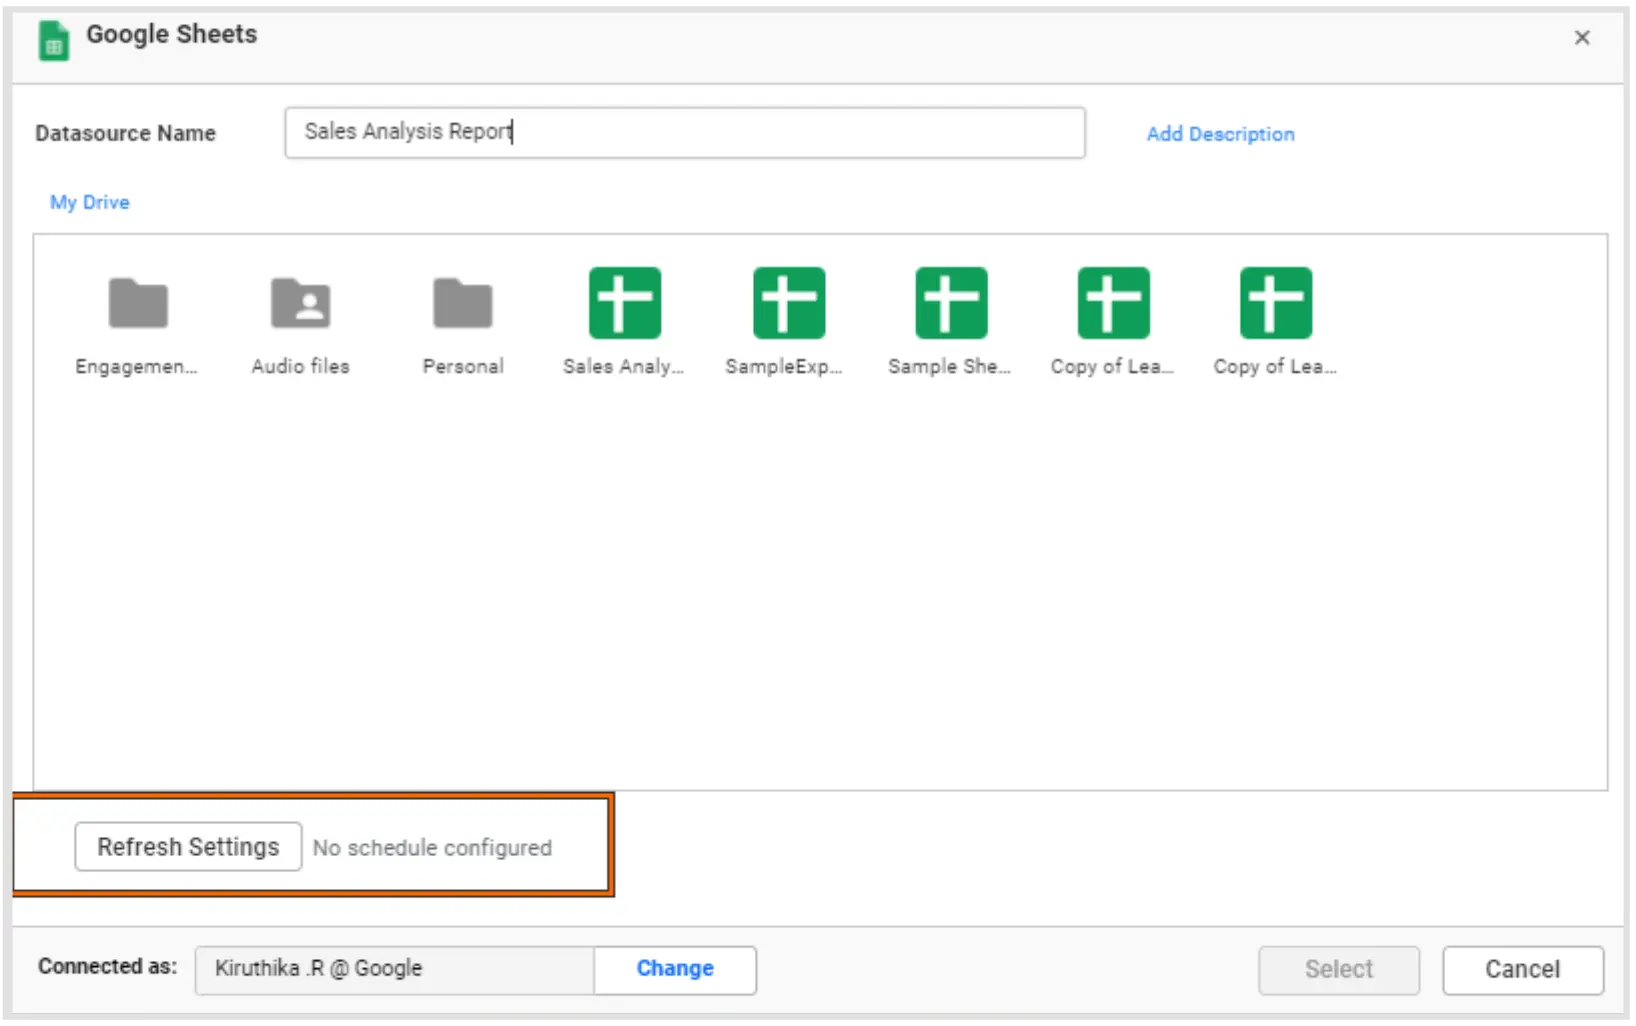
We have to enter our Google account details and sign into the account. Once you’ve configured the Google account, choose your Google account from window as shown in the following picture.
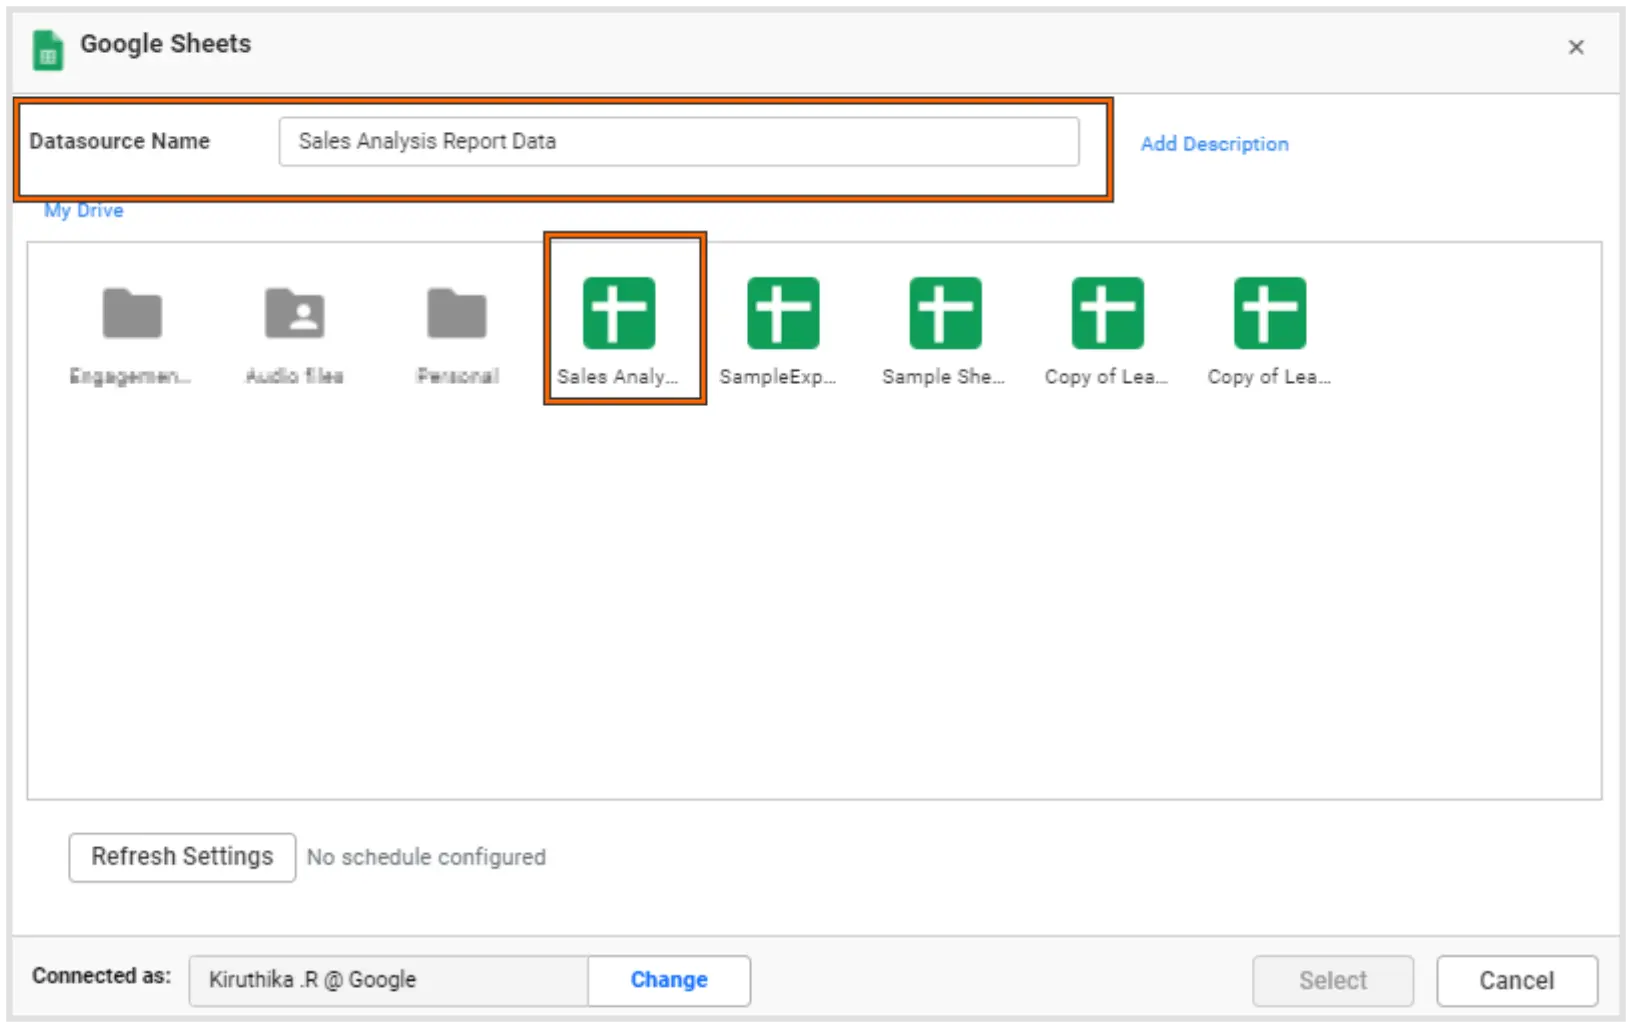
We can select Google Sheets from the Google account and provide the name of the data source in the configuration window.
After selecting the appropriate Google sheet, it will show the list of worksheets in that Google sheet. The first-row values of your worksheet will be considered column names by default in Bold BI. So, provide unique and meaningful column names in your spreadsheet that will make it easy to identify your data.
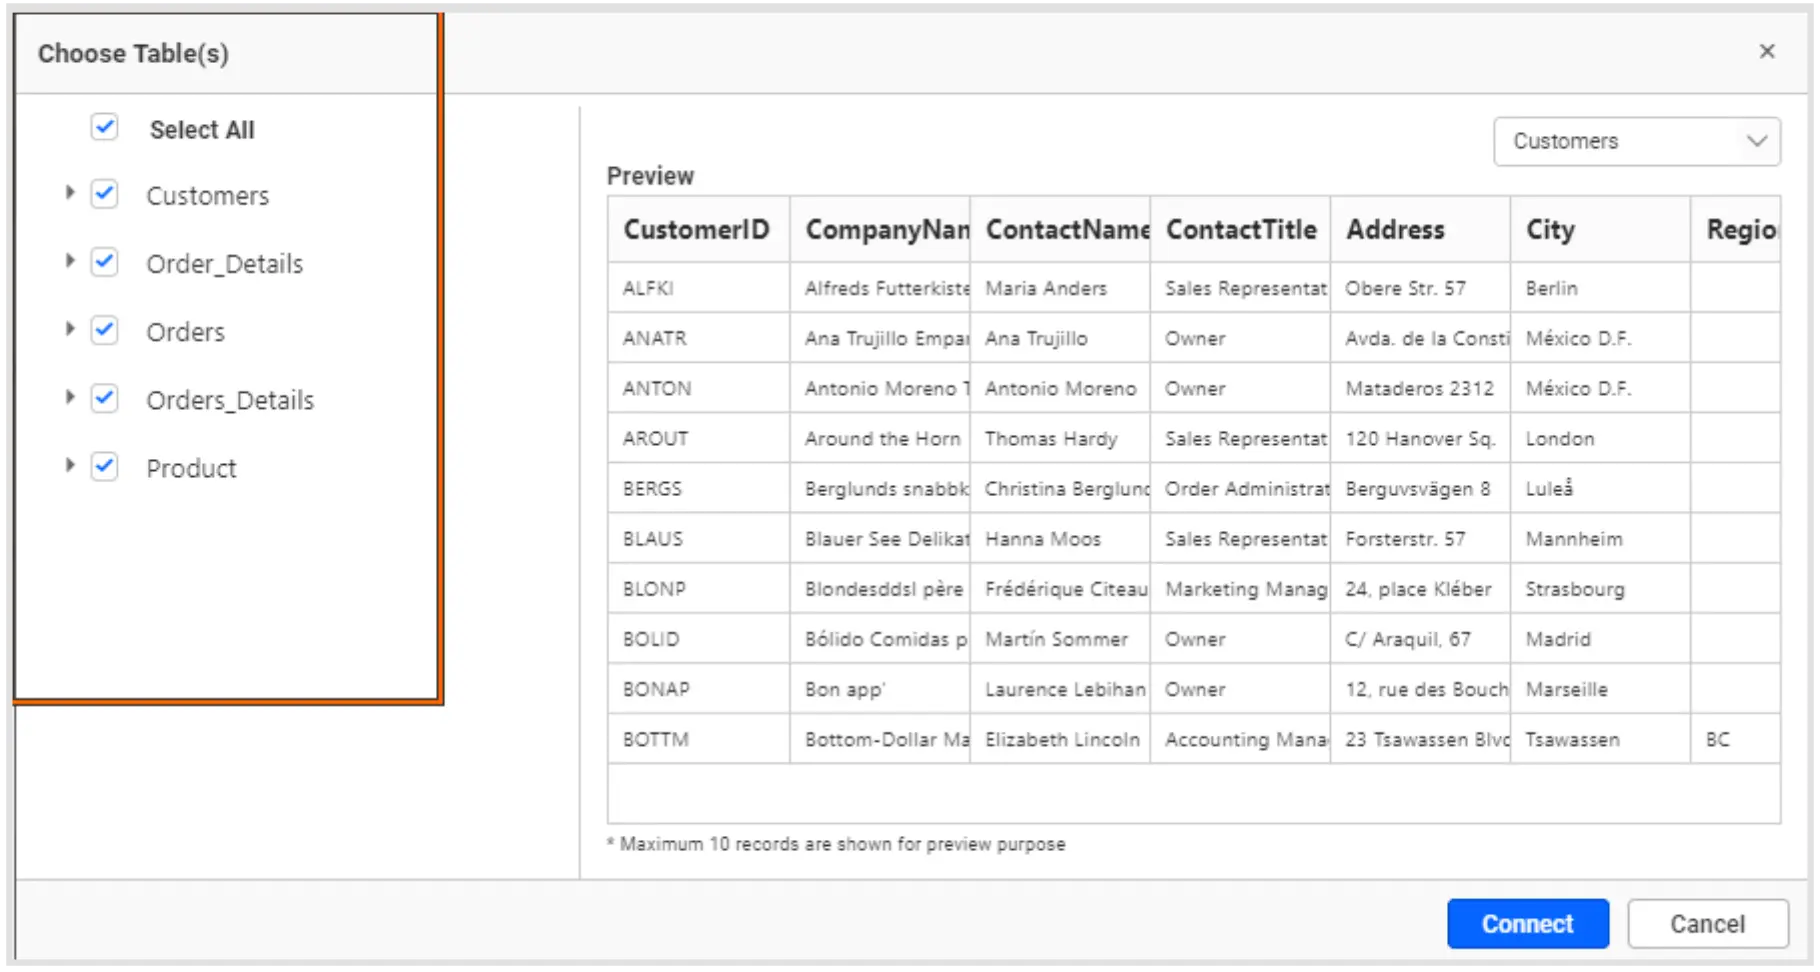
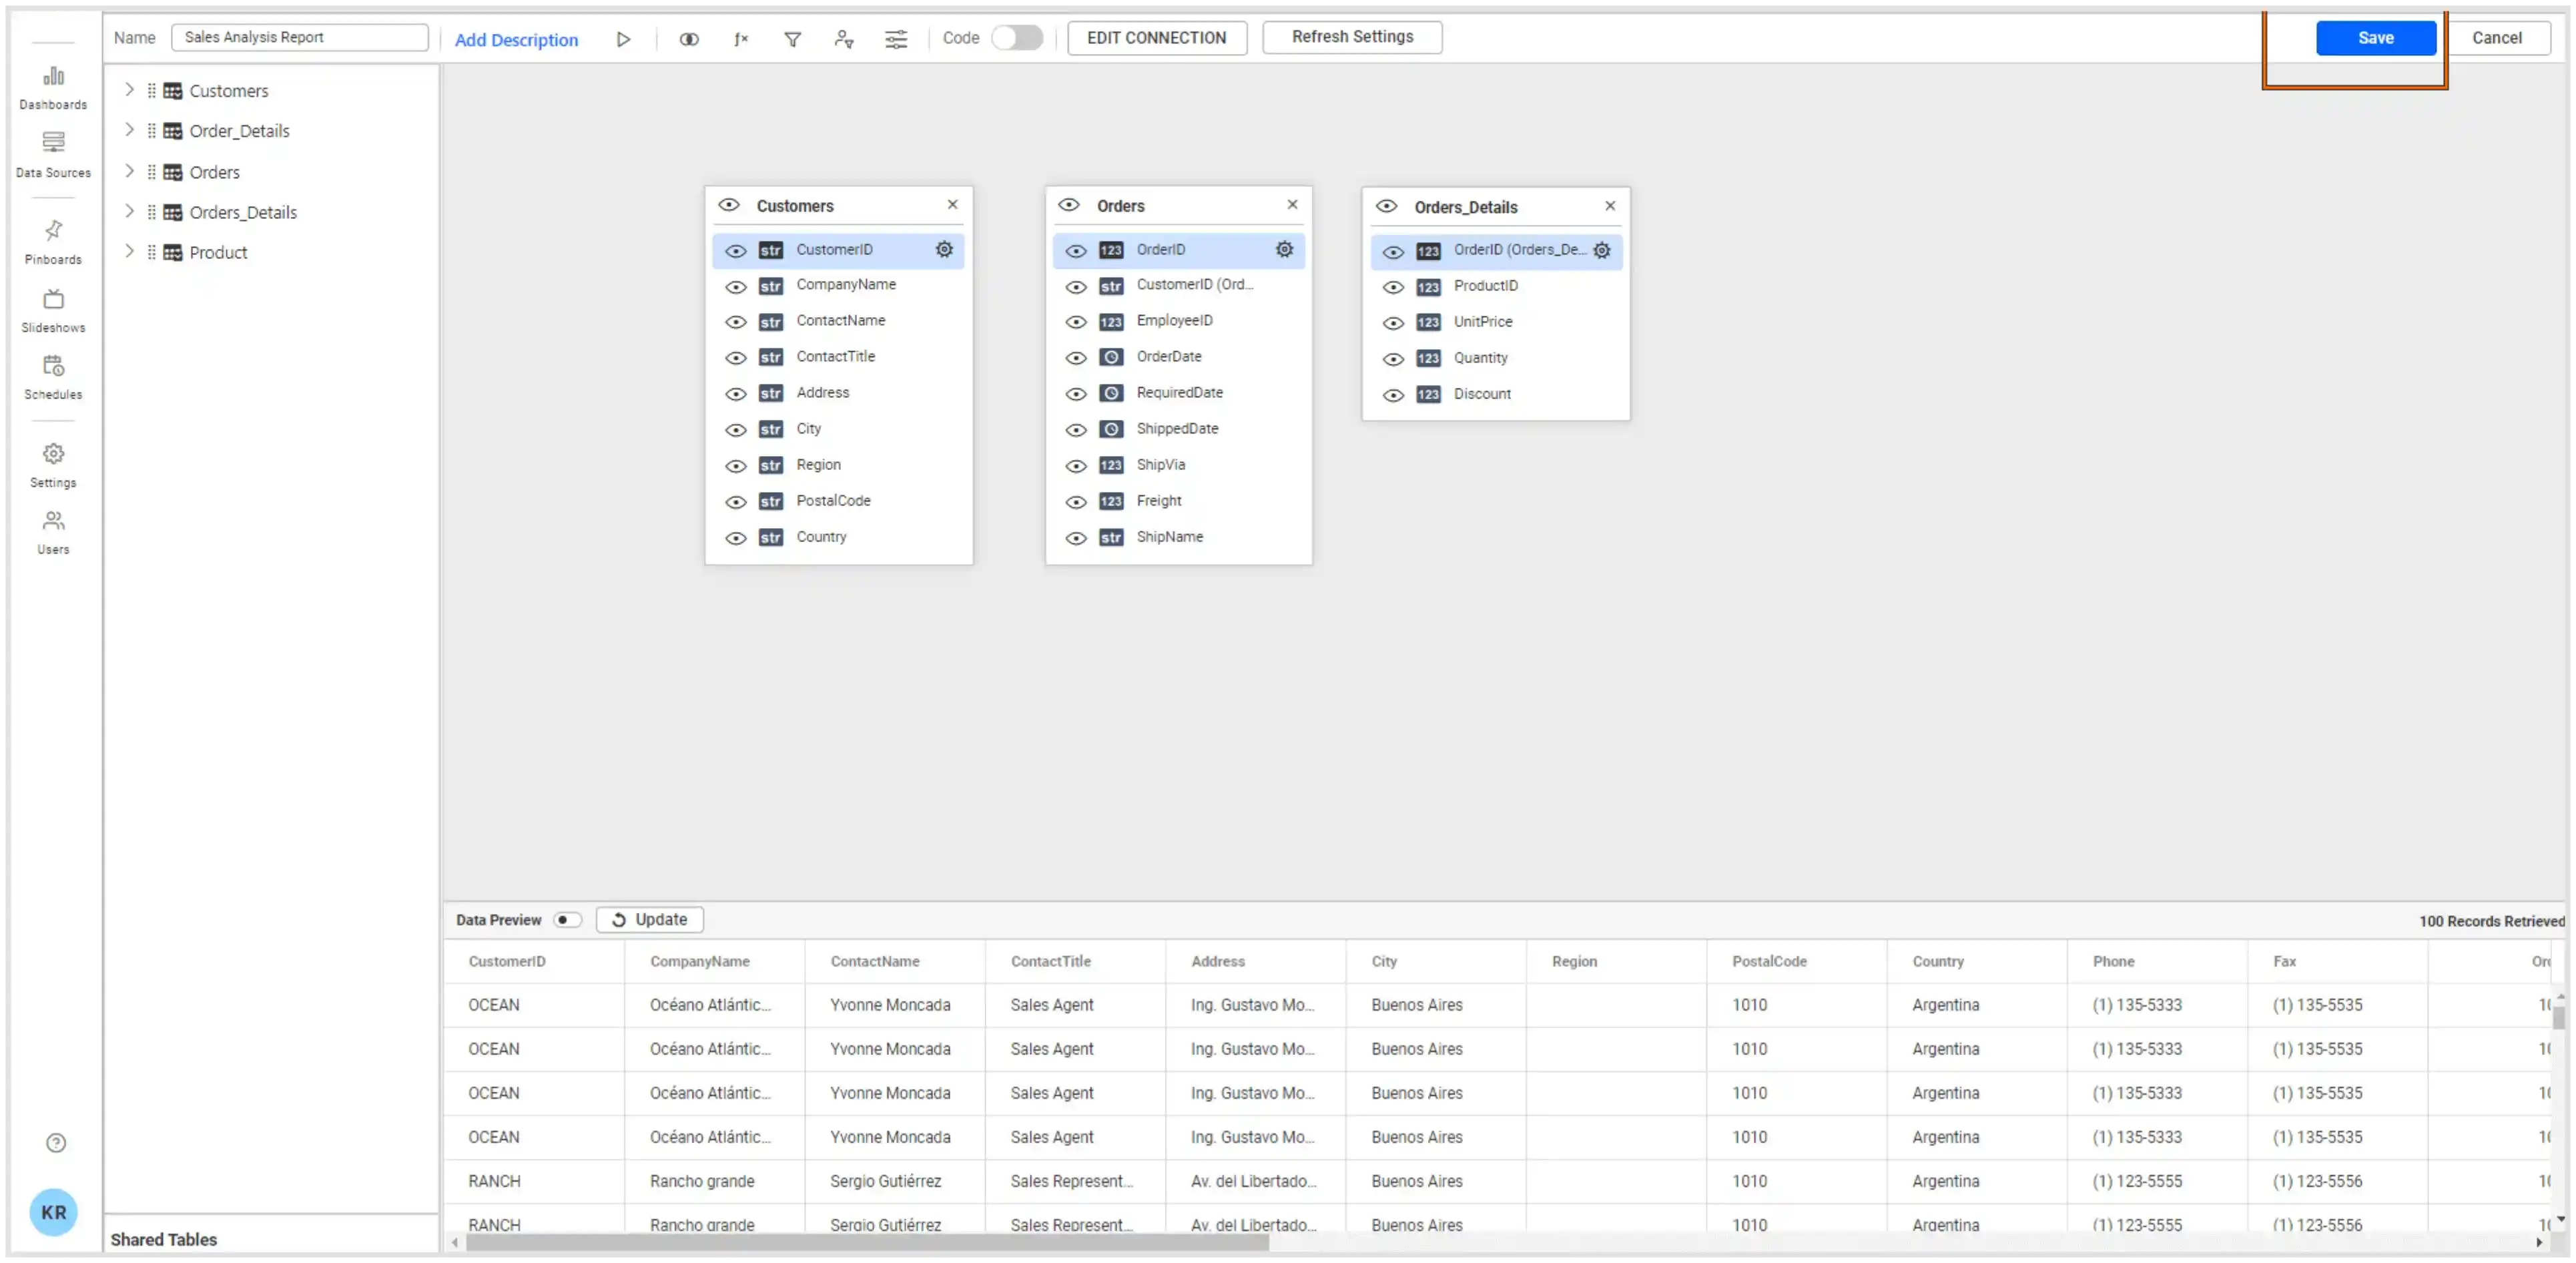
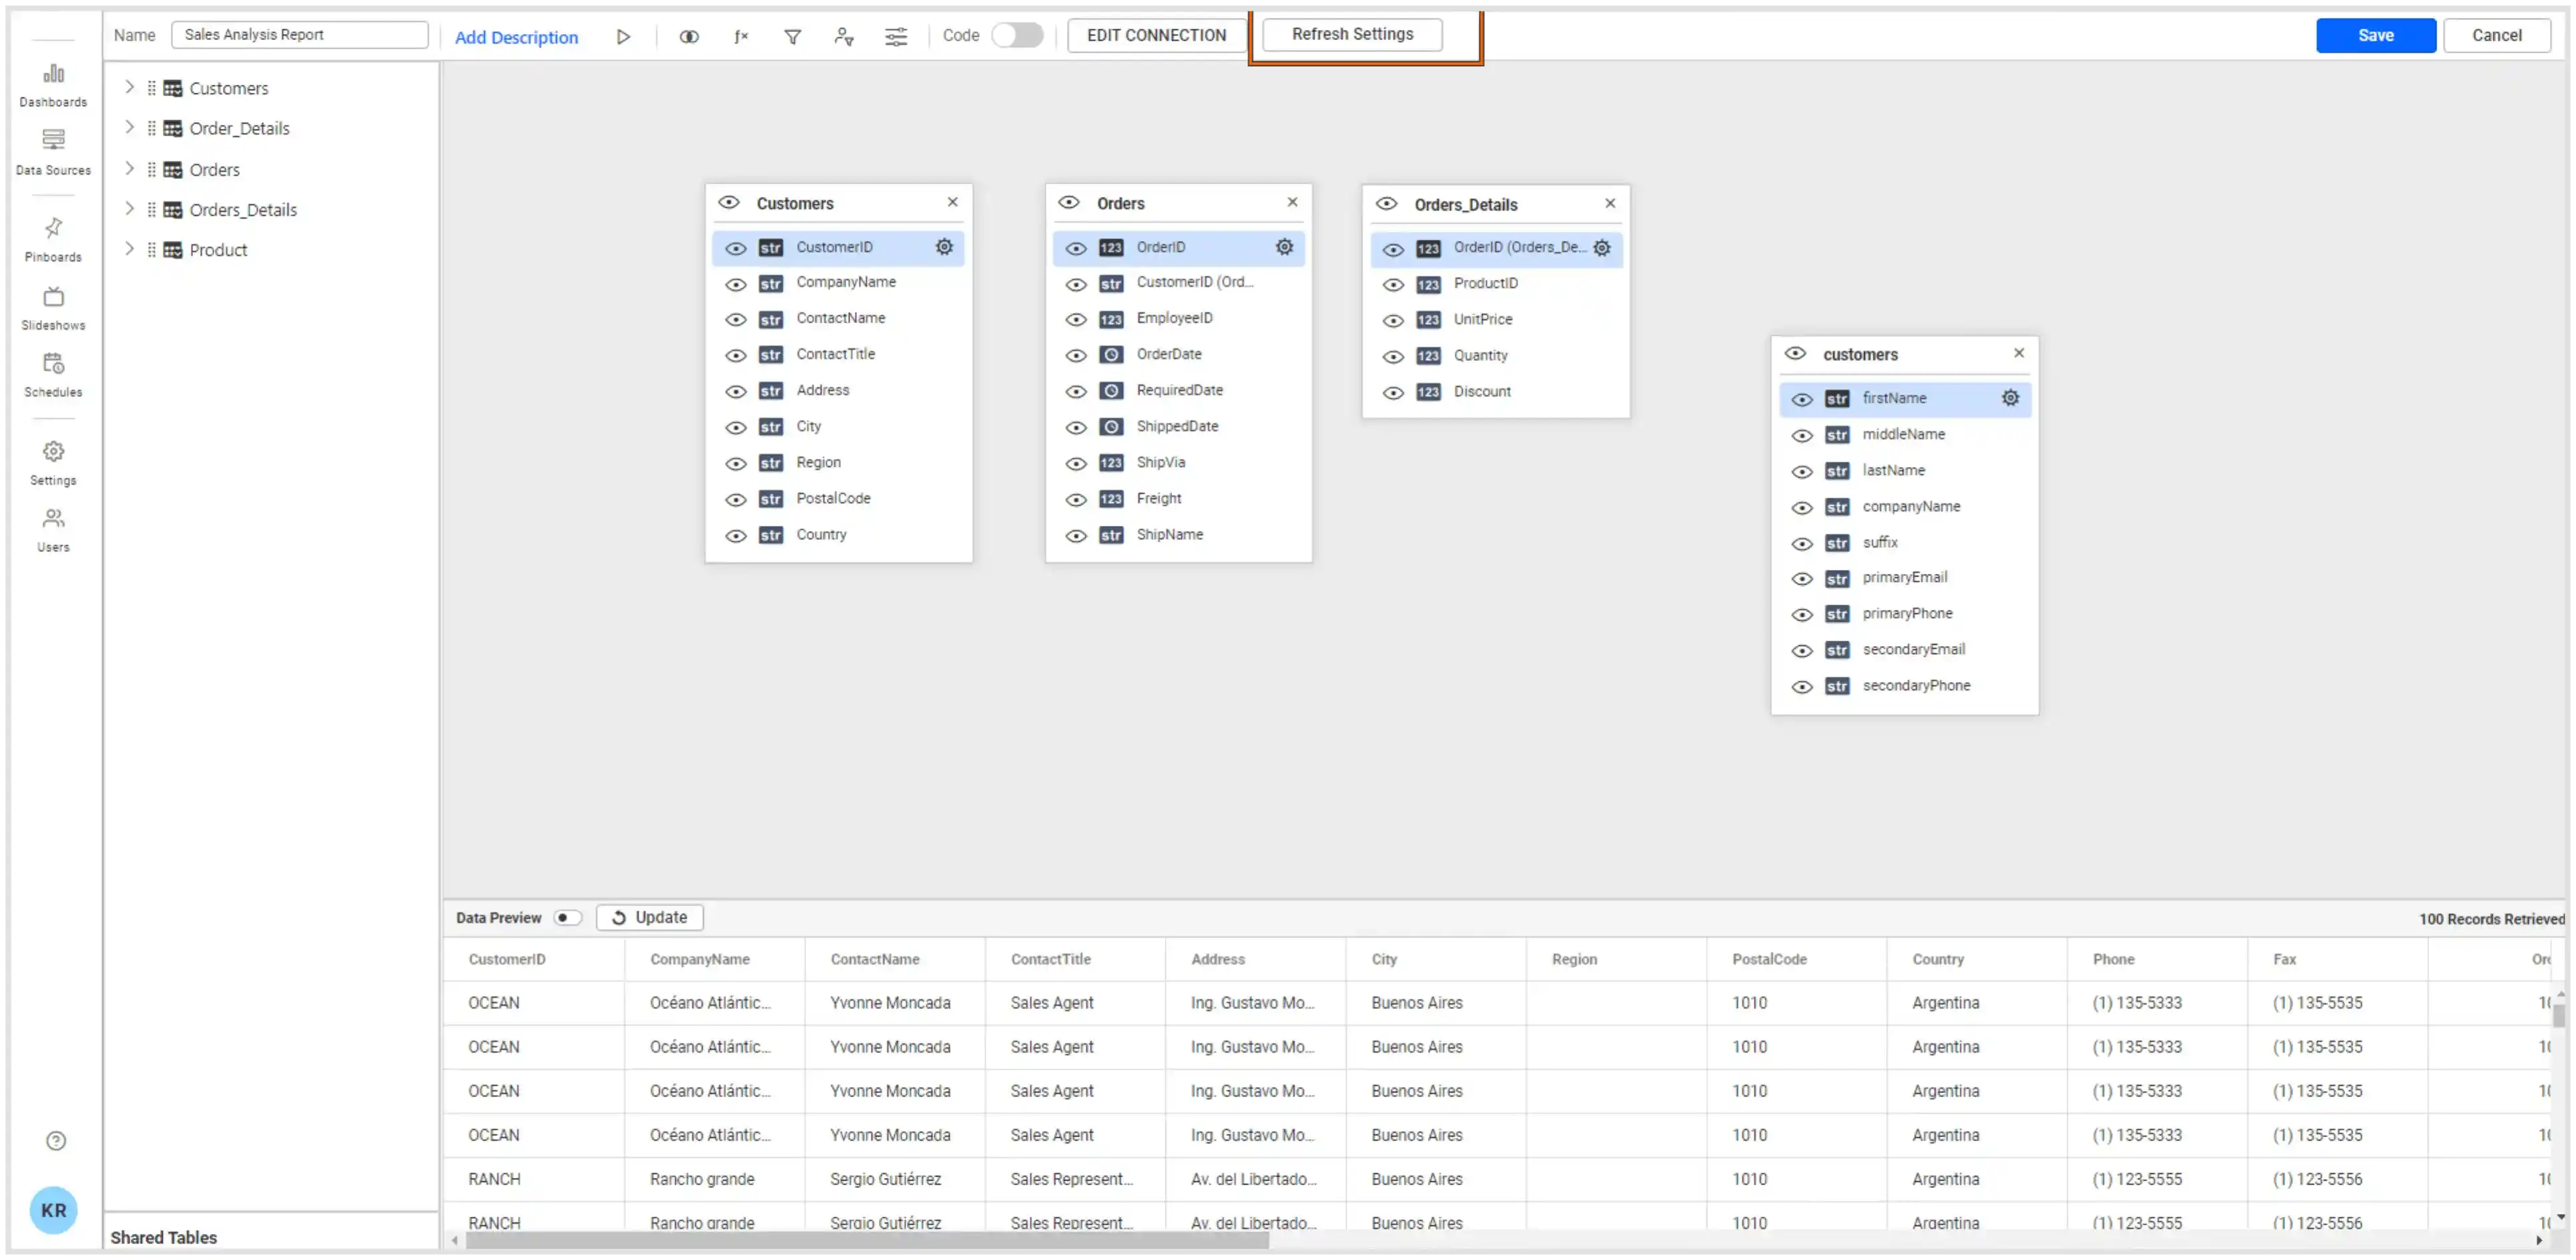
Choose the desired tables and click Connect. Now your selected data will move to the intermediate database specially reserved for your tenant. Once that’s done, you will be directed to Bold BI’s data source designer. The Google Sheets schema is listed in a tree view on the left side of the editing window.
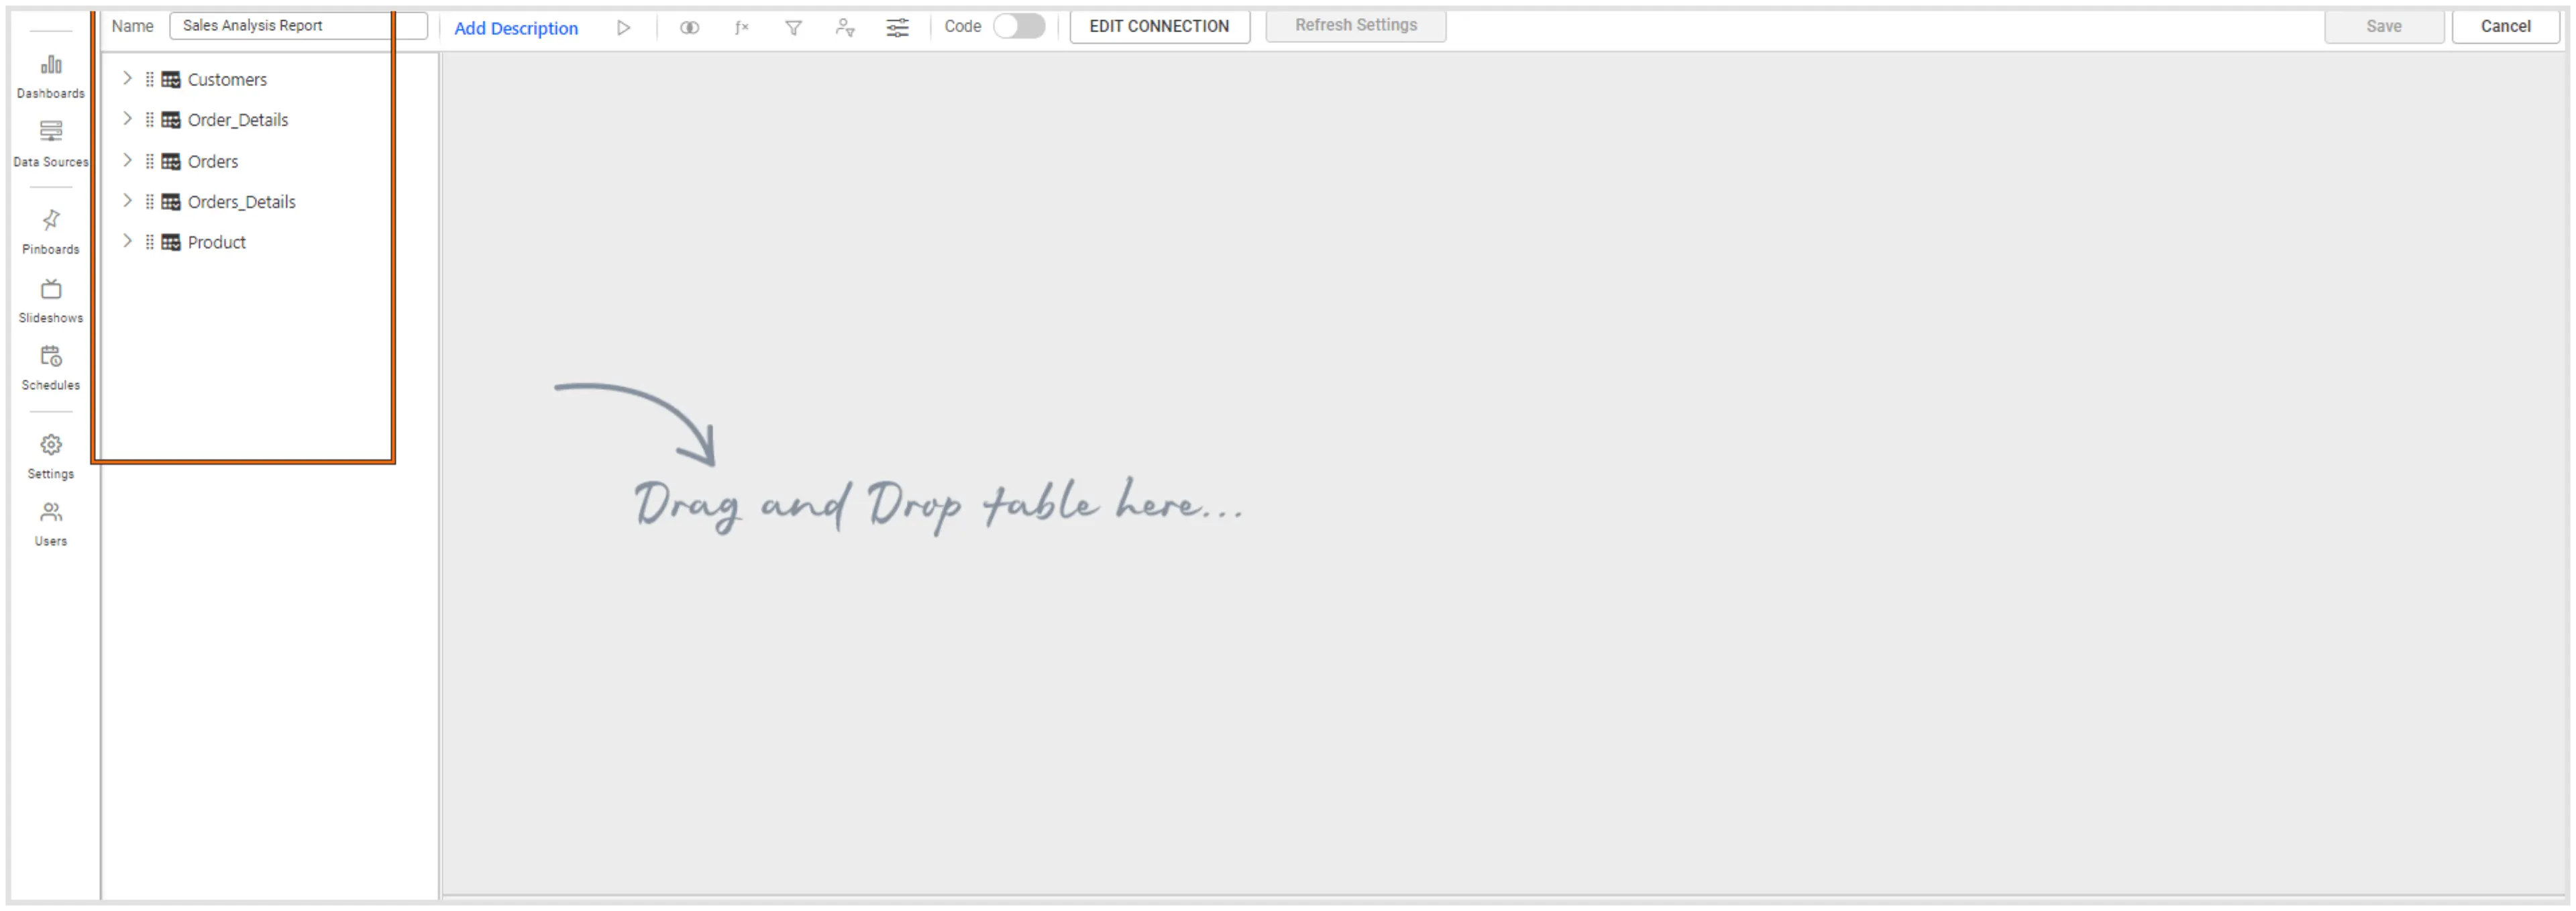
Drag and drop the table you want to analyze and save the data source.
How to integrate Google Sheets data with other data sources
Joining data from multiple data sources is a common requirement for various online applications. To combine multiple data sources, use the Shared Tables panel at the bottom of the data source designer.
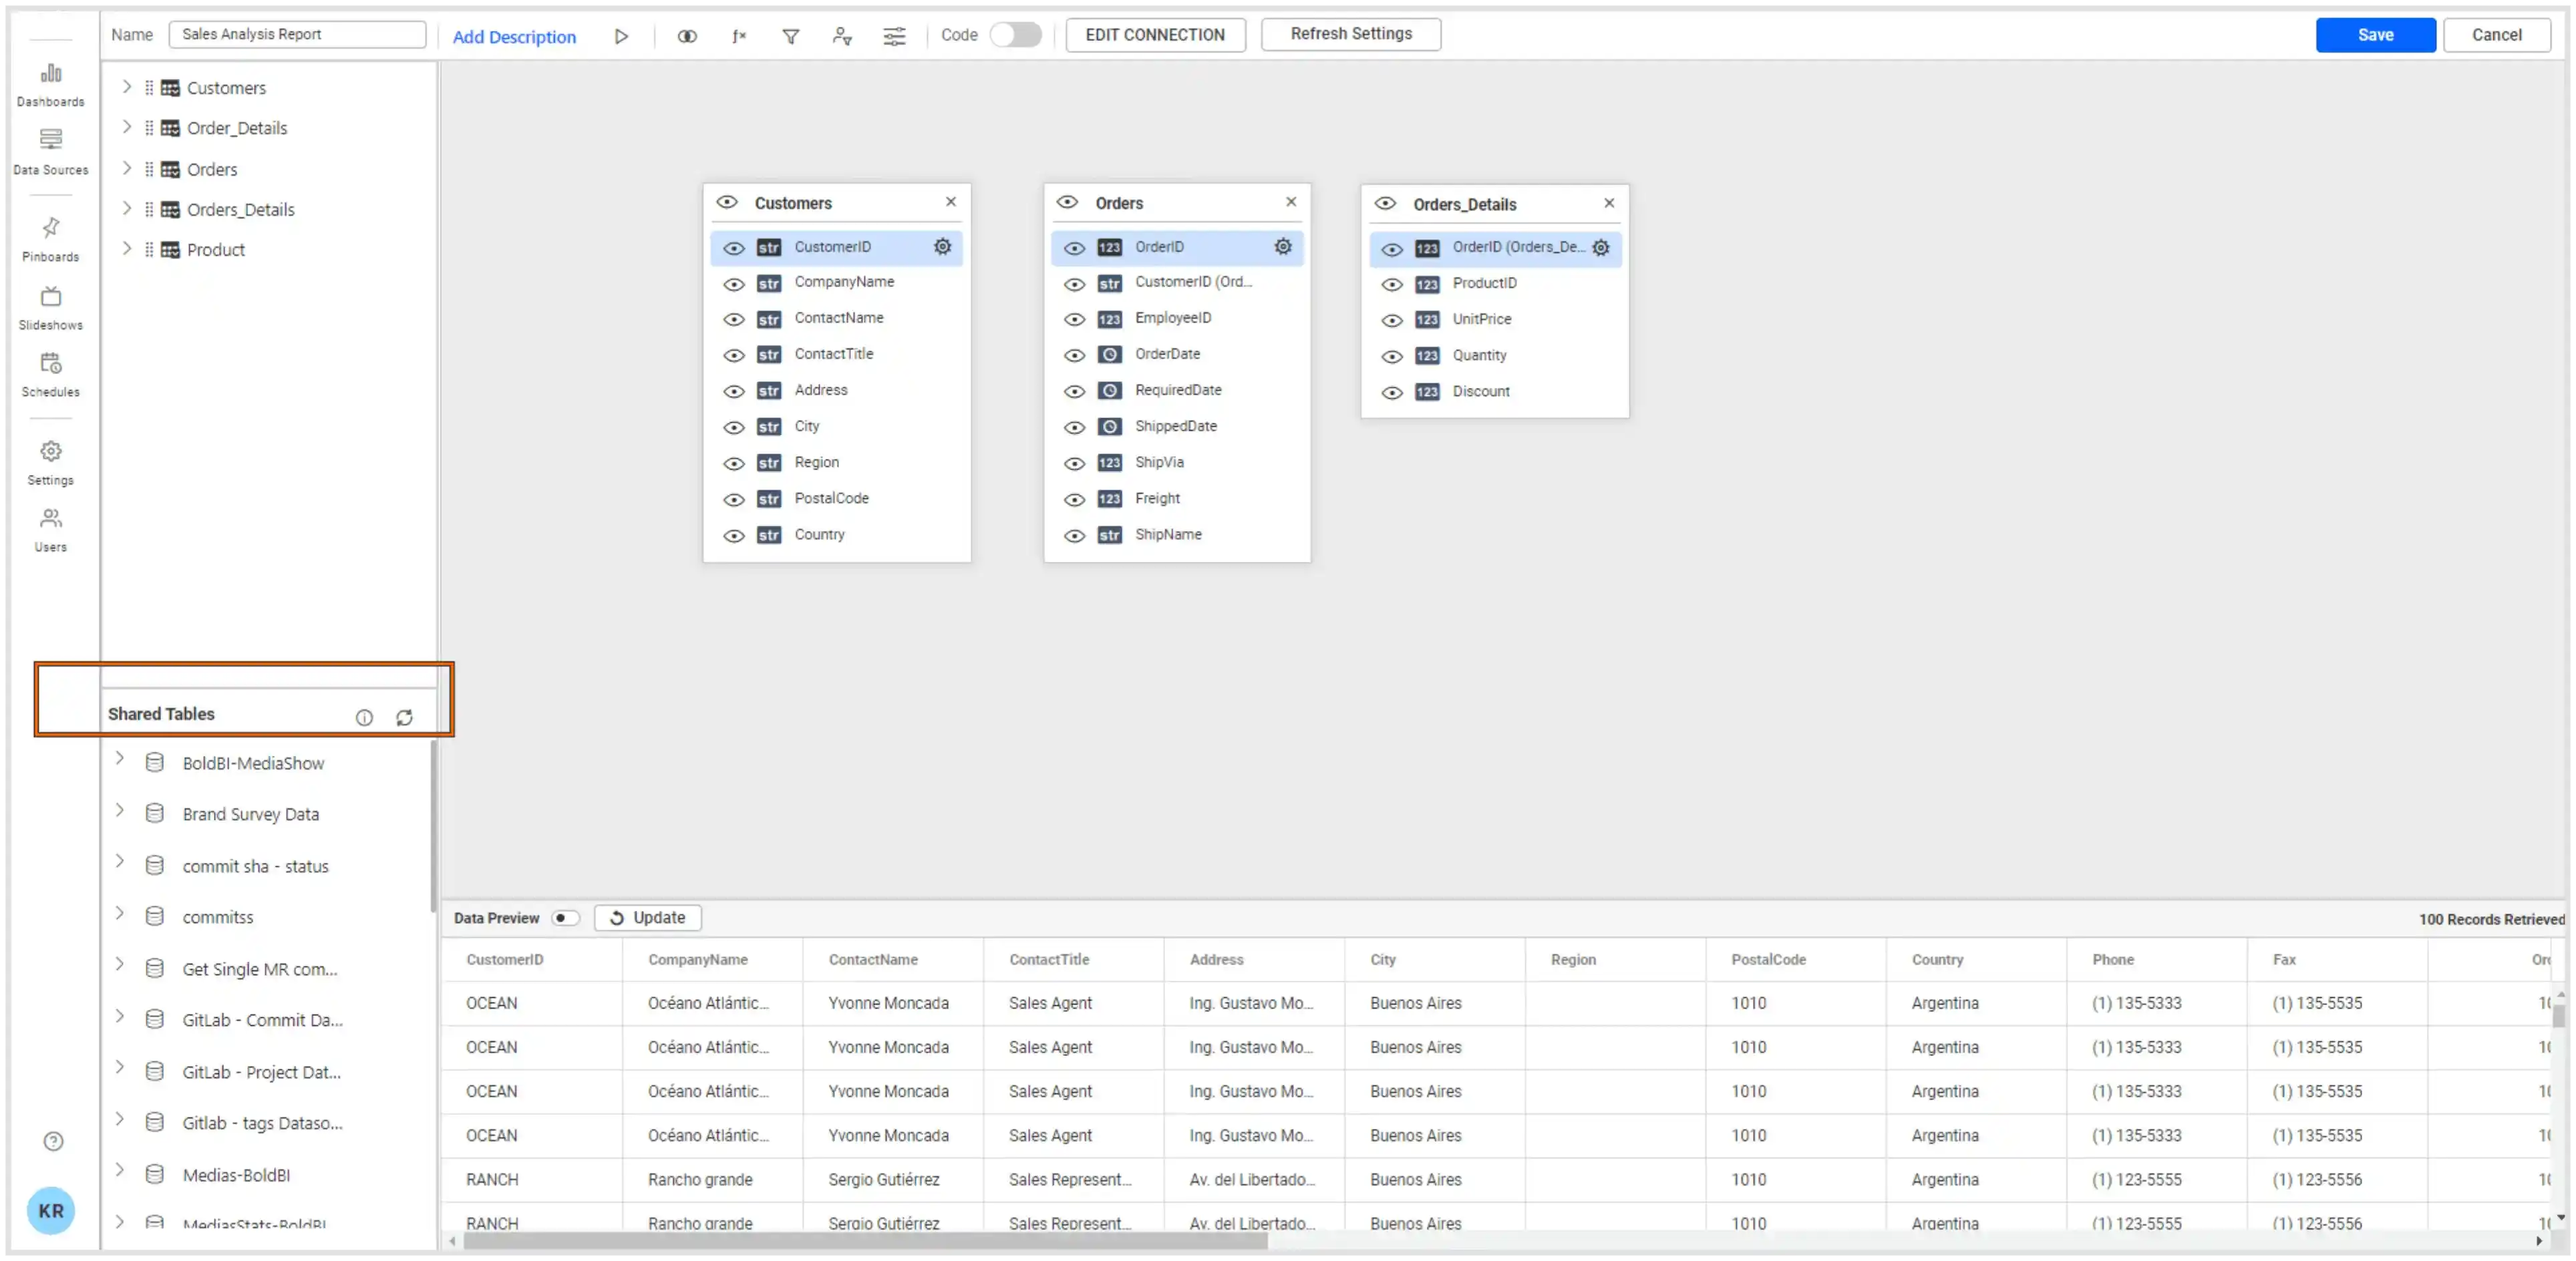
This pane displays the data sources you have permission to access. By default, the data sources you created previously for this or any other dashboard will be listed here. You can drag them to the canvas, as shown in the image, to integrate them.
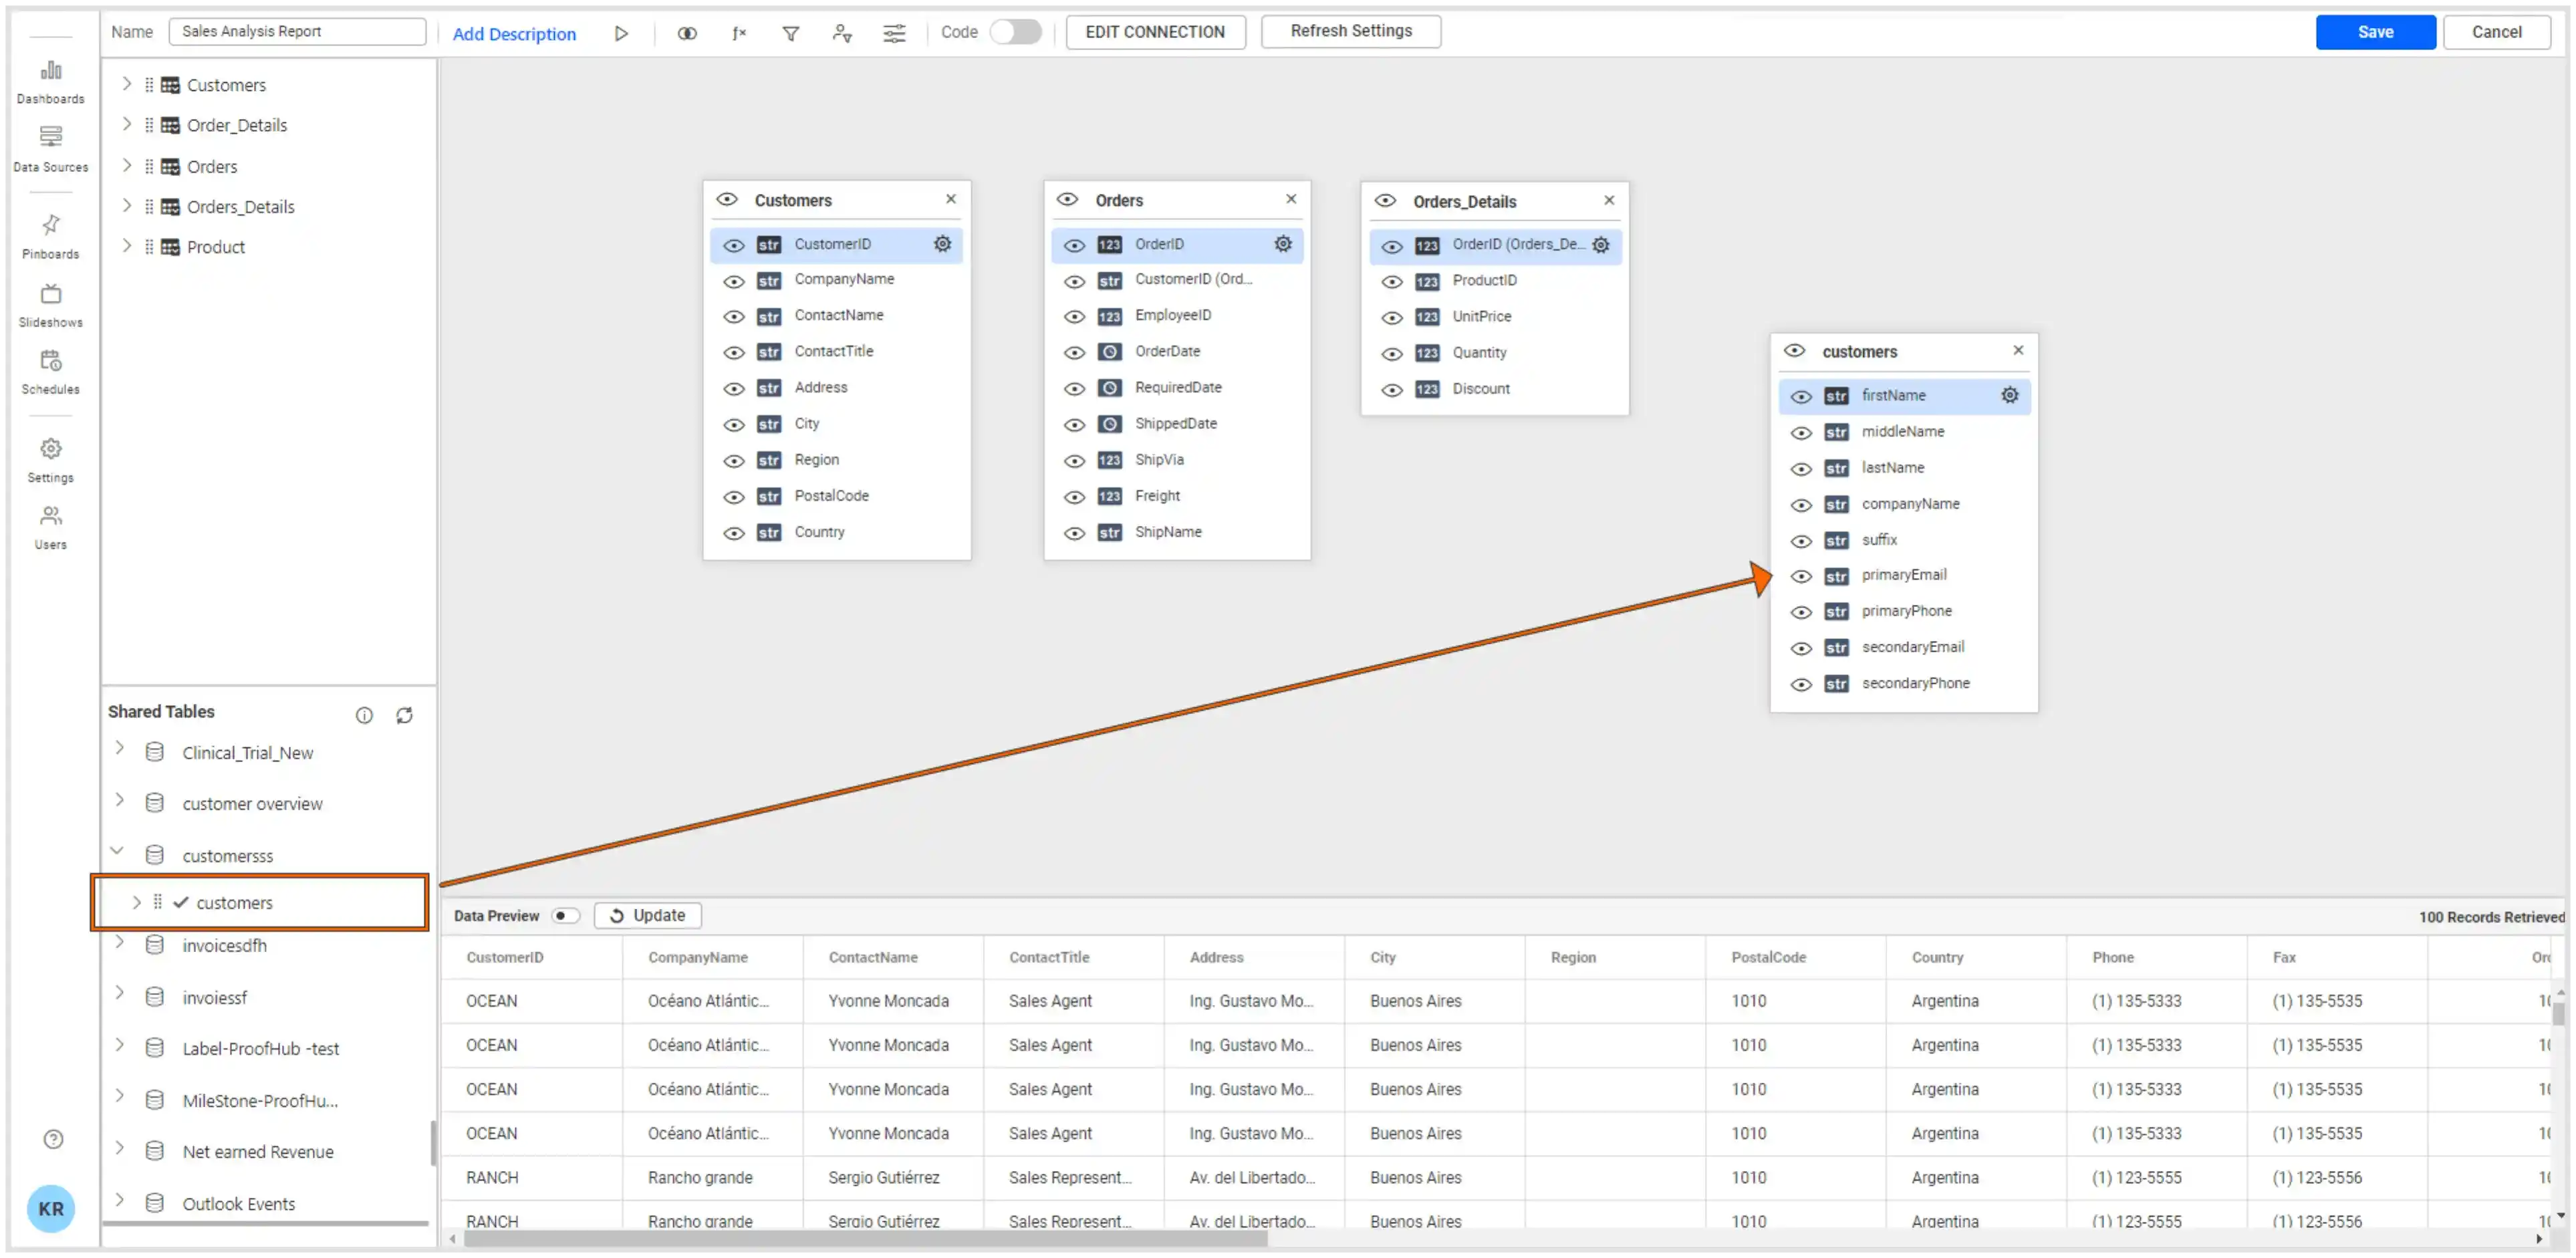
One example is using data from Google Analytics and Stripe, which is discussed more in the blog post Track Website Conversions and Revenue Together. You can create a new data source by joining the already-created two data sources. Bold BI allows you to join tables in two or more different data sources provided they were extract-mode connections.
Now let’s see how to create a dashboard using Google Sheets data that we connected to Bold BI.
How to create a dashboard using Google Sheets data
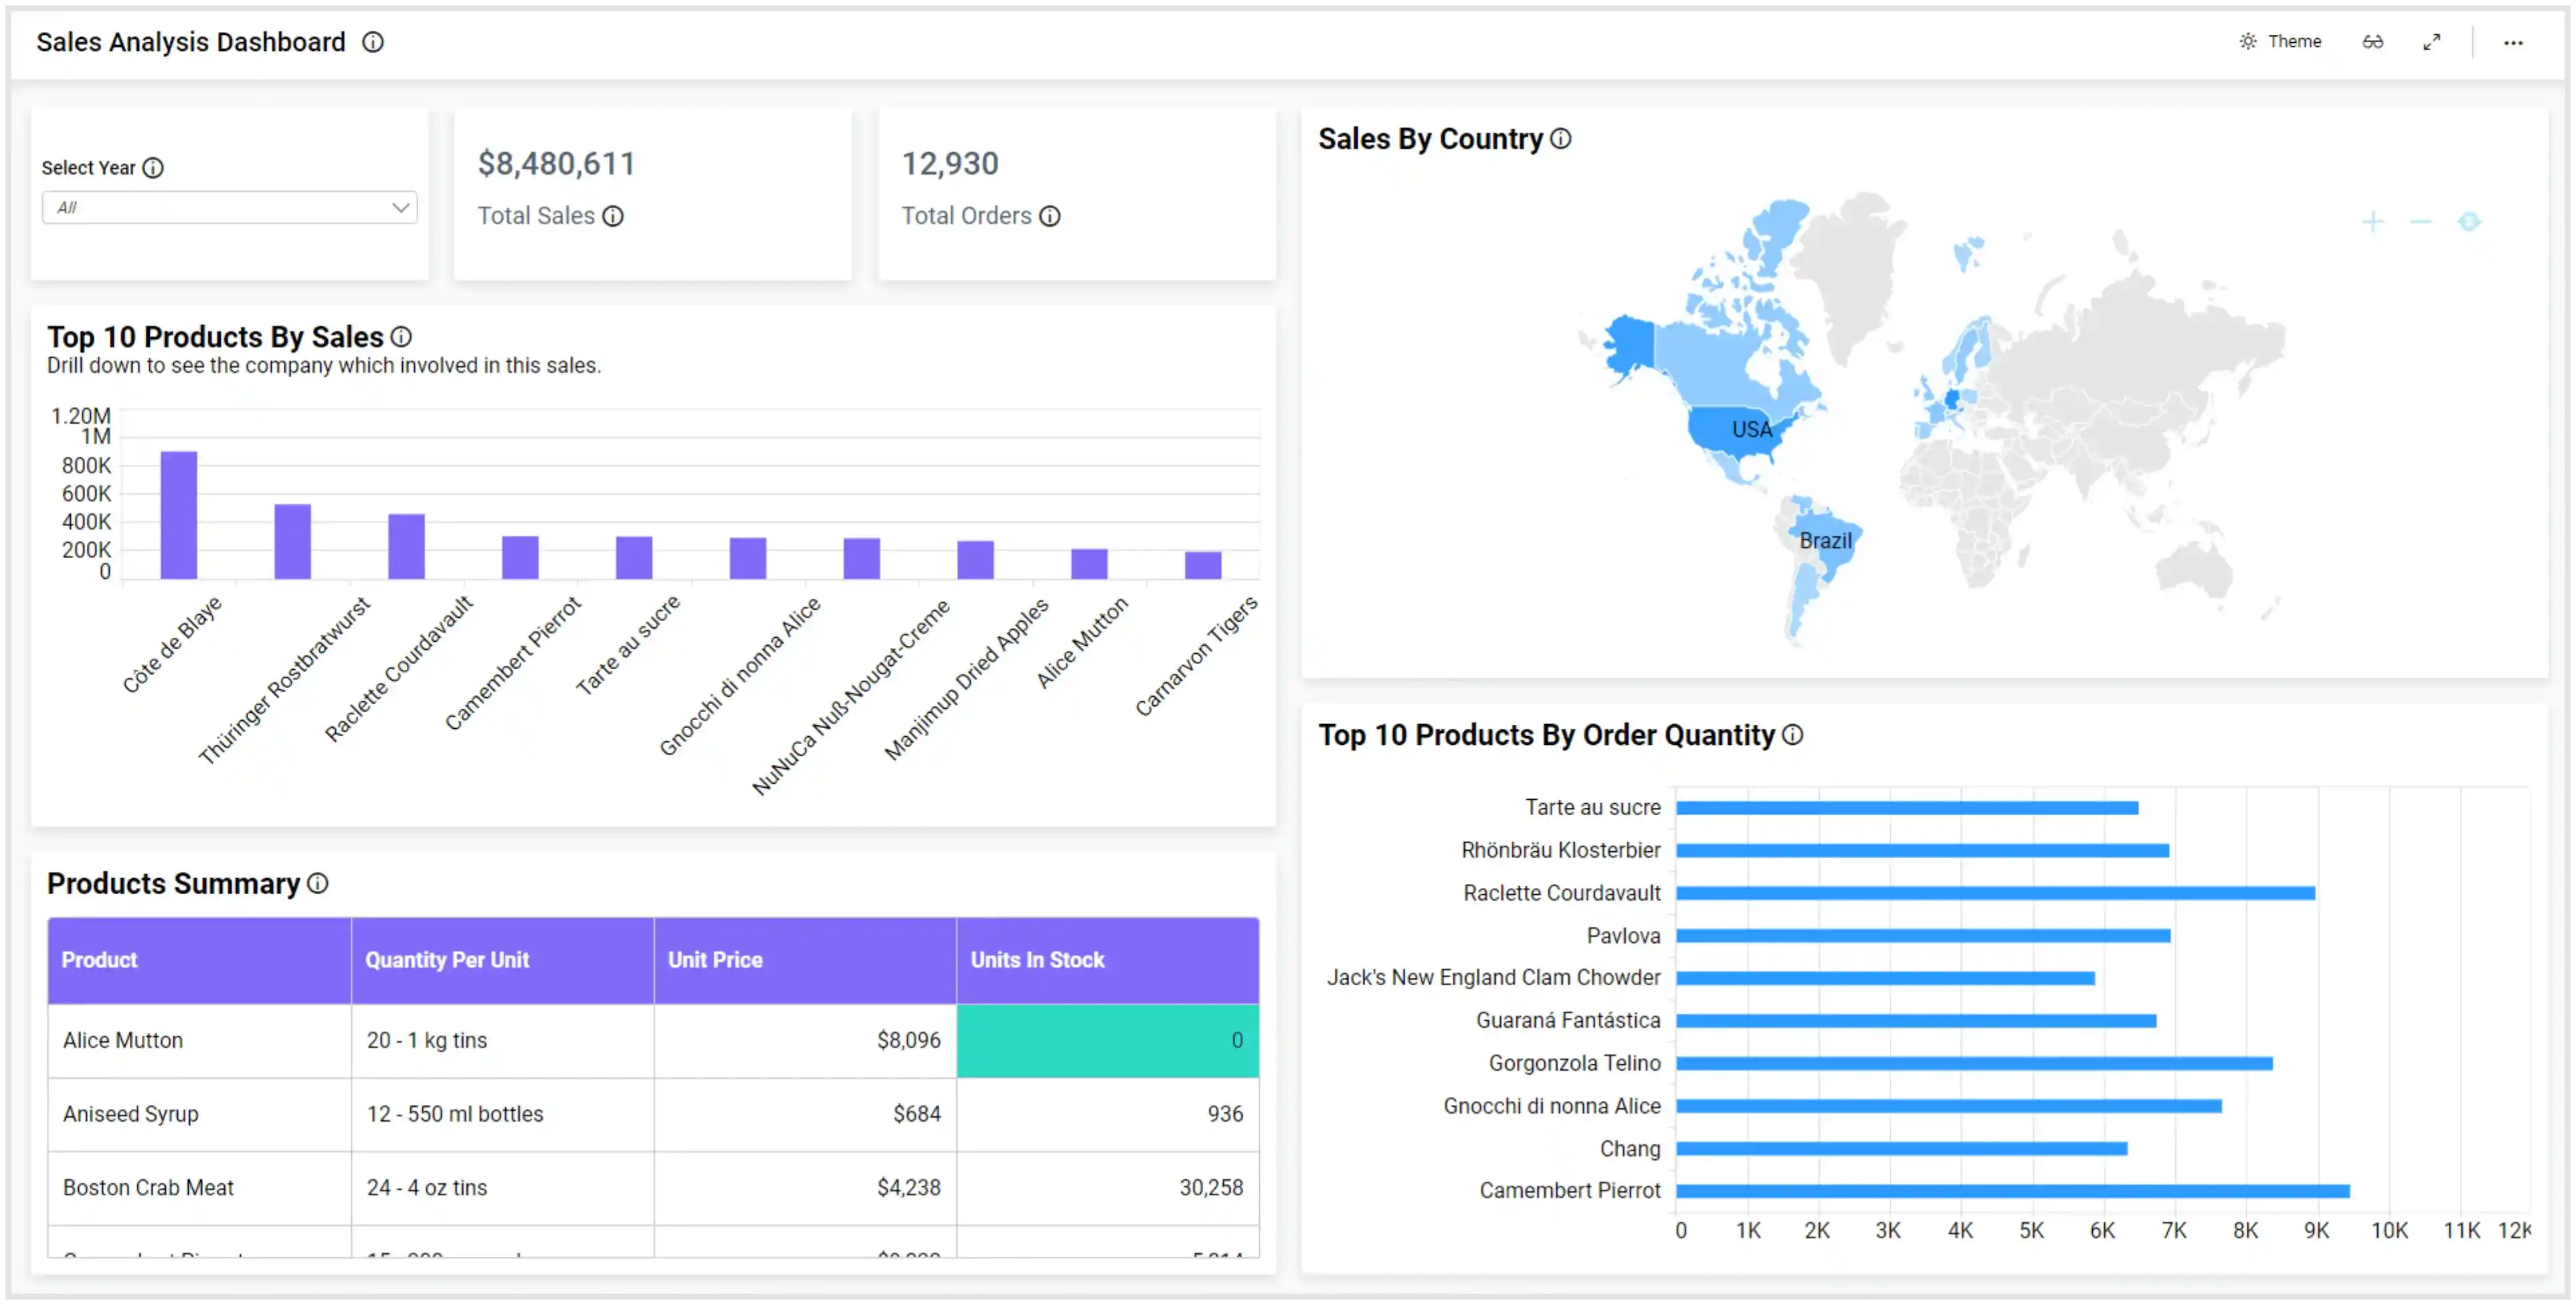
Based on the data loaded from Google Sheets, we have defined metrics and KPIs to create a sales analysis dashboard. You can check out this video on how to create a dashboard from scratch in Bold BI. After creating a sales analysis dashboard using Google Sheets data, you can visualize product sales data through the following metrics, tracking sales performance:
- Total sales
- Total orders
- Sales by country
- Top 10 products by sales
- Top 10 products by order quantity
- Product summary
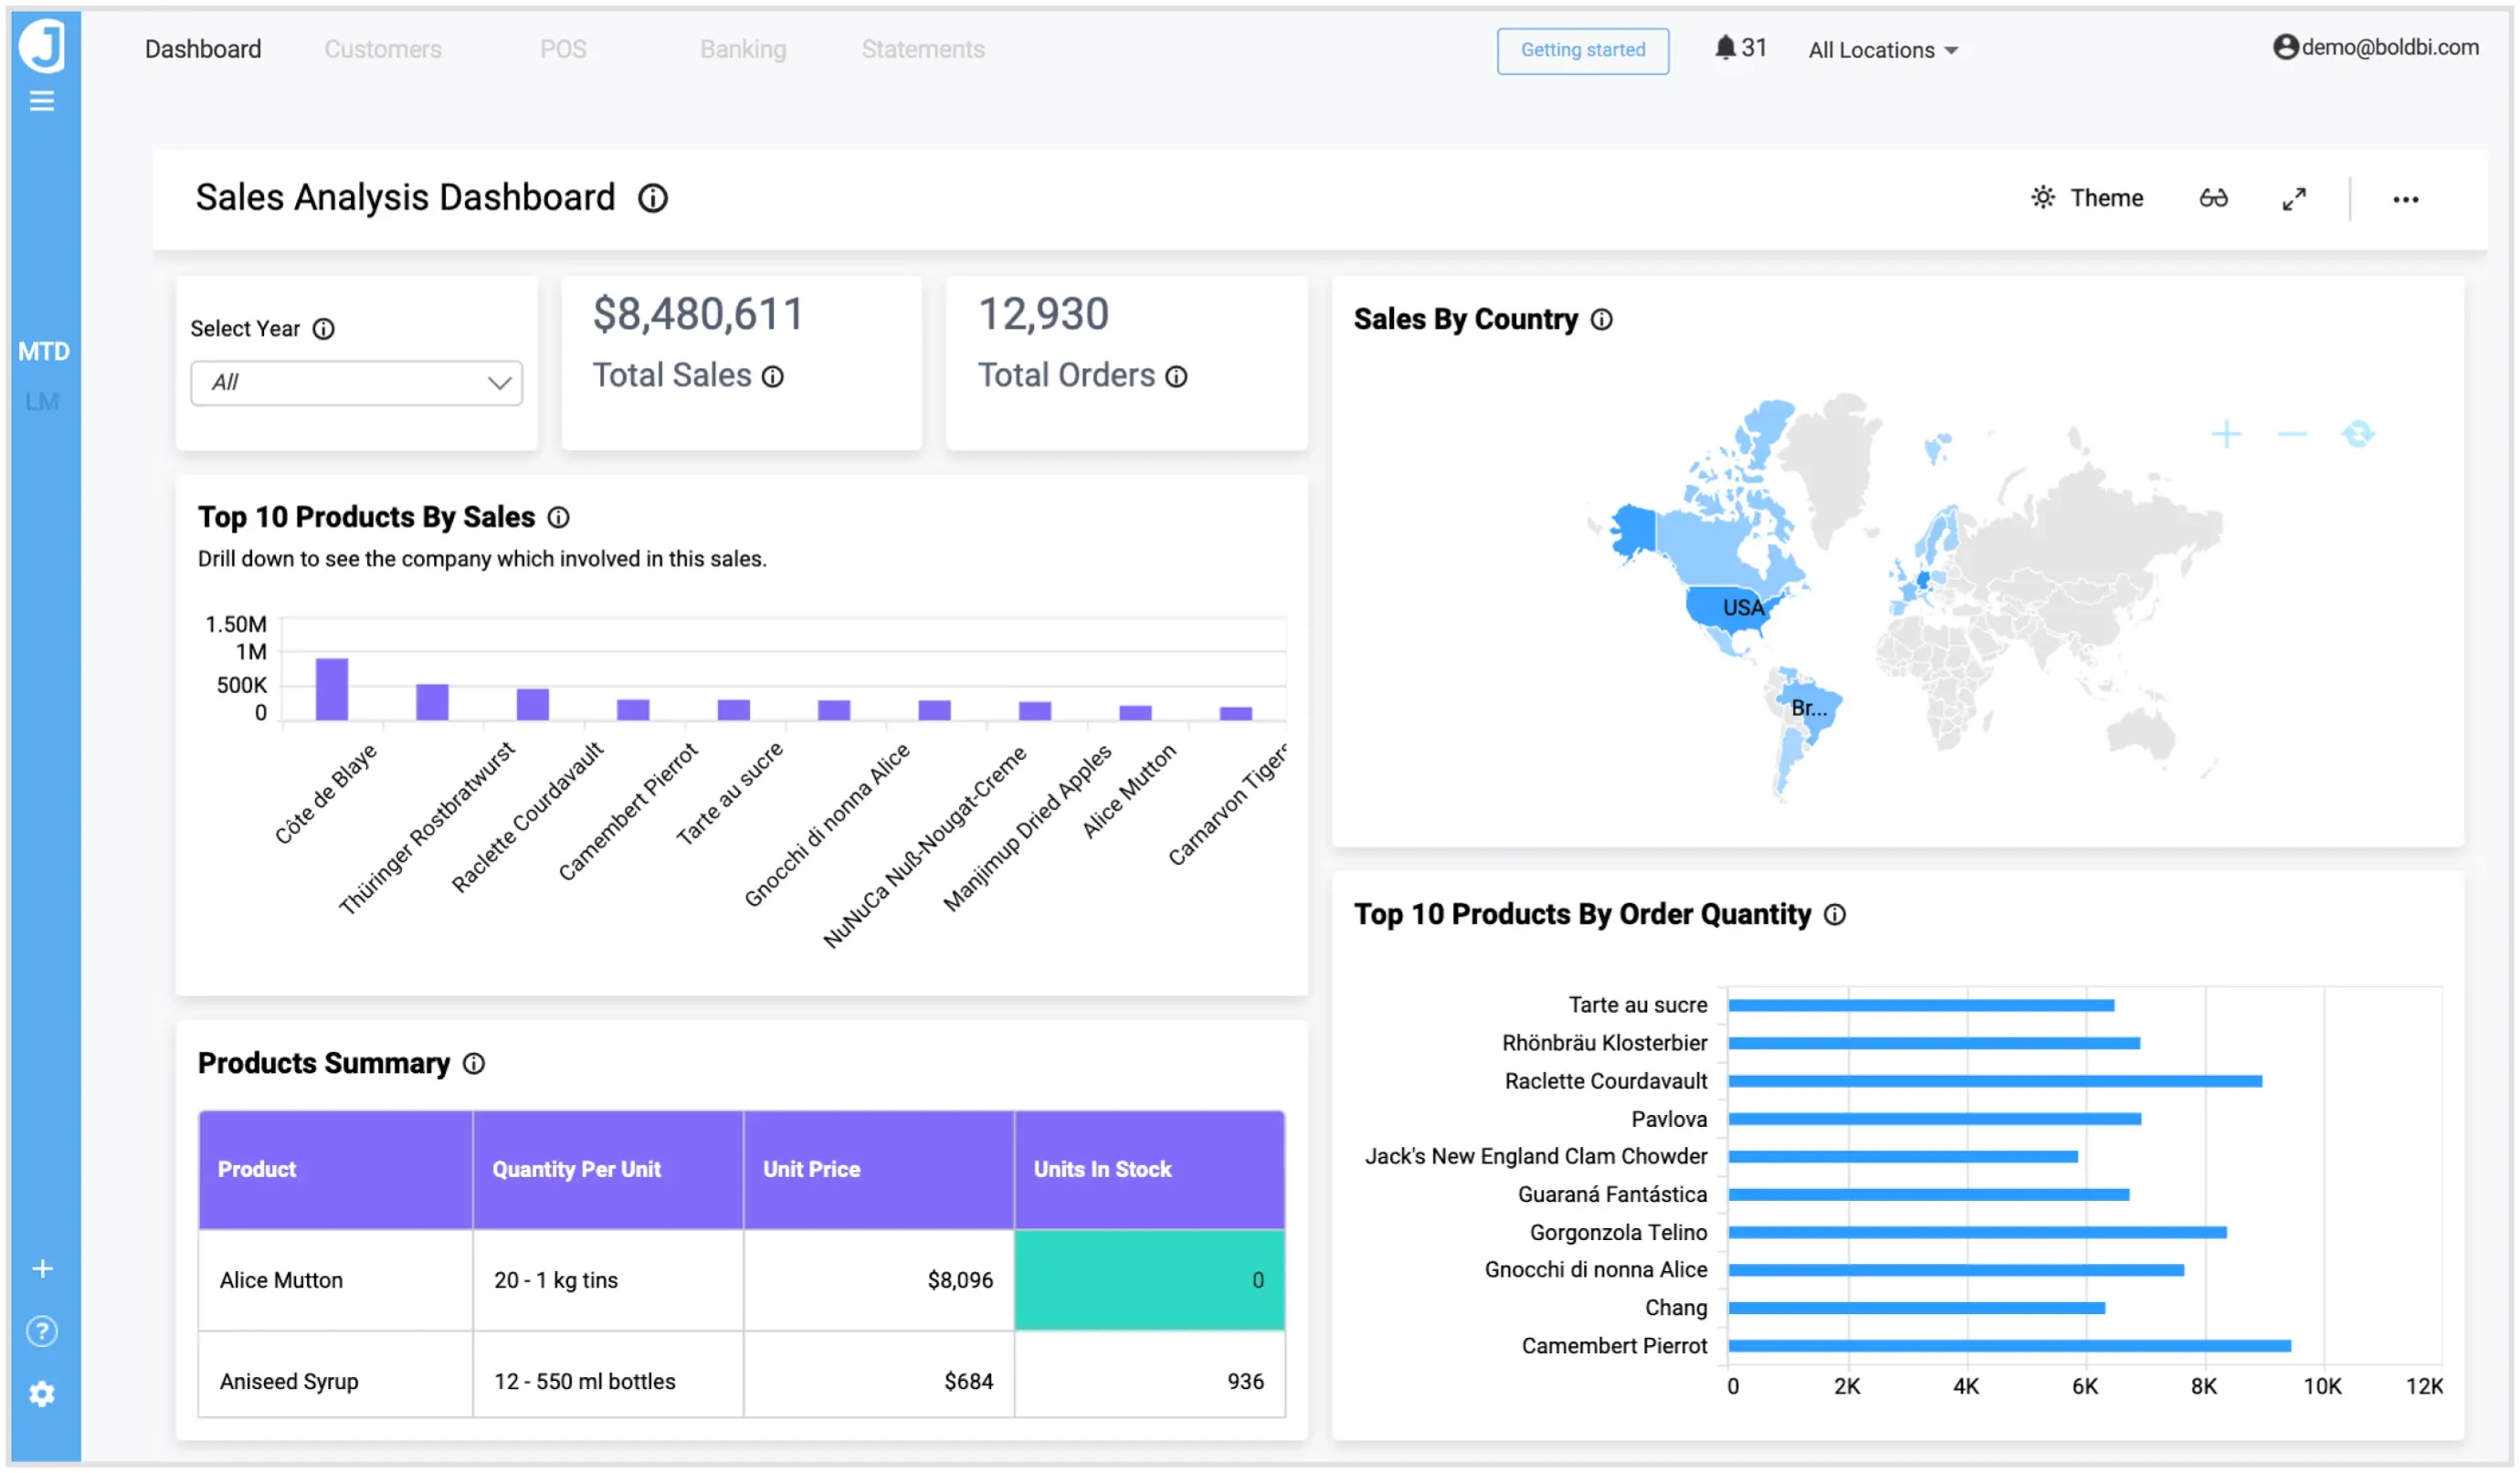
This dashboard helps sales teams analyze the sales process periodically and measure sales performance, which helps them make business decisions.
How to schedule data refreshes for a Google Sheets dashboard
You can schedule data refreshes in the dashboard to keep your data up to date. With a Google Sheets file, use the Refresh Settings option to create a schedule to move data from your cloud location to an intermediate database location.
You can add this settings refresh while connecting Google Sheets itself.
Once Refresh Settings is clicked, you can view the following configuration.
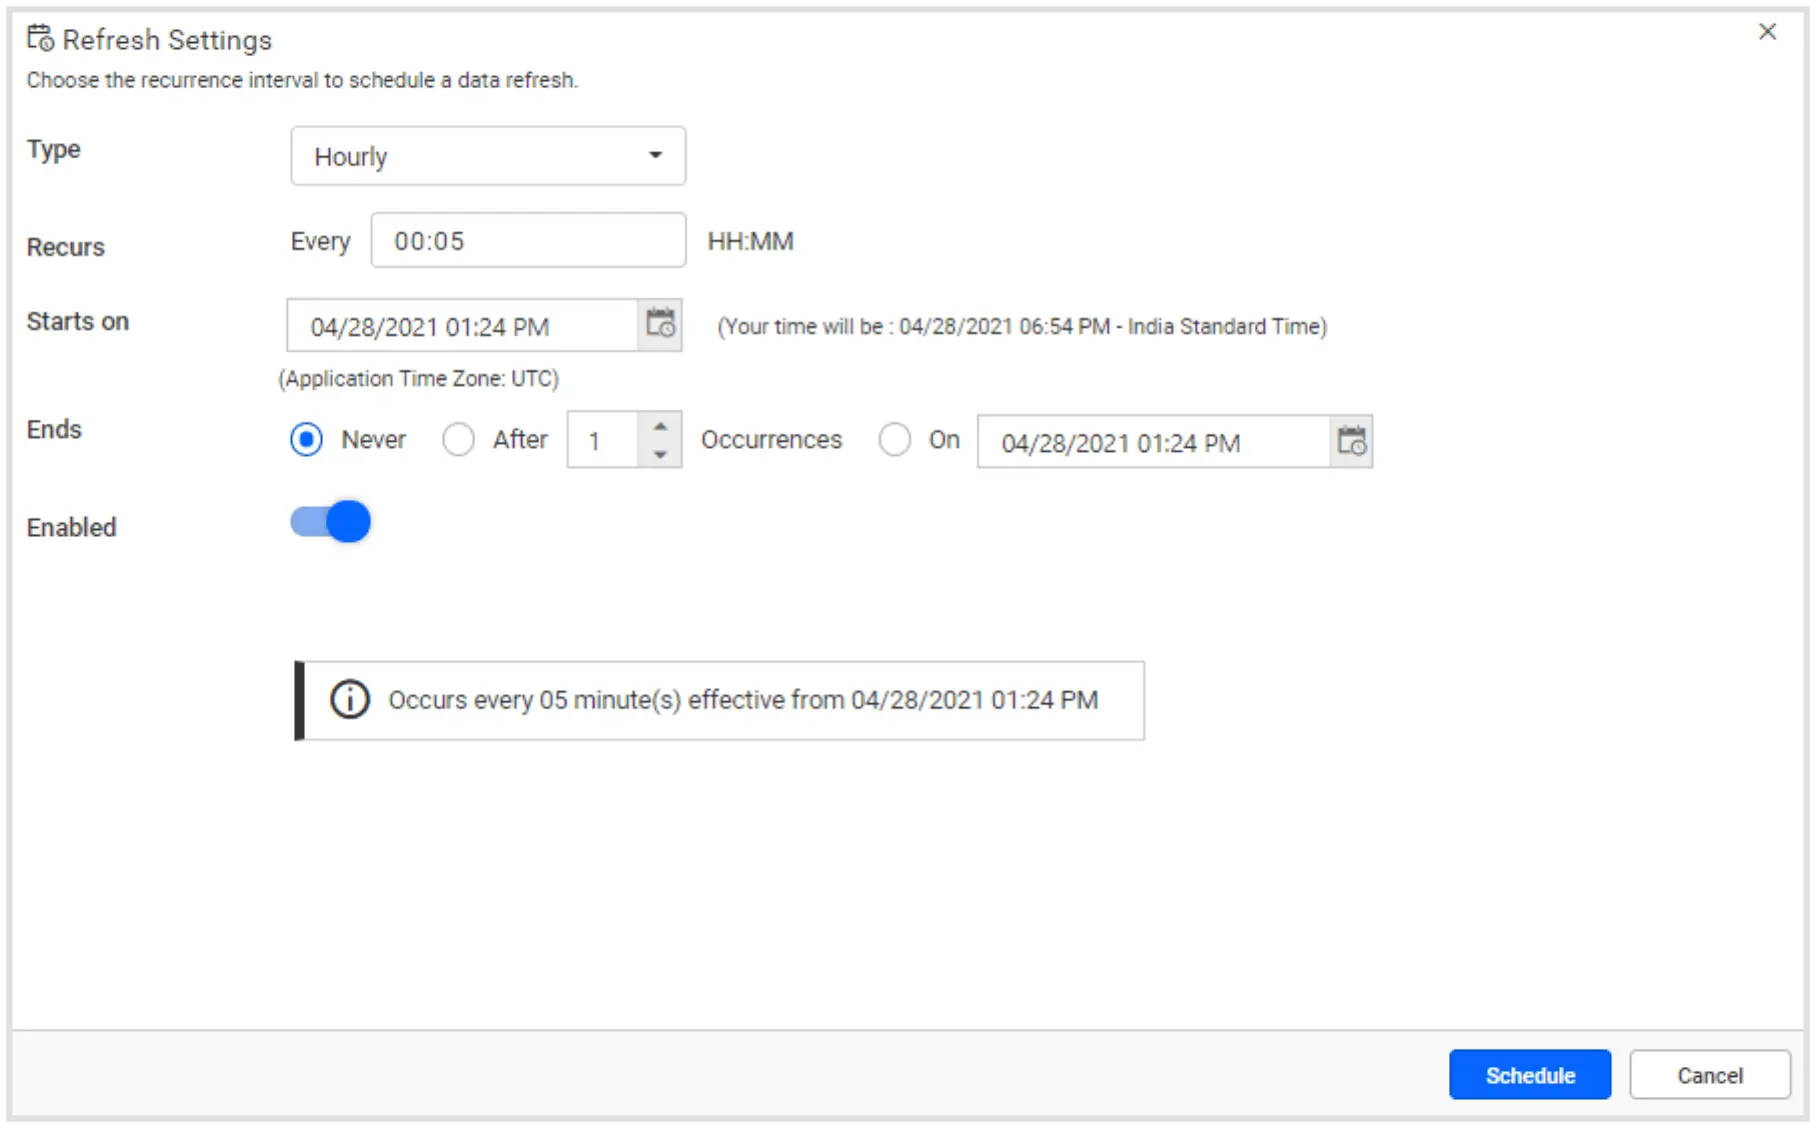
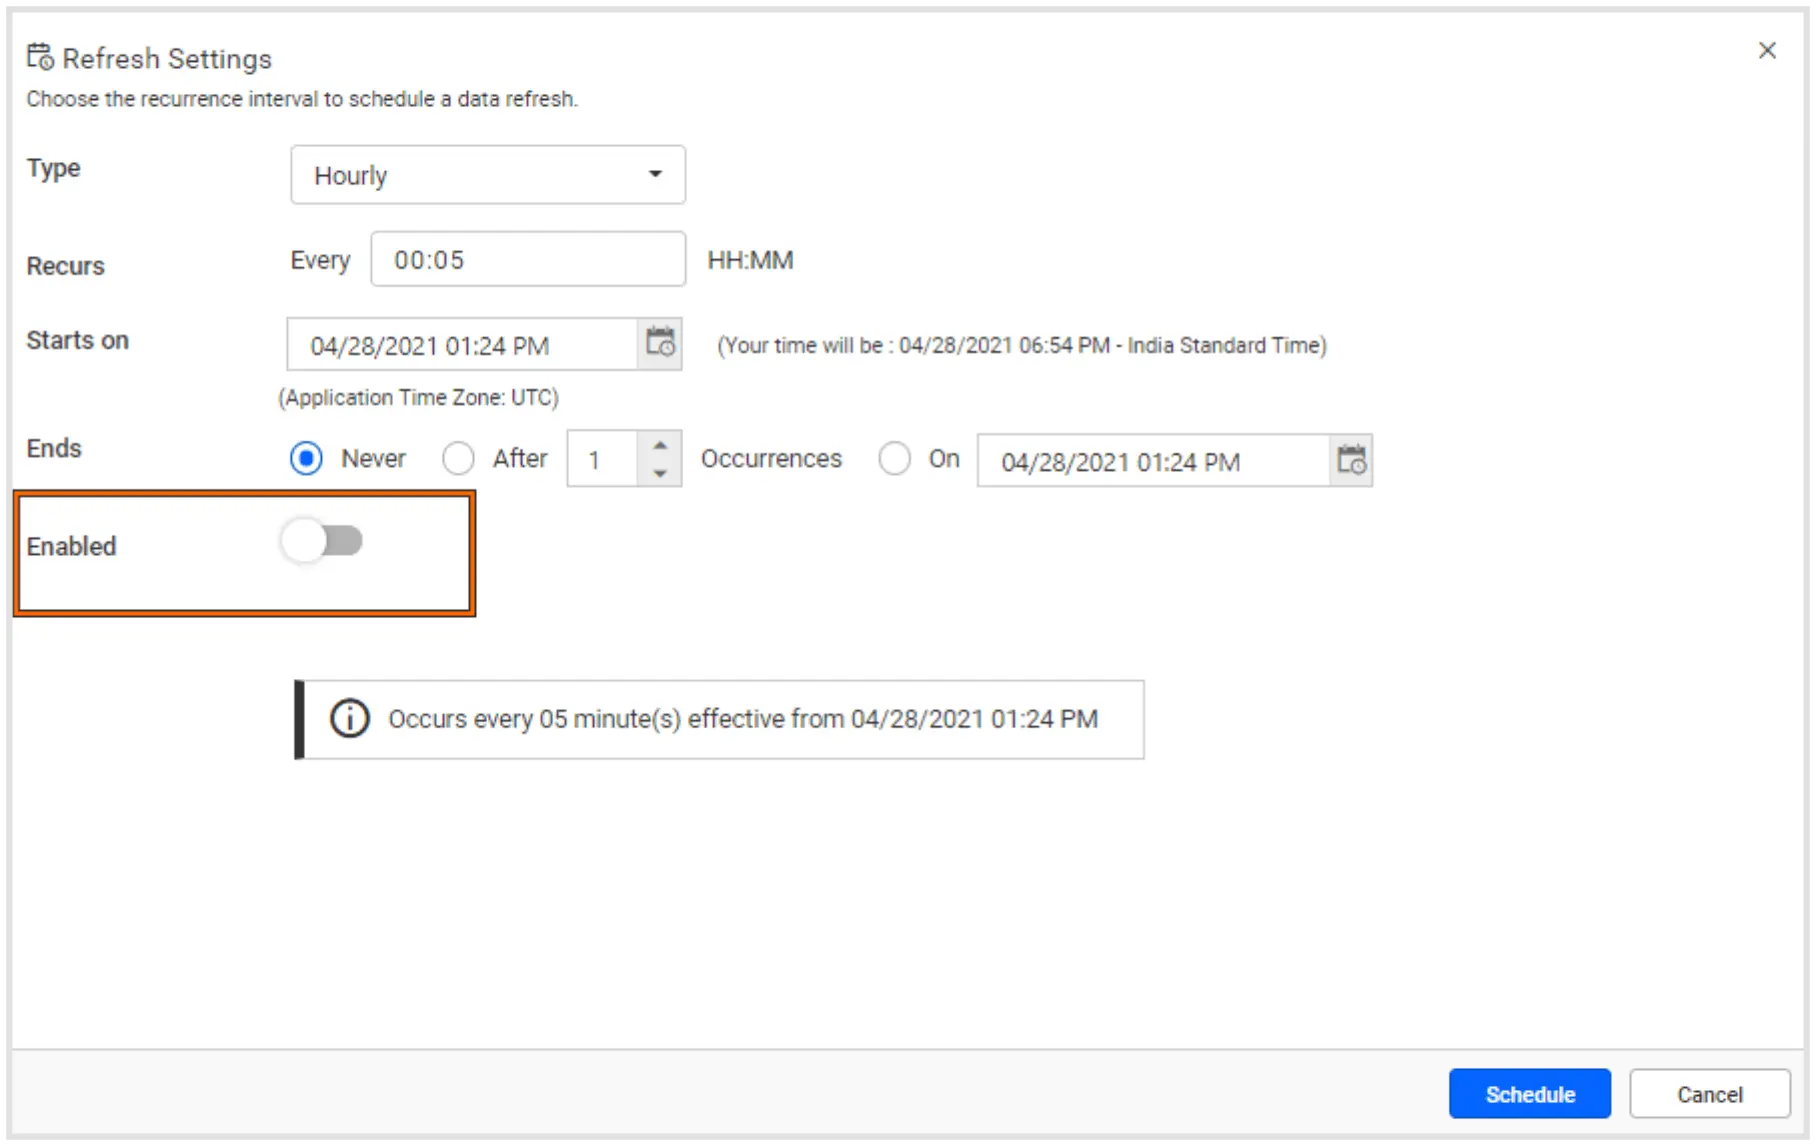
In the Refresh Setting window, you can schedule the data to refresh hourly, daily, weekly, or monthly. This will automatically trigger a call to the API configured in the data source to keep the data up to date. If you do not want to sync your new data, disable the Enabled toggle.
After the refresh is scheduled for the sales analysis dashboard, you can see the data updated in the dashboard every five minutes, as shown in the following image.
The Sales Analysis Dashboard can be viewed in this demo where it showcases additional metrics.
How to embed a Google Sheets dashboard in your application
Using Bold BI, you can quickly embed this sales analysis dashboard and avoid building an analytics or BI solution yourself, saving development time. Bold BI has various features and customizations, which you can see with examples in our sample browser.
Here, we have integrated the Sales Analysis Dashboard into an ASP.NET Core application. You can get details on how to integrate dashboards with the embedded SDK into ASP.NET MVC or ASP.NET Core applications in this blog post.
Also, you can go through the help documentation to embed your dashboards into any server-side application including for Angular, Ruby on Rails, React with ASP.NET Core, React with Go, and many more.
Conclusion
We hope this article guides you in preparing Google Sheets data, building a dashboard using it with Bold BI®, and embedding the dashboard into any web application. If you have any questions on this blog, please feel free to post them in the following comment section. Get started with Bold BI by signing up for a free 30-day trial and create more interactive business intelligence dashboards. You can also contact us by submitting your questions through the Bold BI website or, if you already have an account, you can log in to submit your support question.