


Dashboards play an important role in business processes, where they help you visualize metrics and KPIs relevant to a specific goal so you can make effective business decisions. In every dashboard, we can view, analyze, calculate, and modify our data to identify the targets of our business. Data changes day by day, so we need to update our dashboards periodically, but manual corrections are unfeasible. To tackle this process, dashboard parameters can be used to change values in a dashboard dynamically with simple configuration.
In this blog, let’s see how dashboard parameters help in rendering dashboards with filtered data, i.e., data pulled based on parameter values passed during runtime. Blog contents:
- What are dashboard parameters?
- Uses of dashboard parameters
- How to use:
- How to change a dashboard parameter value dynamically in view mode
What are dashboard parameters?
A dashboard parameter is a global placeholder value; a number, string, or date that can be assigned to query parameters used in a custom query, calculated fields, stored procedures, and user-based filters. This brings only the needed data to the dashboard during initial load and runtime execution. Dashboard parameters can be configured simply by adding a constant value or importing a list of dynamic values from the data source.
Uses of dashboard parameter
- Dashboard parameters help you avoid adding new values each time manually as parameter values, thereby saving you time when handling large data sets.
- Dashboard parameters assure secure data access by bringing in only the user-specific data when passed in a related field value as the parameter value.
Let’s see how to use dashboard parameters in web APIs, calculated fields, stored procedures, custom queries, and user-based filters.
How to use dashboard parameters in web APIs
Let’s consider an Asana project overview dashboard as an example. It helps project leads and managers track the work status of projects. They can monitor details related to total resources, overall task completion, incomplete tasks, overdue tasks, estimated and actual hours by project, and task summaries.
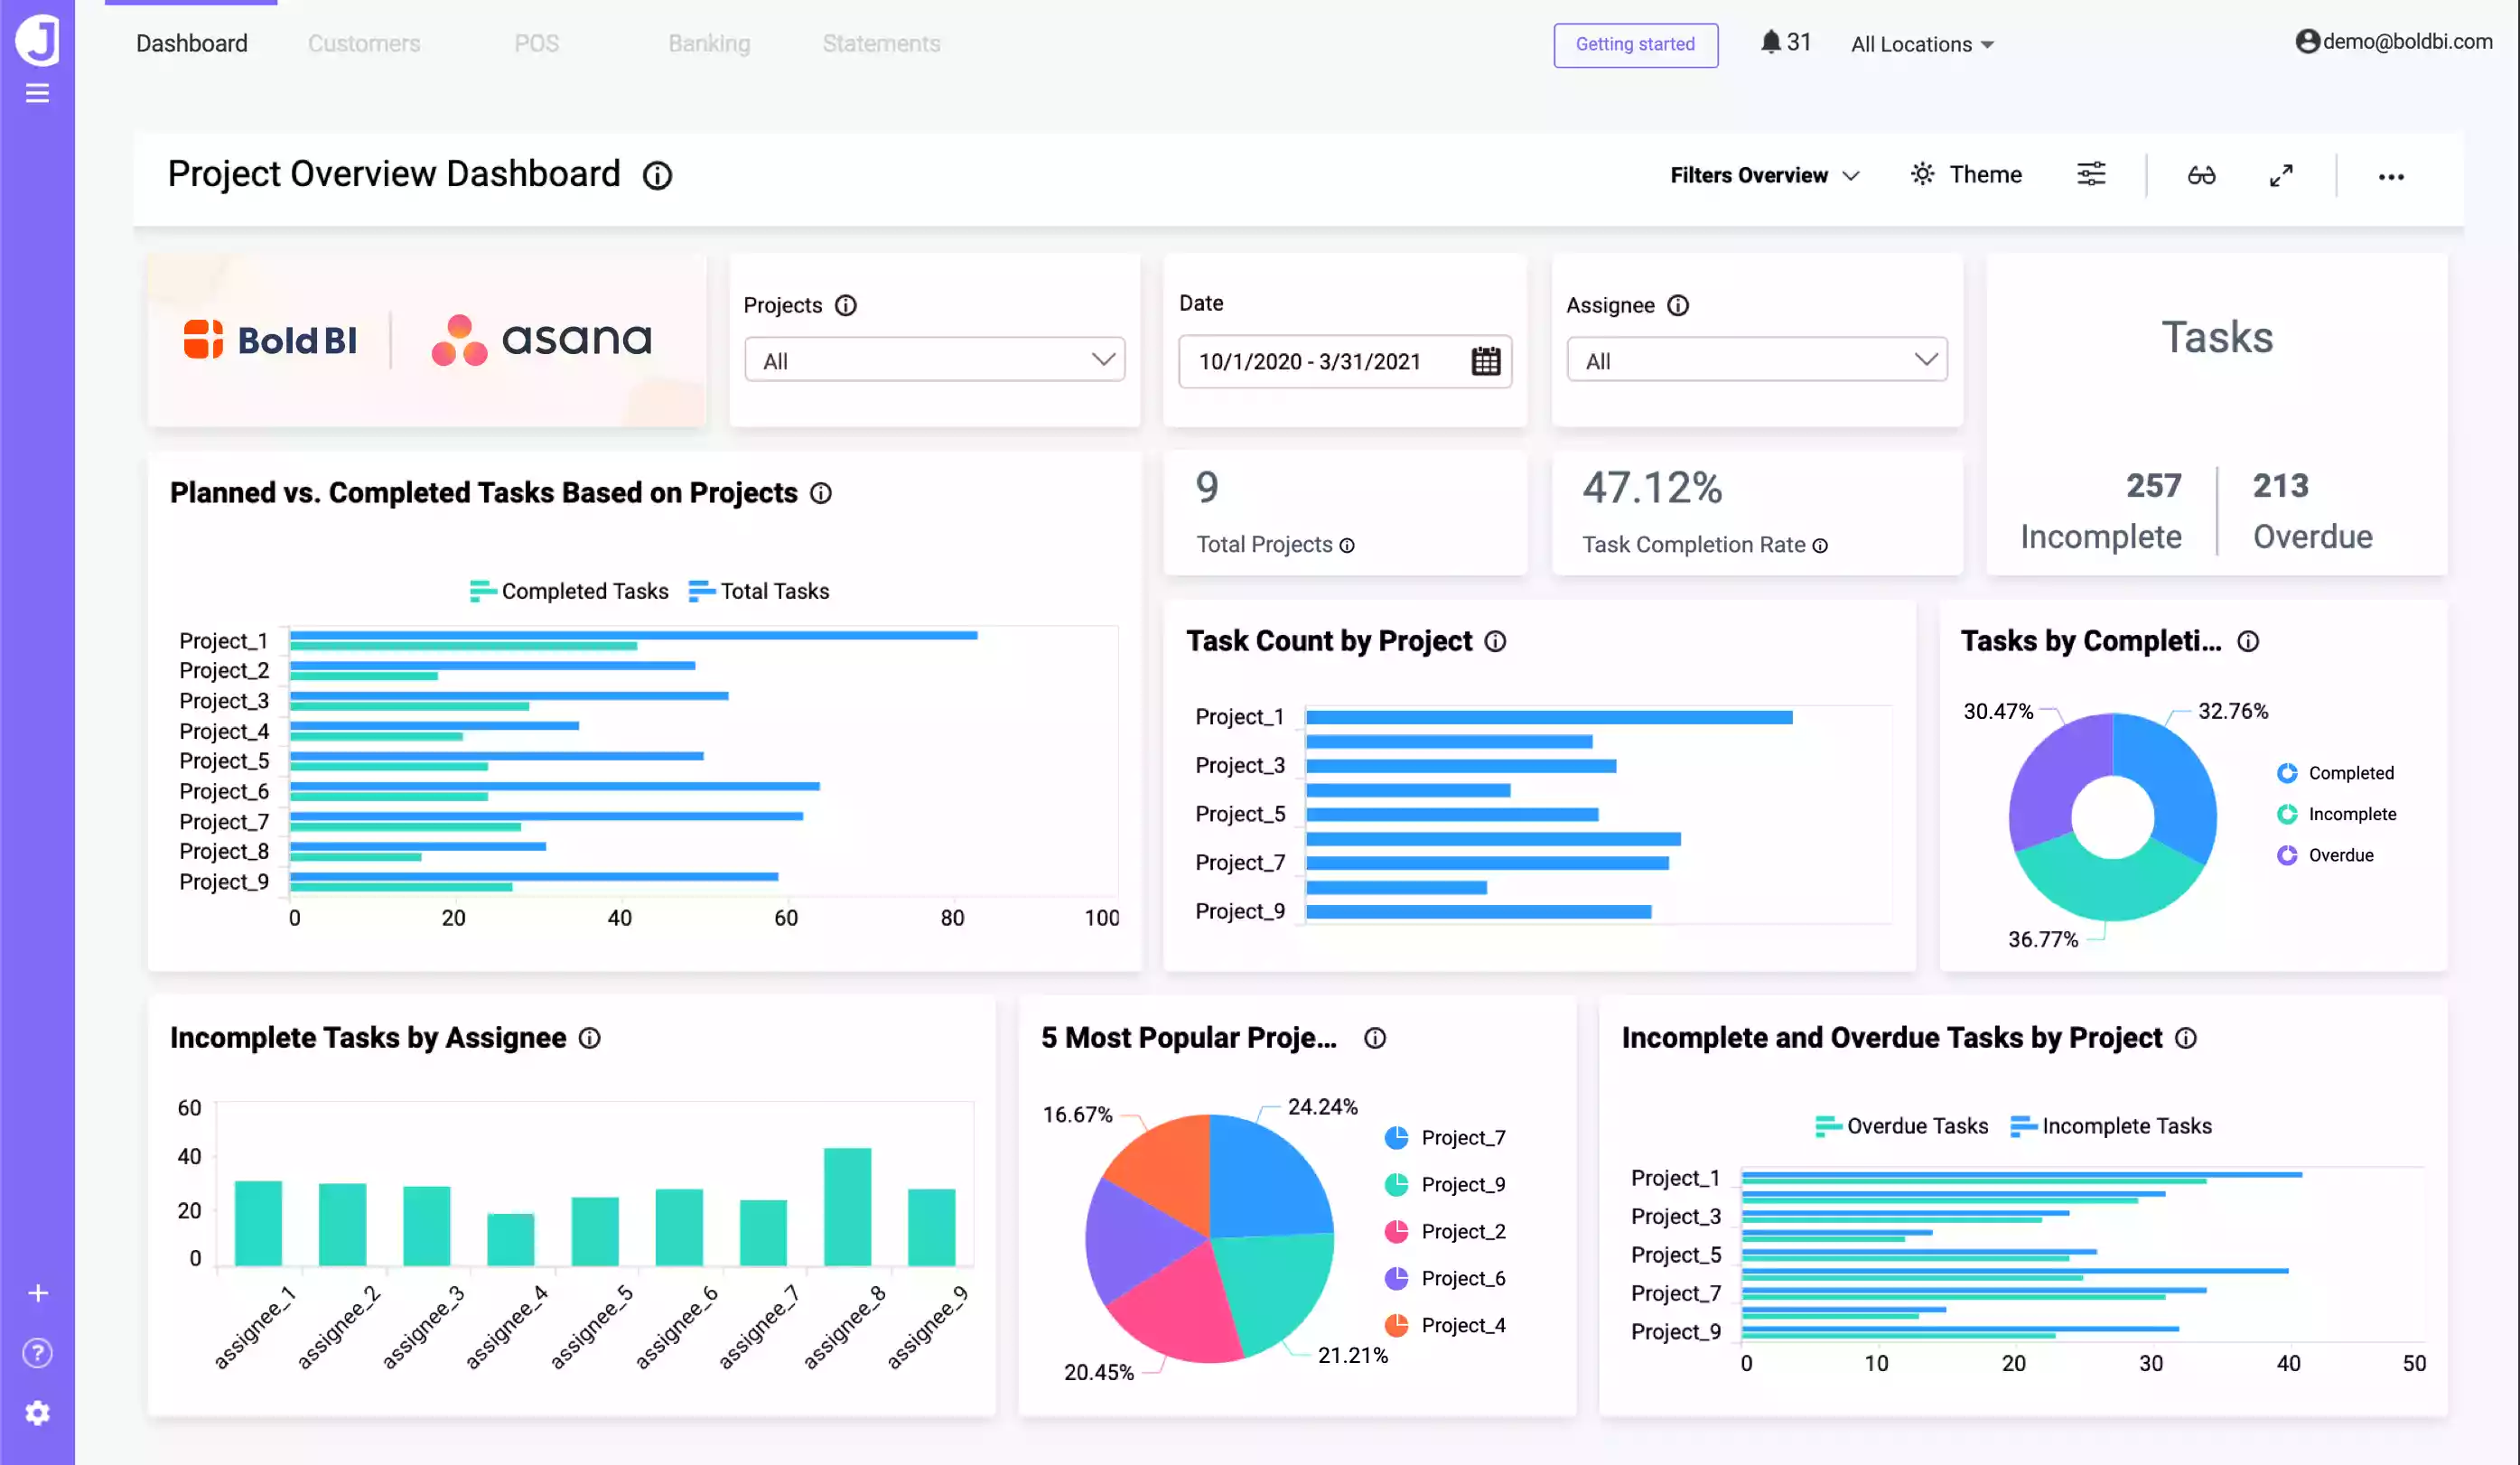
In Asana, you can fetch all task records for a specific project through a web API. You can fetch task records for all projects by passing the dashboard parameter in API endpoints.
To achieve this, you need to configure the dashboard parameter in the project data source and use it in the task URL end point while fetching task records.
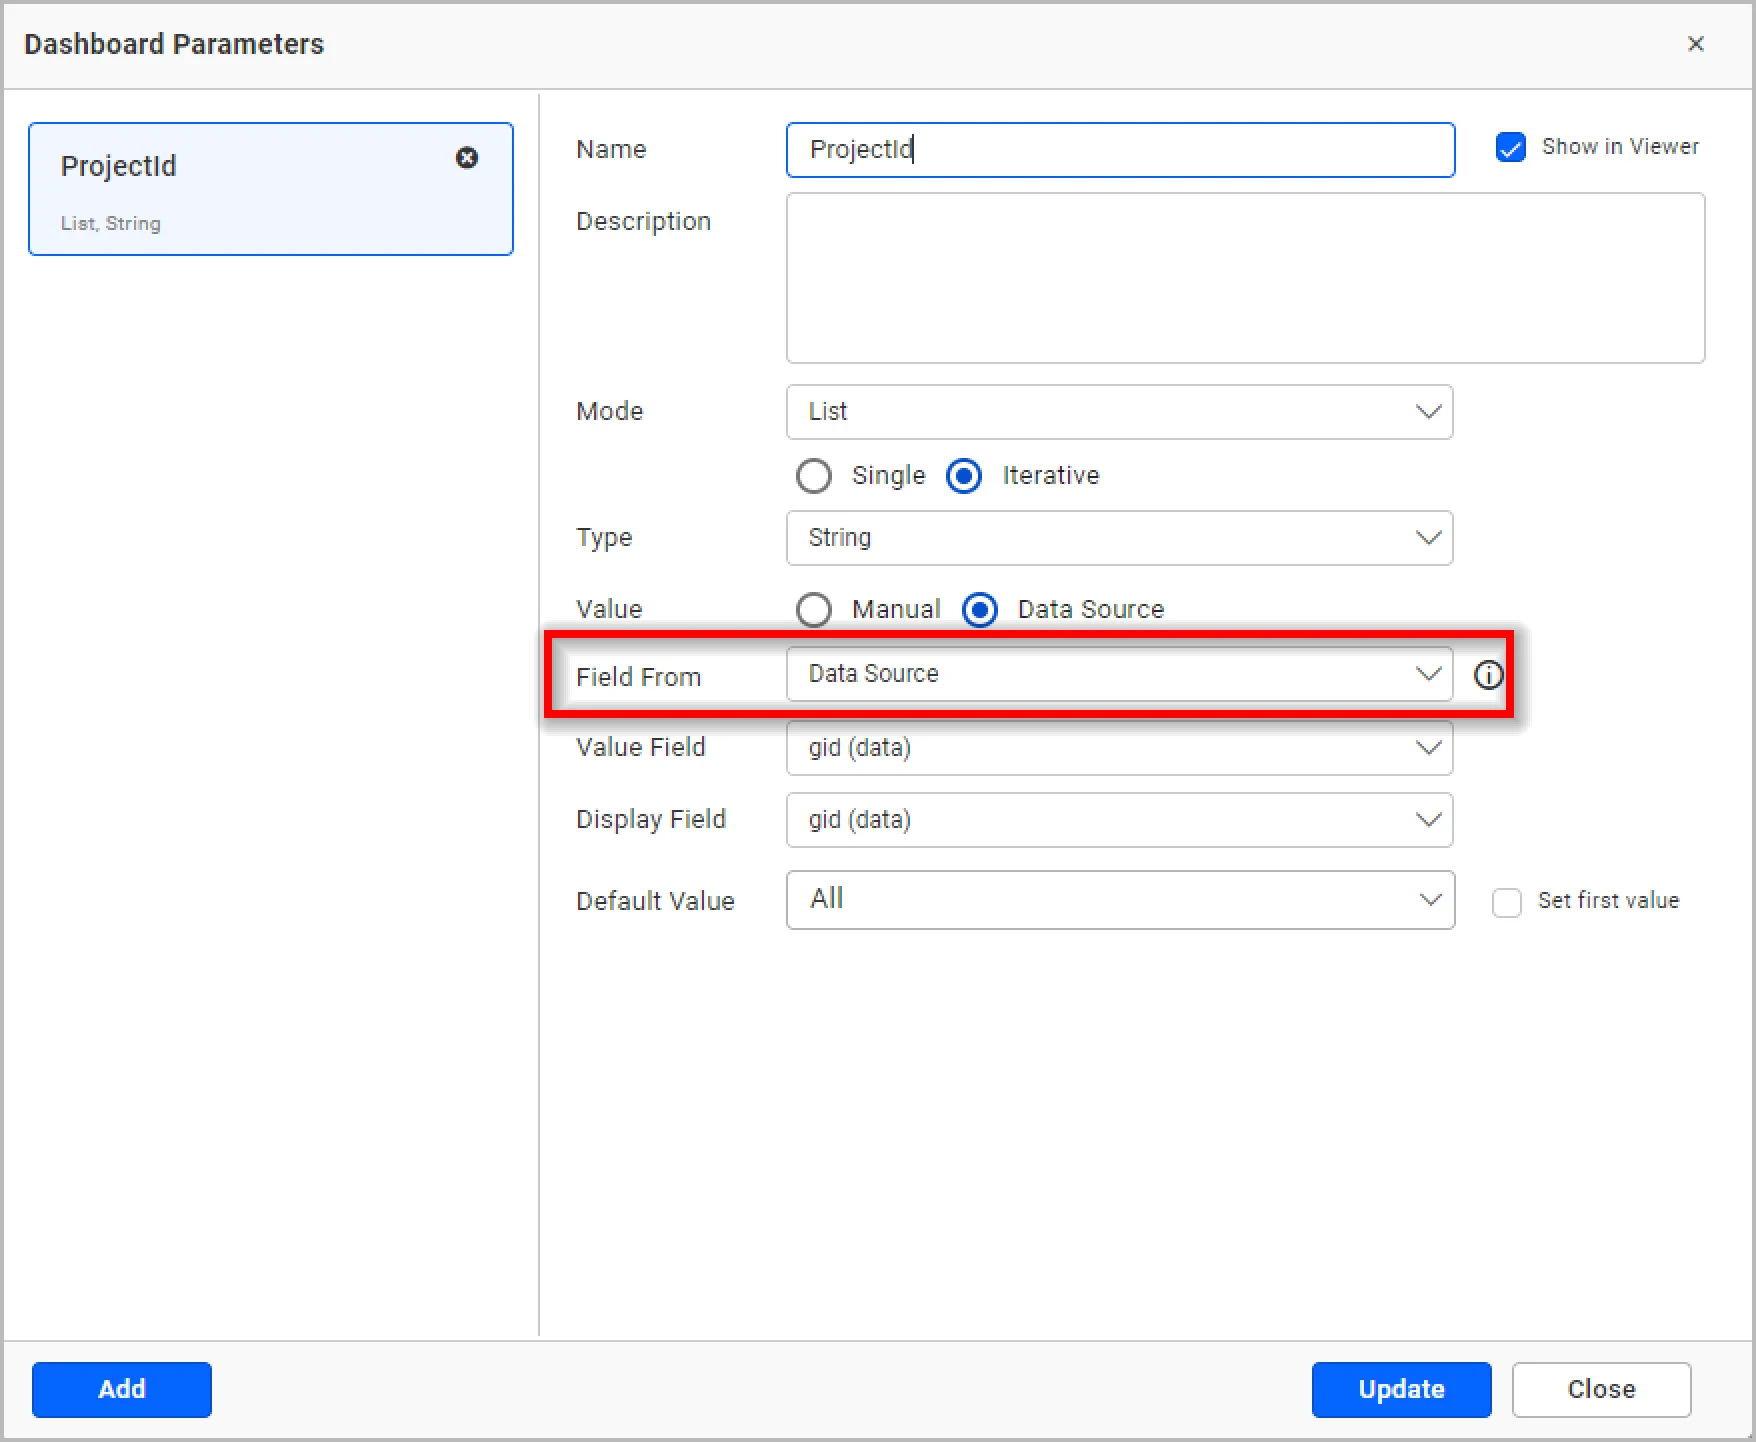
Configure the project ID list manually or from data source using list mode in the dashboard parameter window. Choose Iterative as the parameter mode. It will loop the values in parameters and generate an API for each parameter. Here I have added gid(data) as the field from data source in the dashboard parameter window as shown in the following screenshots.
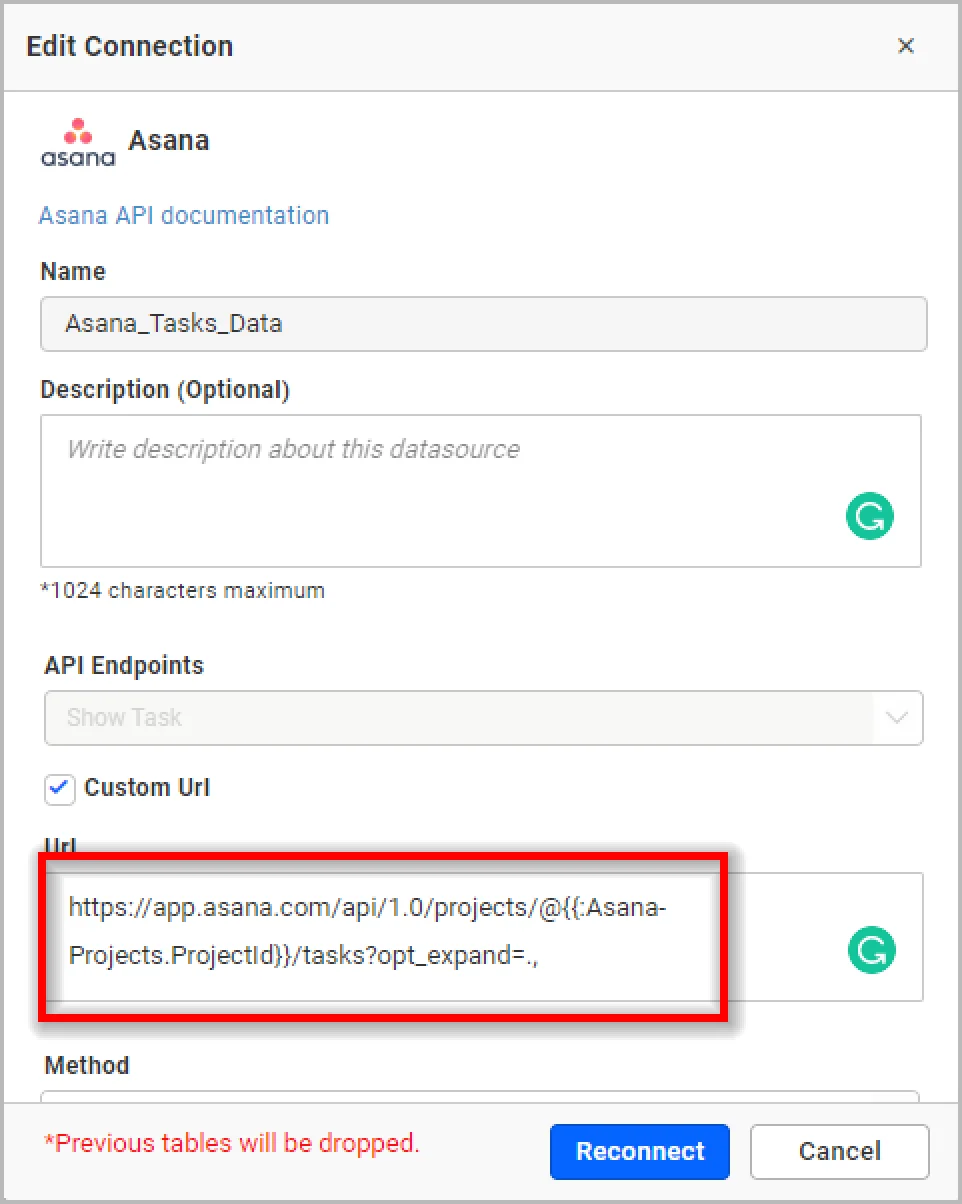
Then use the created dashboard parameter in the Task data source.
https://app.asana.com/api/1.0/projects/@{{:Asana-Projects.ProjectId}}/tasks?opt_expand=.,
You can view the example of the Asana dashboard.
Note: In parameter mode Single, it will consider only the first value from the list of values to generate the endpoint URL.
Let’s see another example of using a dashboard parameter in a web API.
The following Pull Request Analysis Dashboard shows GitHub metrics related to pull requests. It is helpful for analyzing open pull requests in all repositories from different angles.
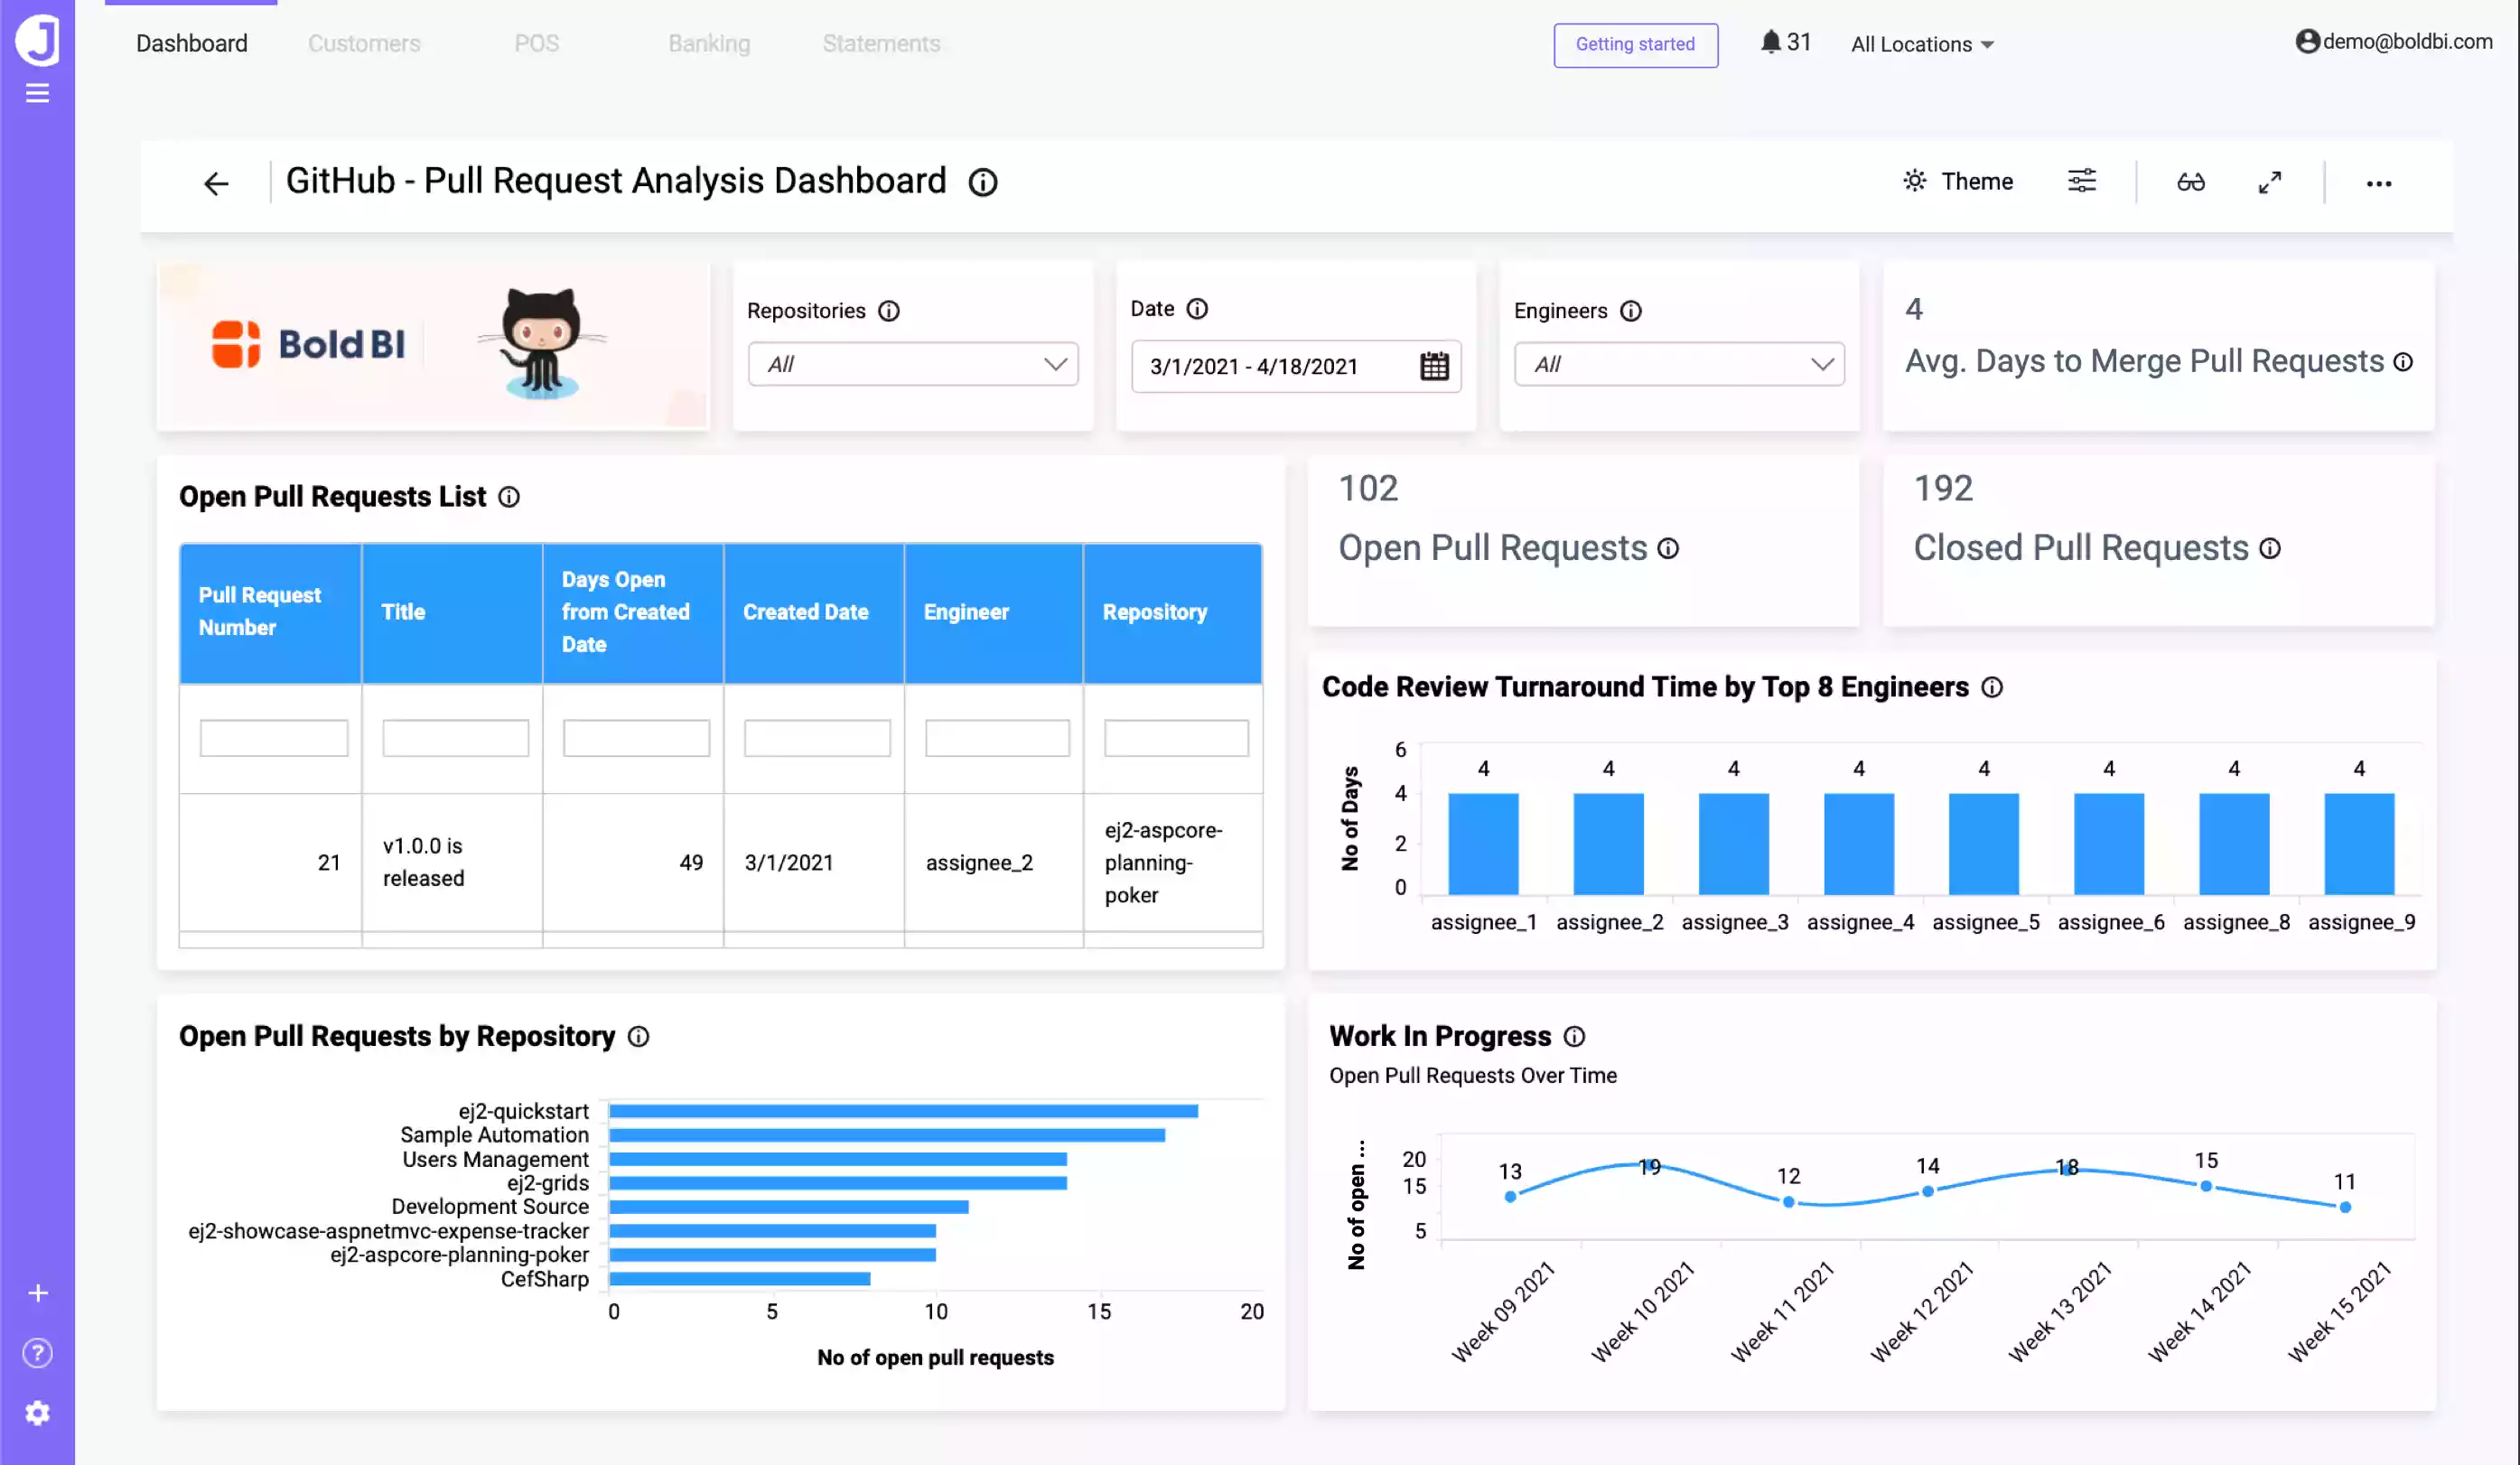
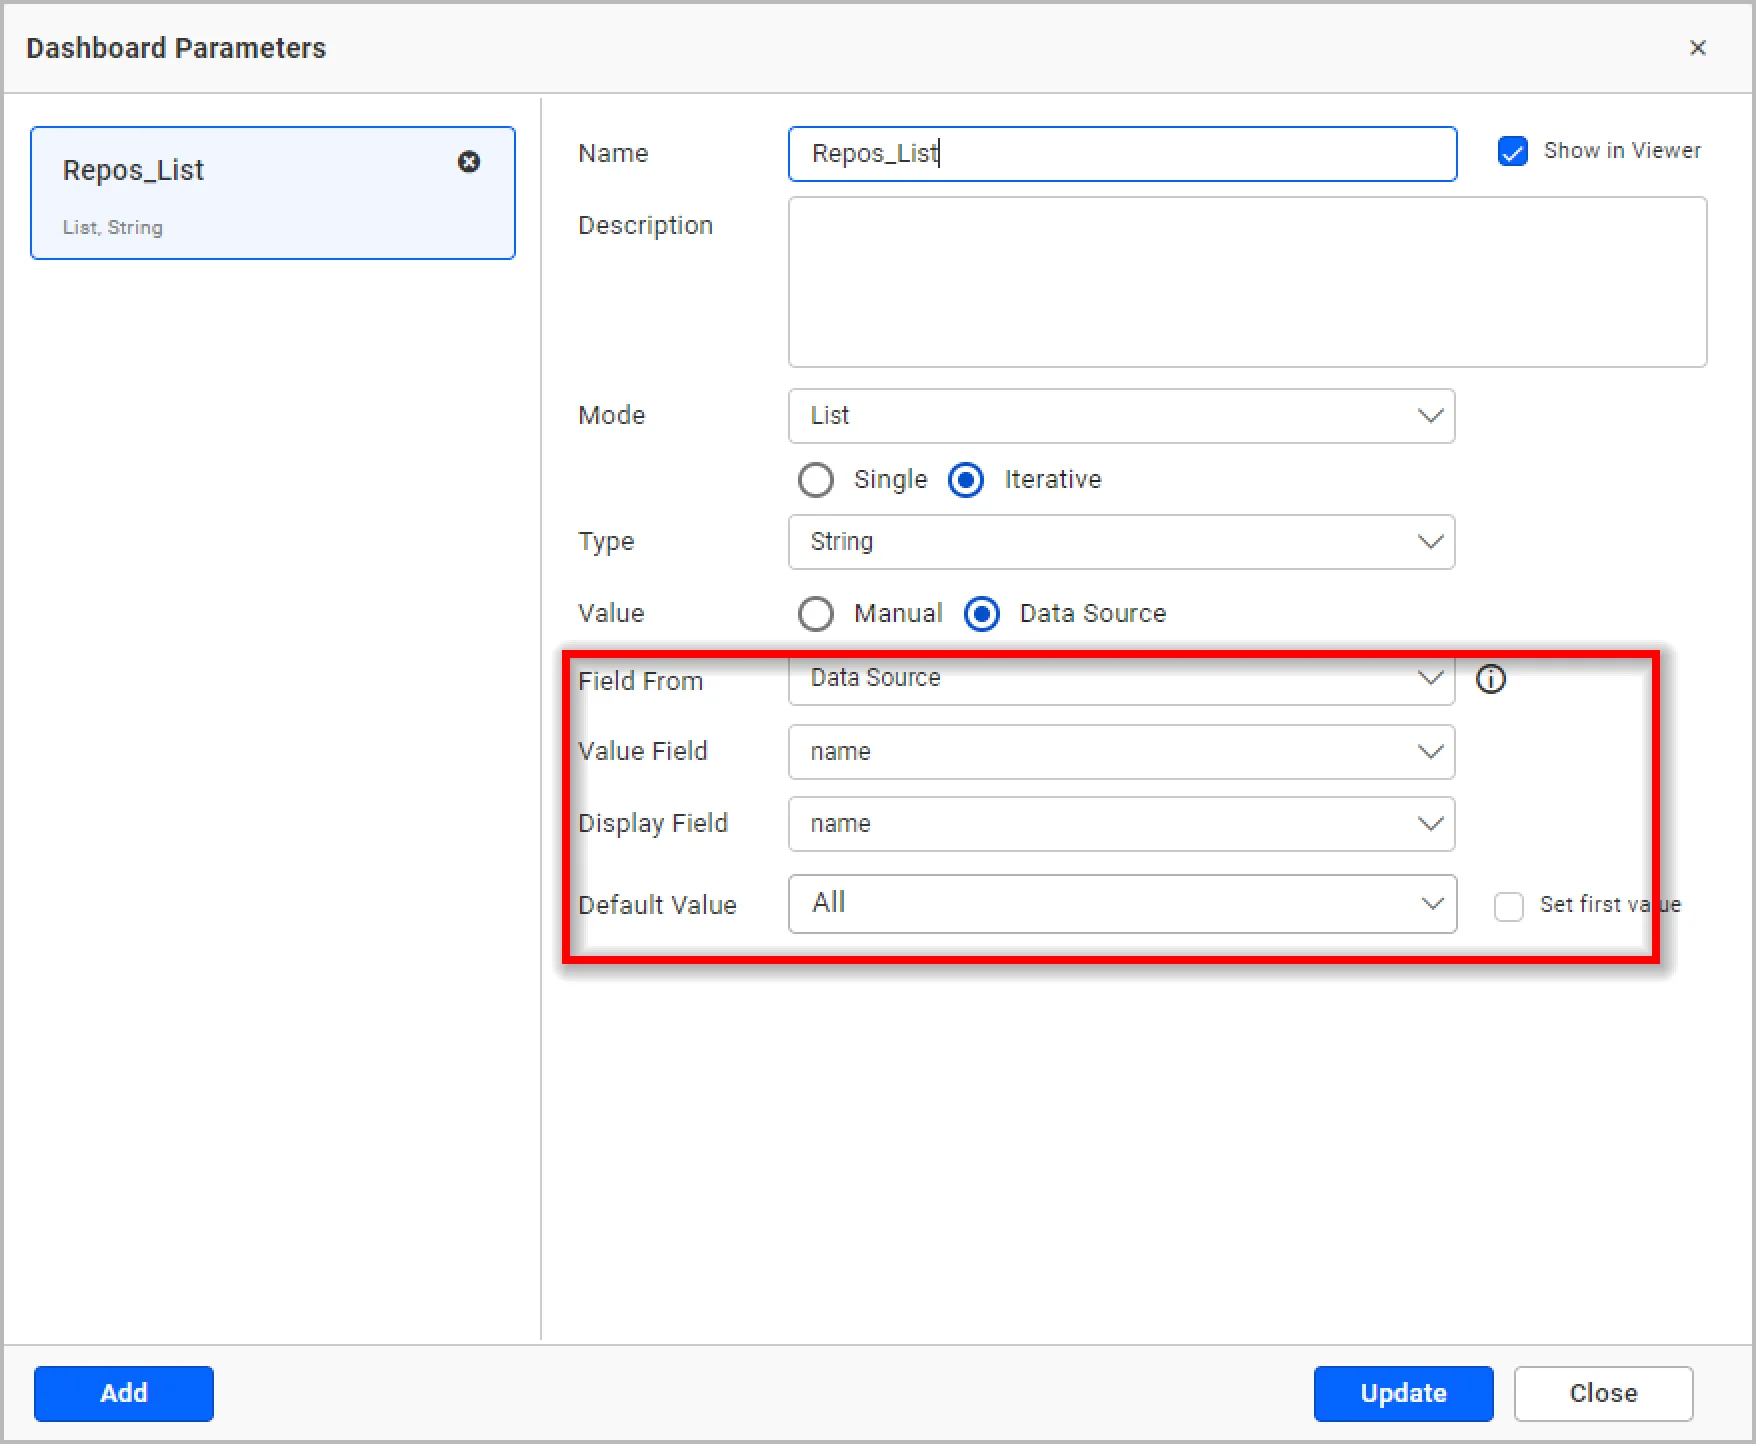
In the previous dashboard, the repository name is added in the dashboard parameter with list mode. Also, the dashboard parameter is passed in the API to fetch the pull request records from all repositories. Here I have added field from data source as the name in the dashboard parameter window, as shown in the following screenshots.
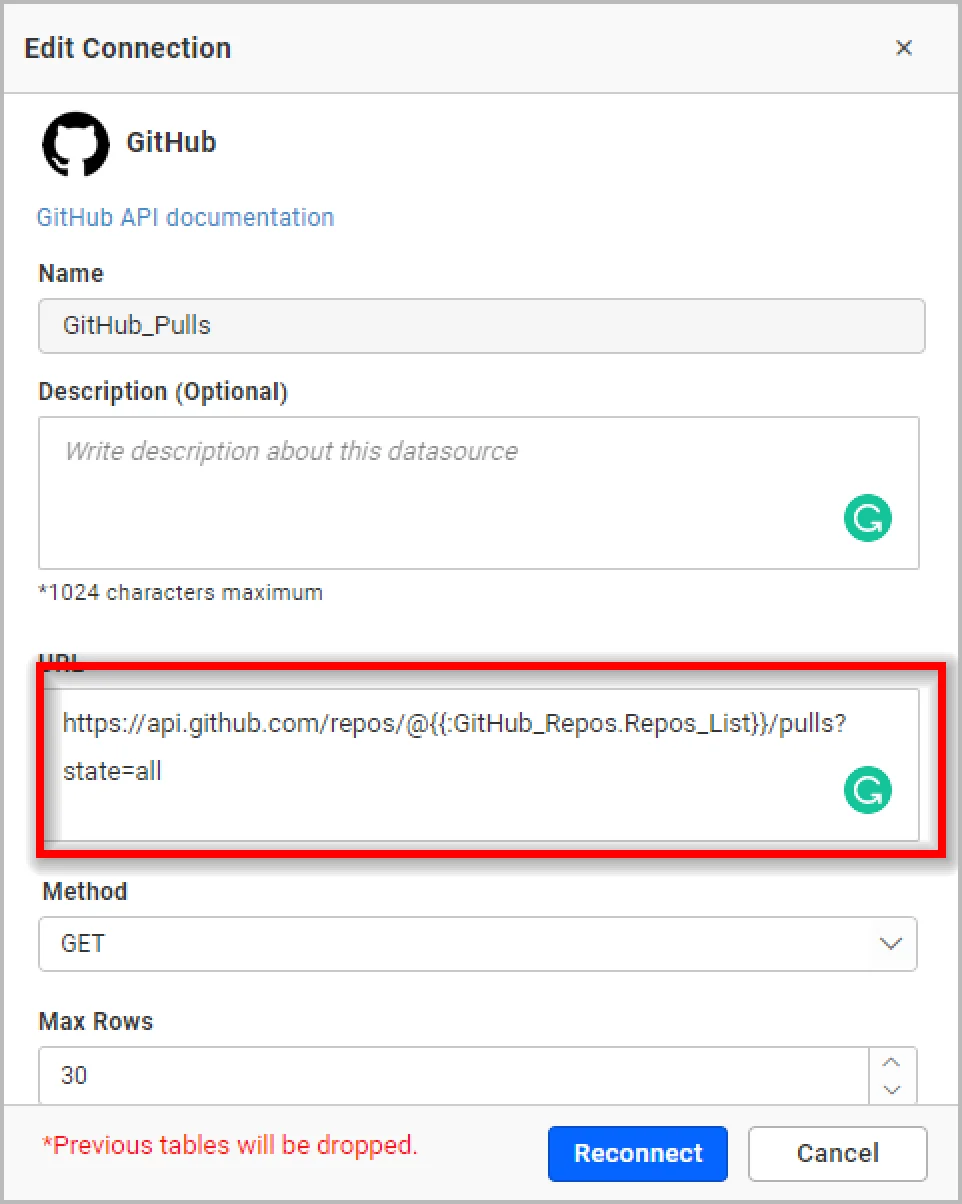
Then use the created dashboard parameter in the Pull Request data source.
https://api.github.com/repos/@{{:GitHub_Repos.Repos_List}}/pulls?state=all
You can see how to handle default parameters in a web API in this documentation link.
Now let’s see how to use dashboard parameters in the expression editor for creating calculated fields.
How to use dashboard parameters in calculated fields
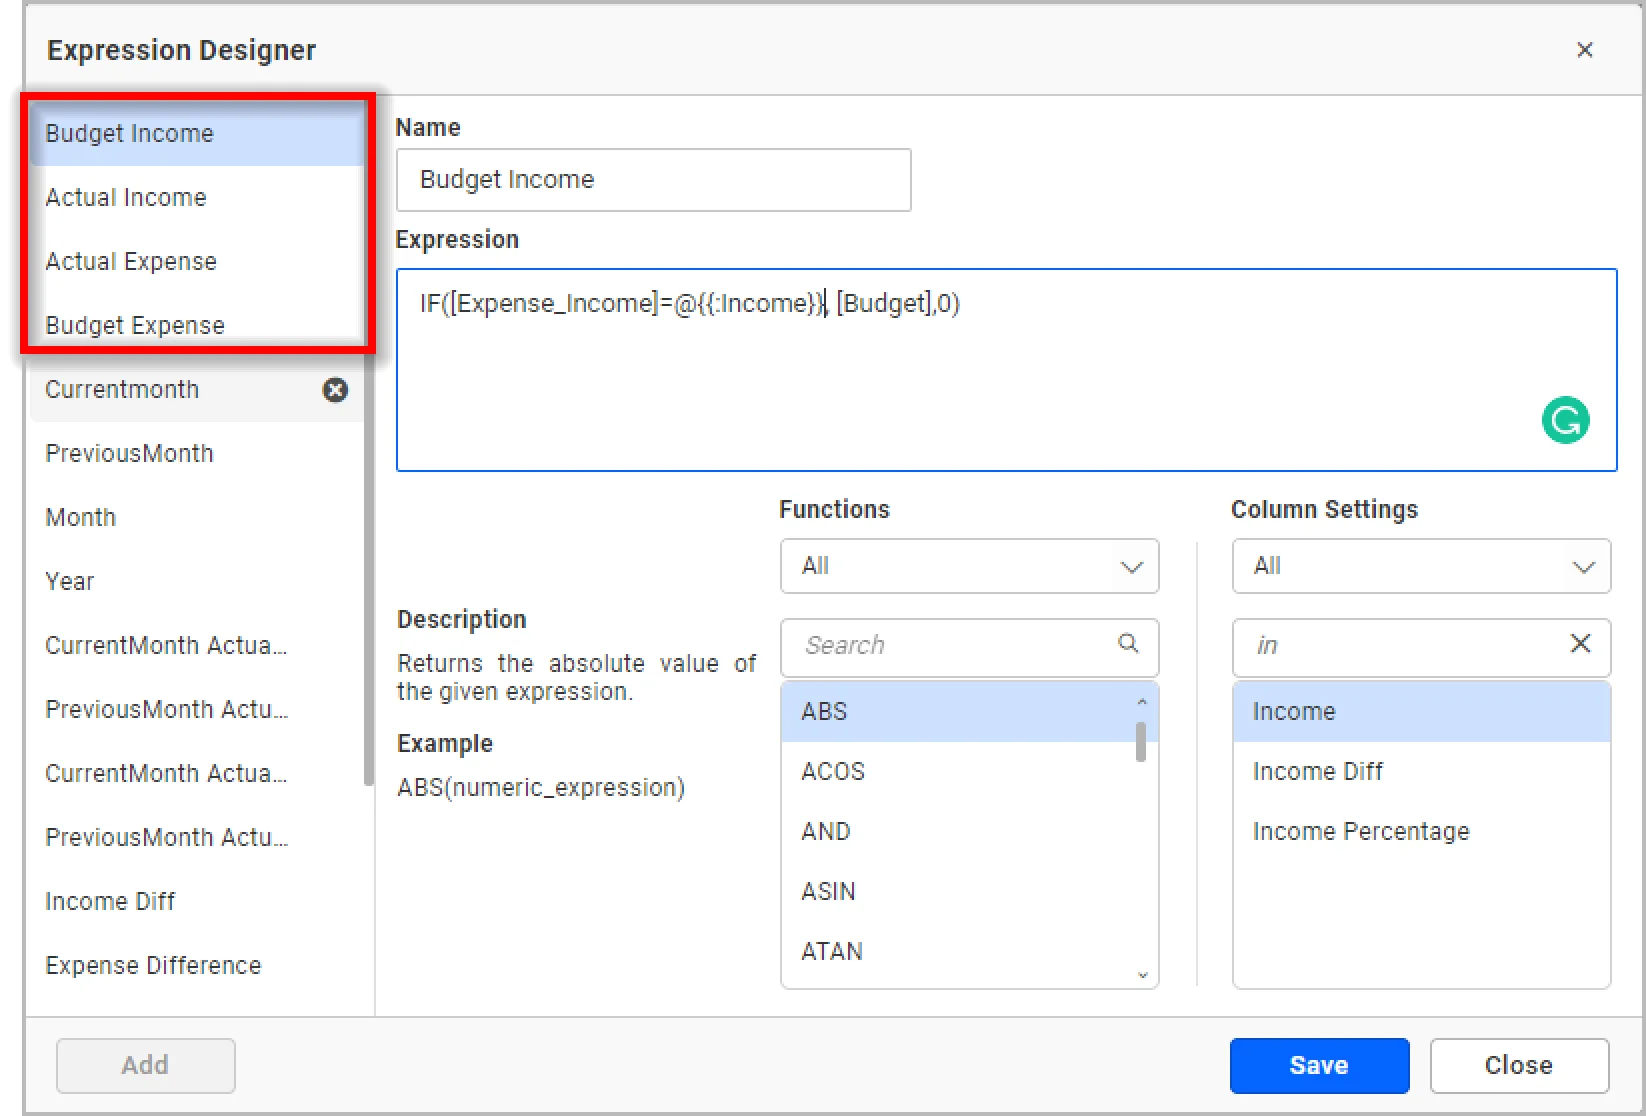
In the Budget vs. Actual Dashboard, you can monitor a company’s budget versus its actual income and expenses for a particular period of time.
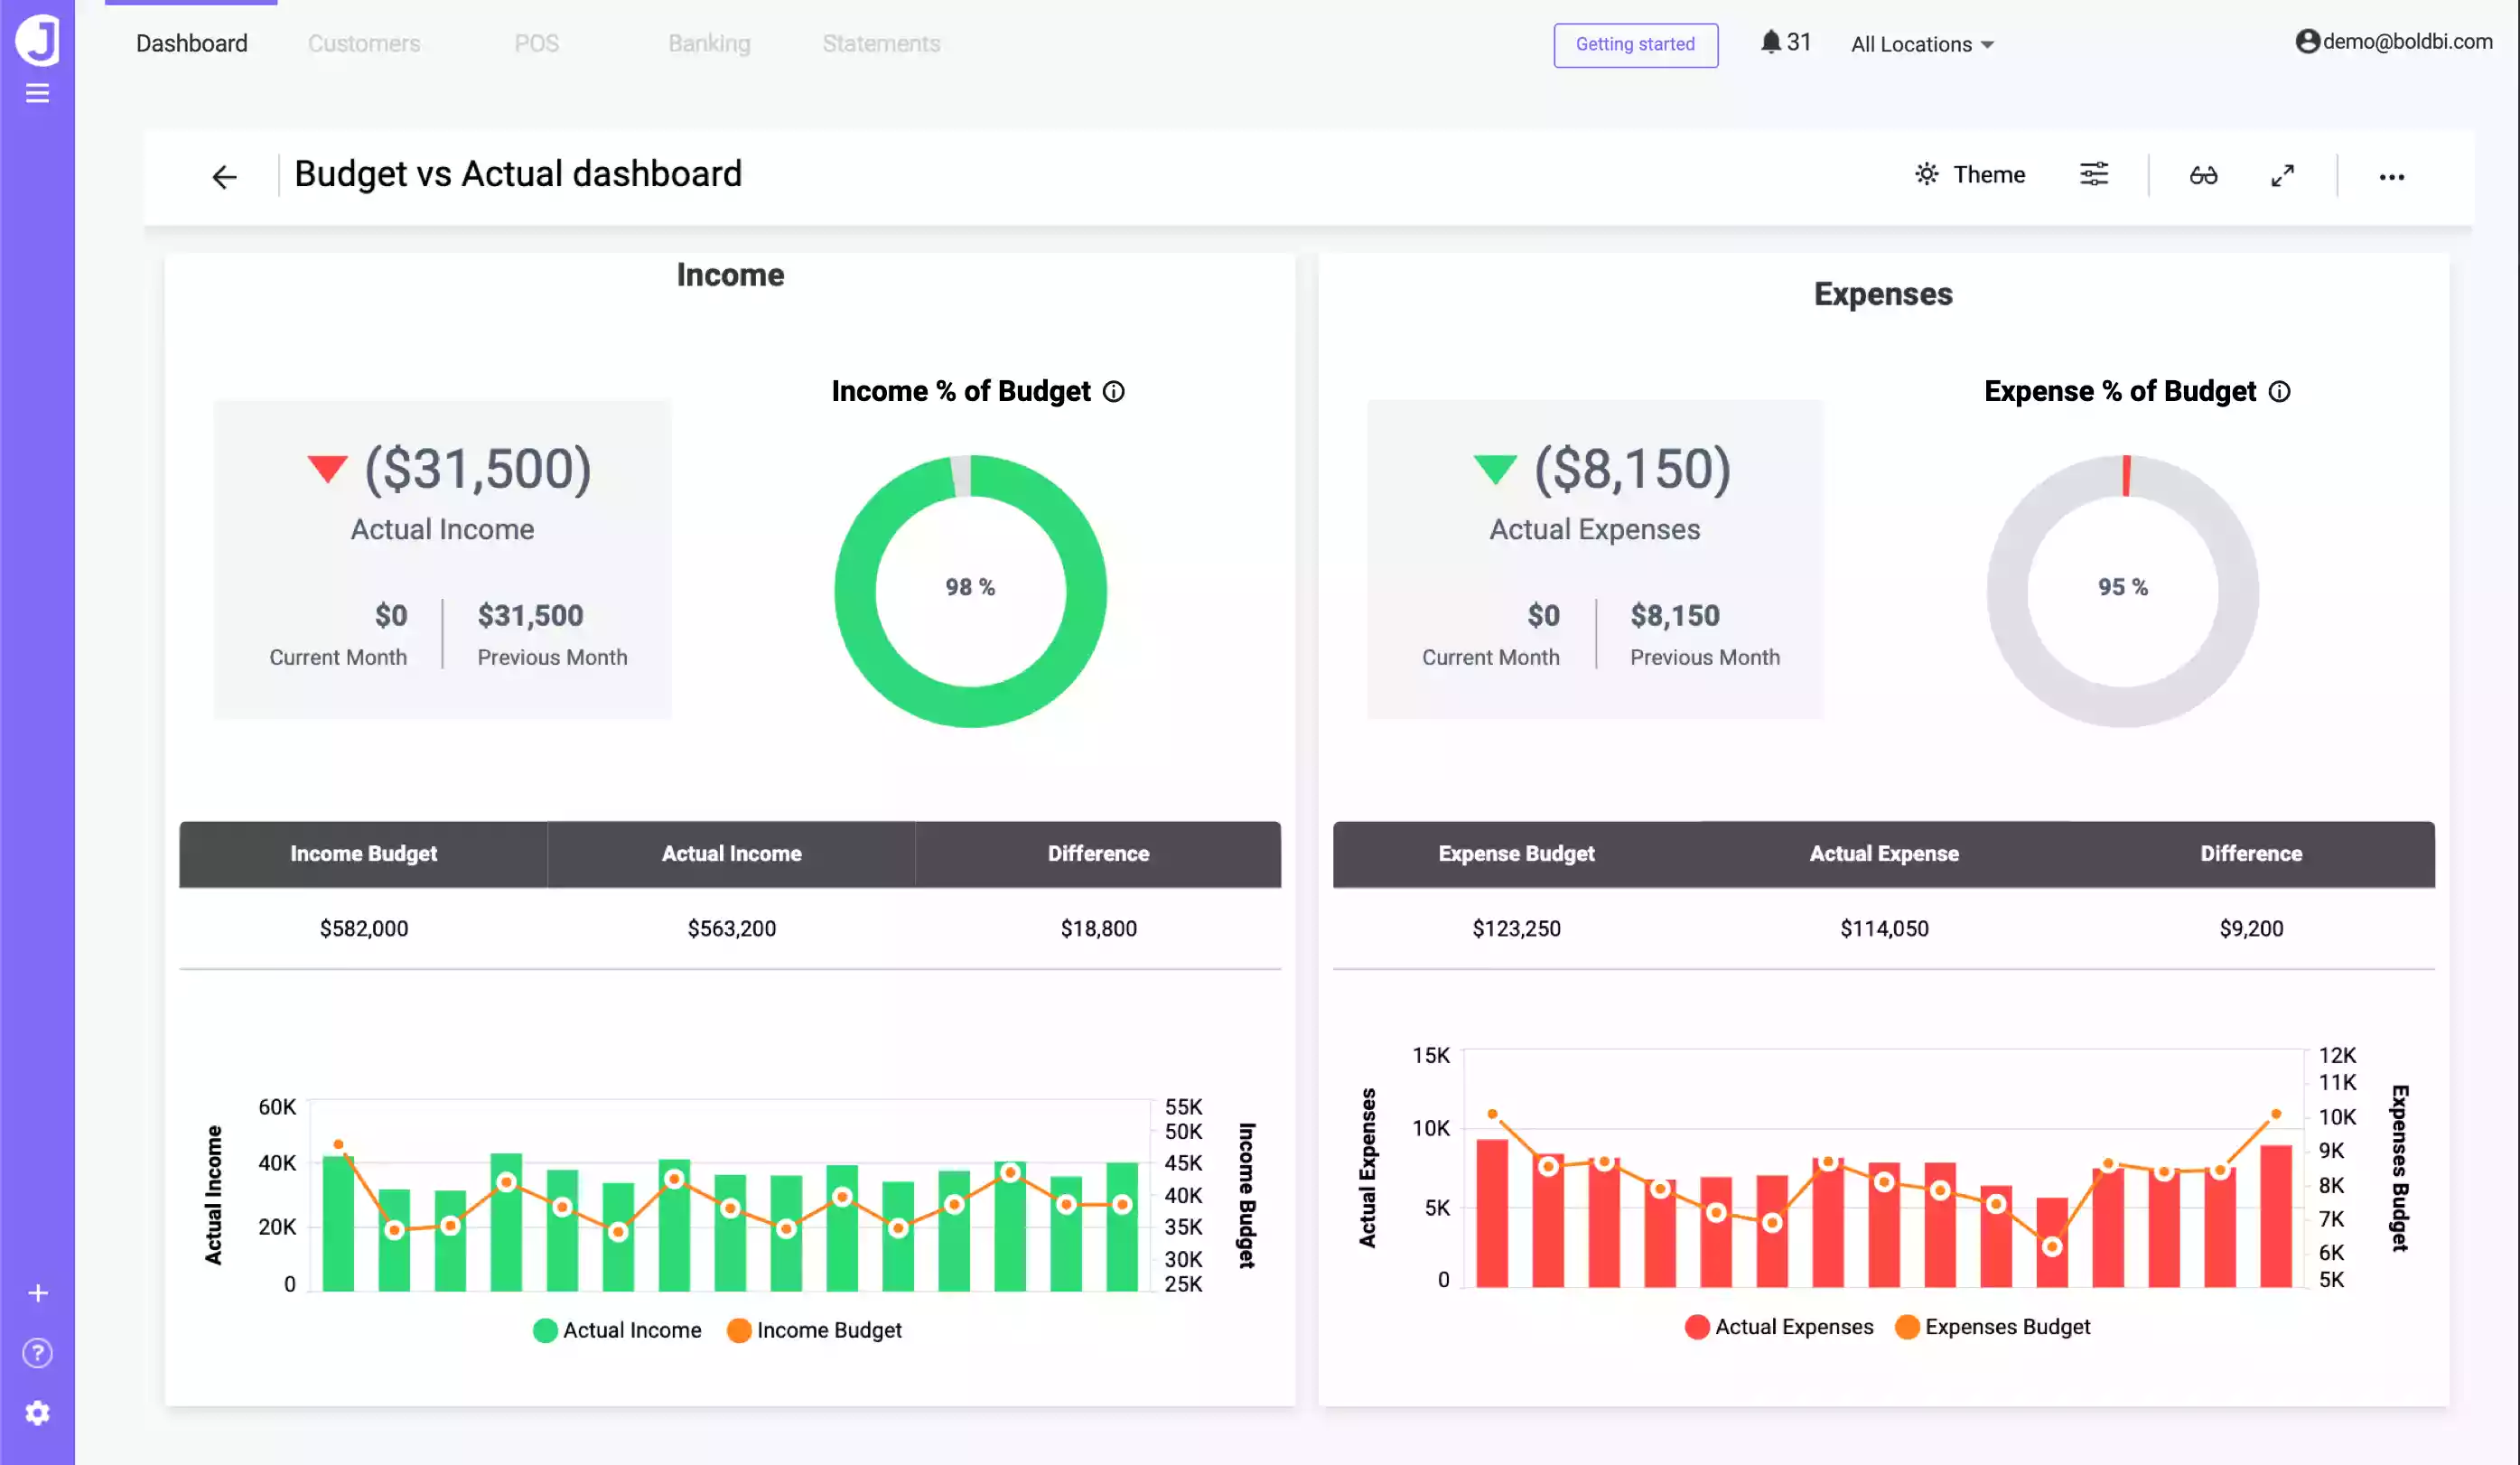
Here, income and expense constant string values are added in the dashboard parameter and used to calculate income and expenses in the expression window, as shown in the following image.
You can see how to handle dynamic parameters in calculated fields in this documentation link.
How to use dashboard parameters in stored procedures
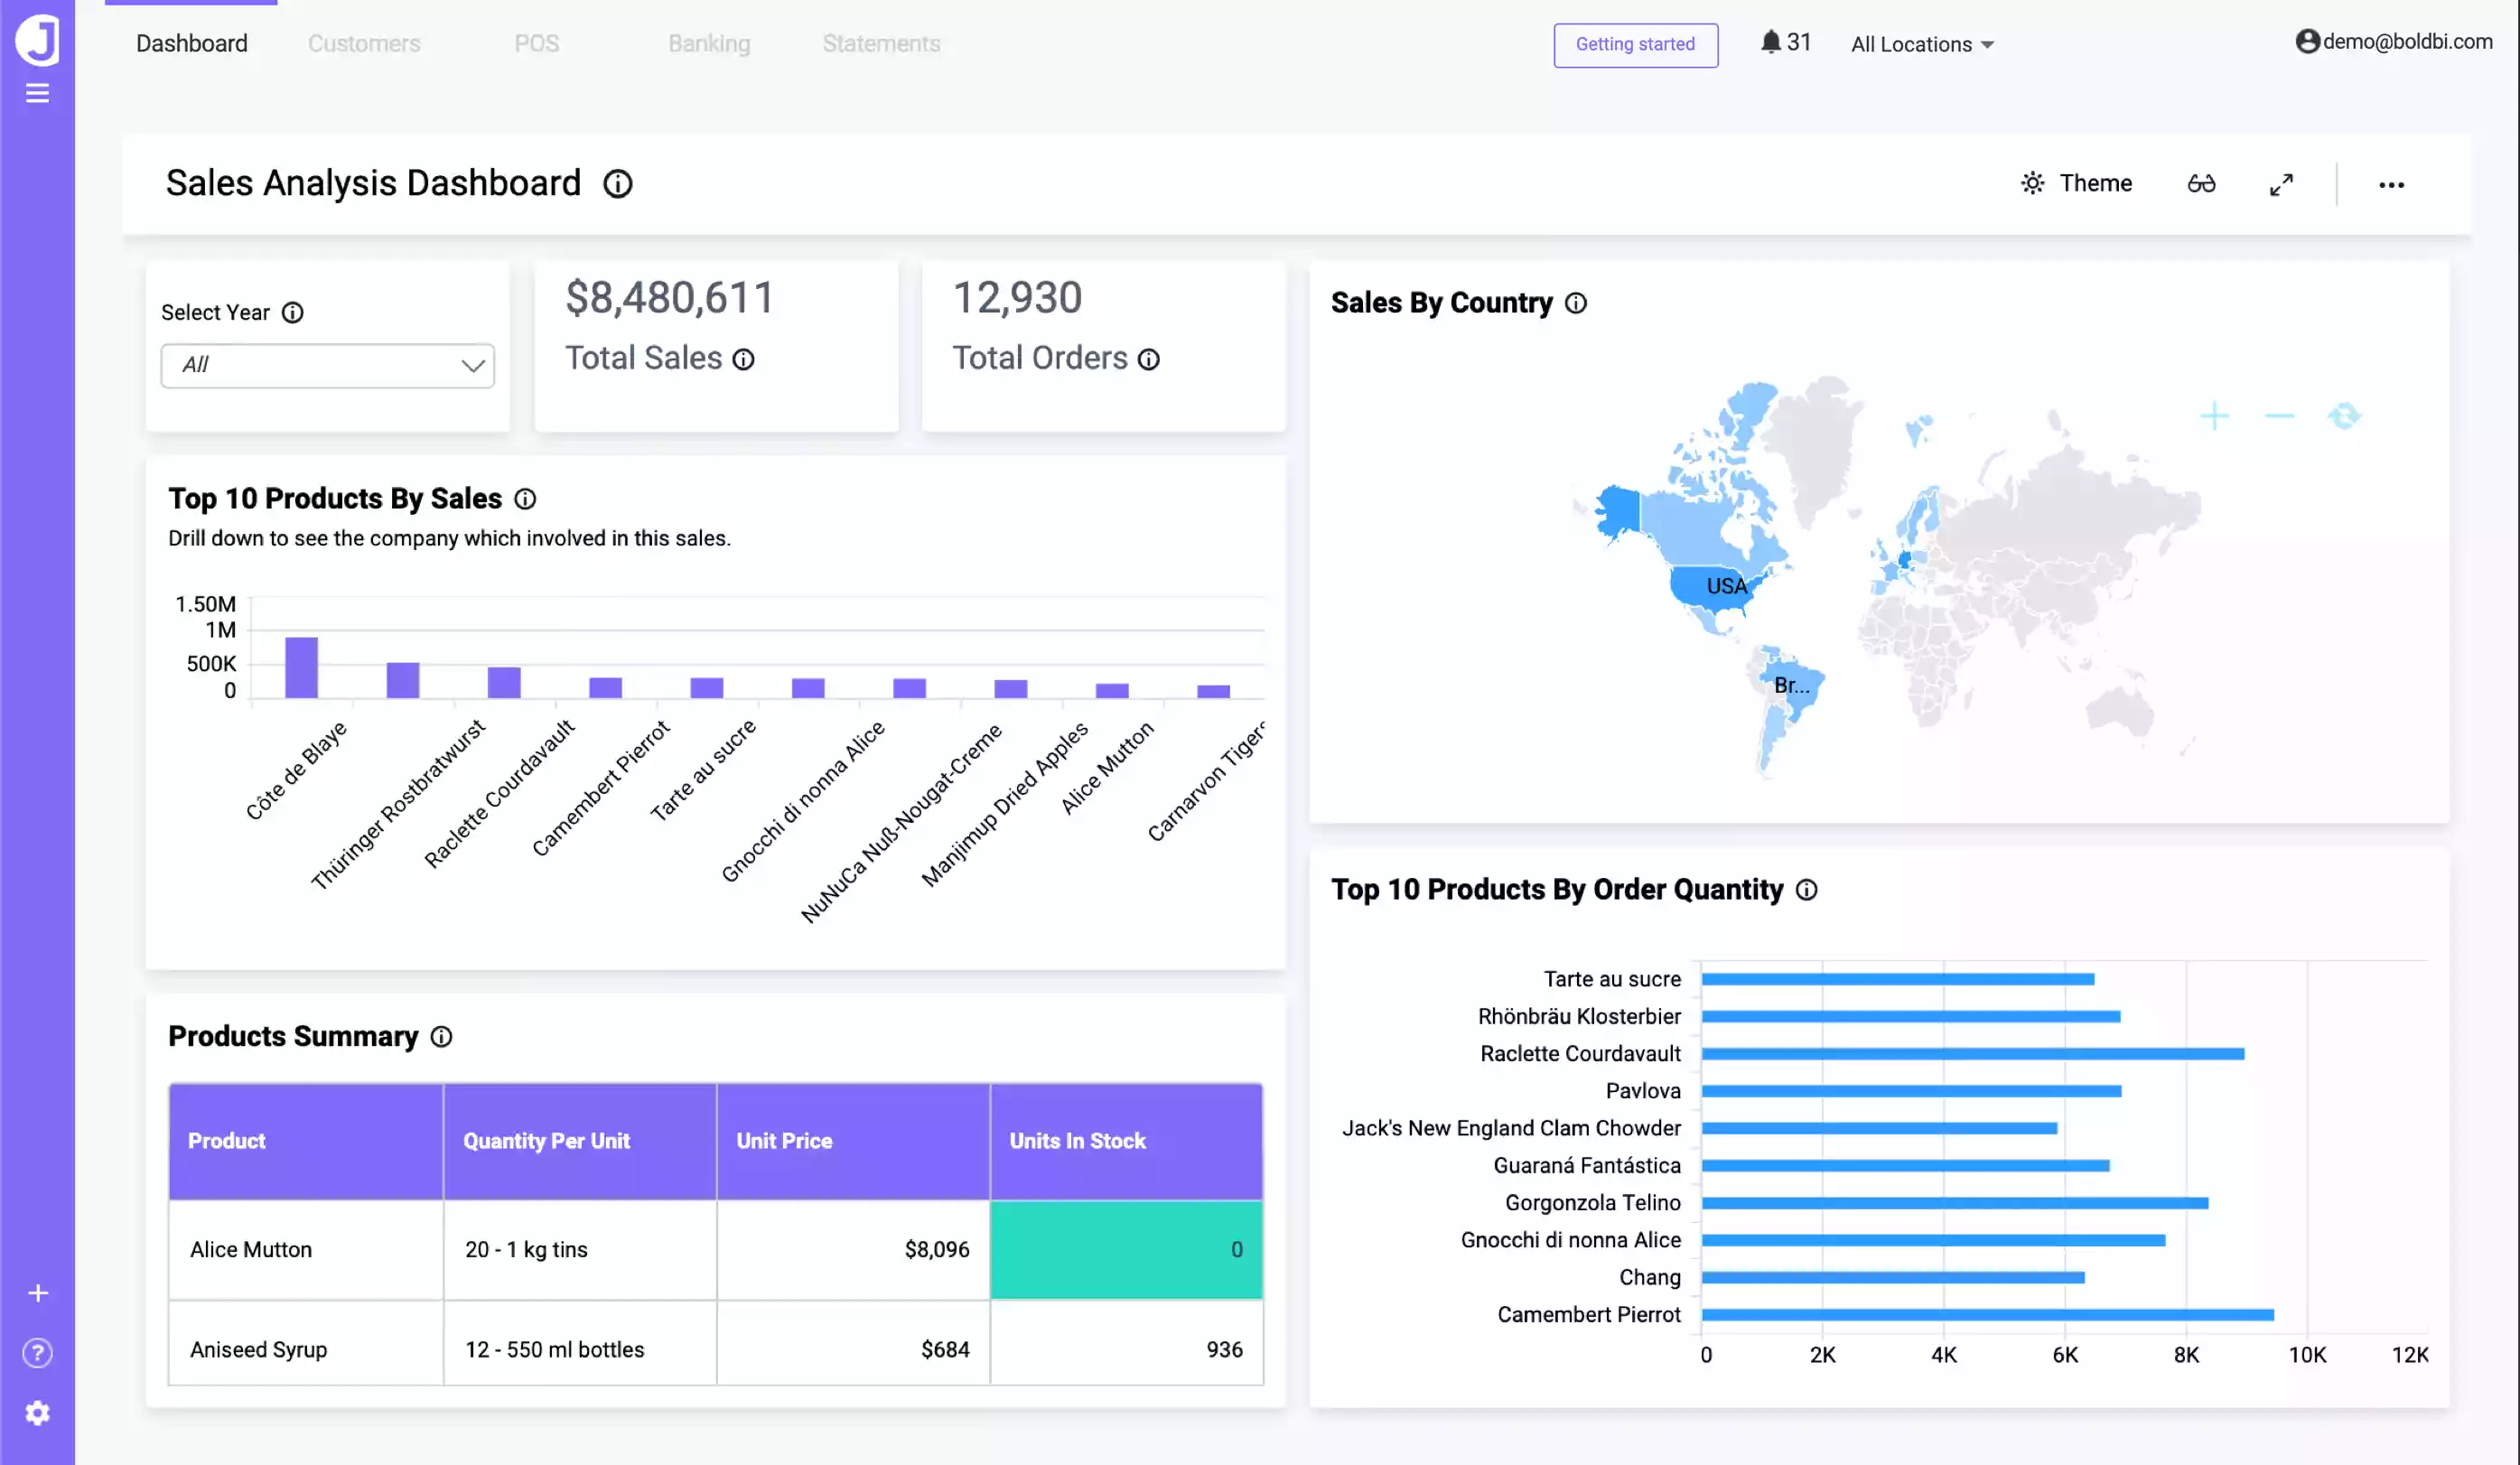
In the Sales Analysis Dashboard, you can monitor sales with respect to order quantity, sales volume, and country.
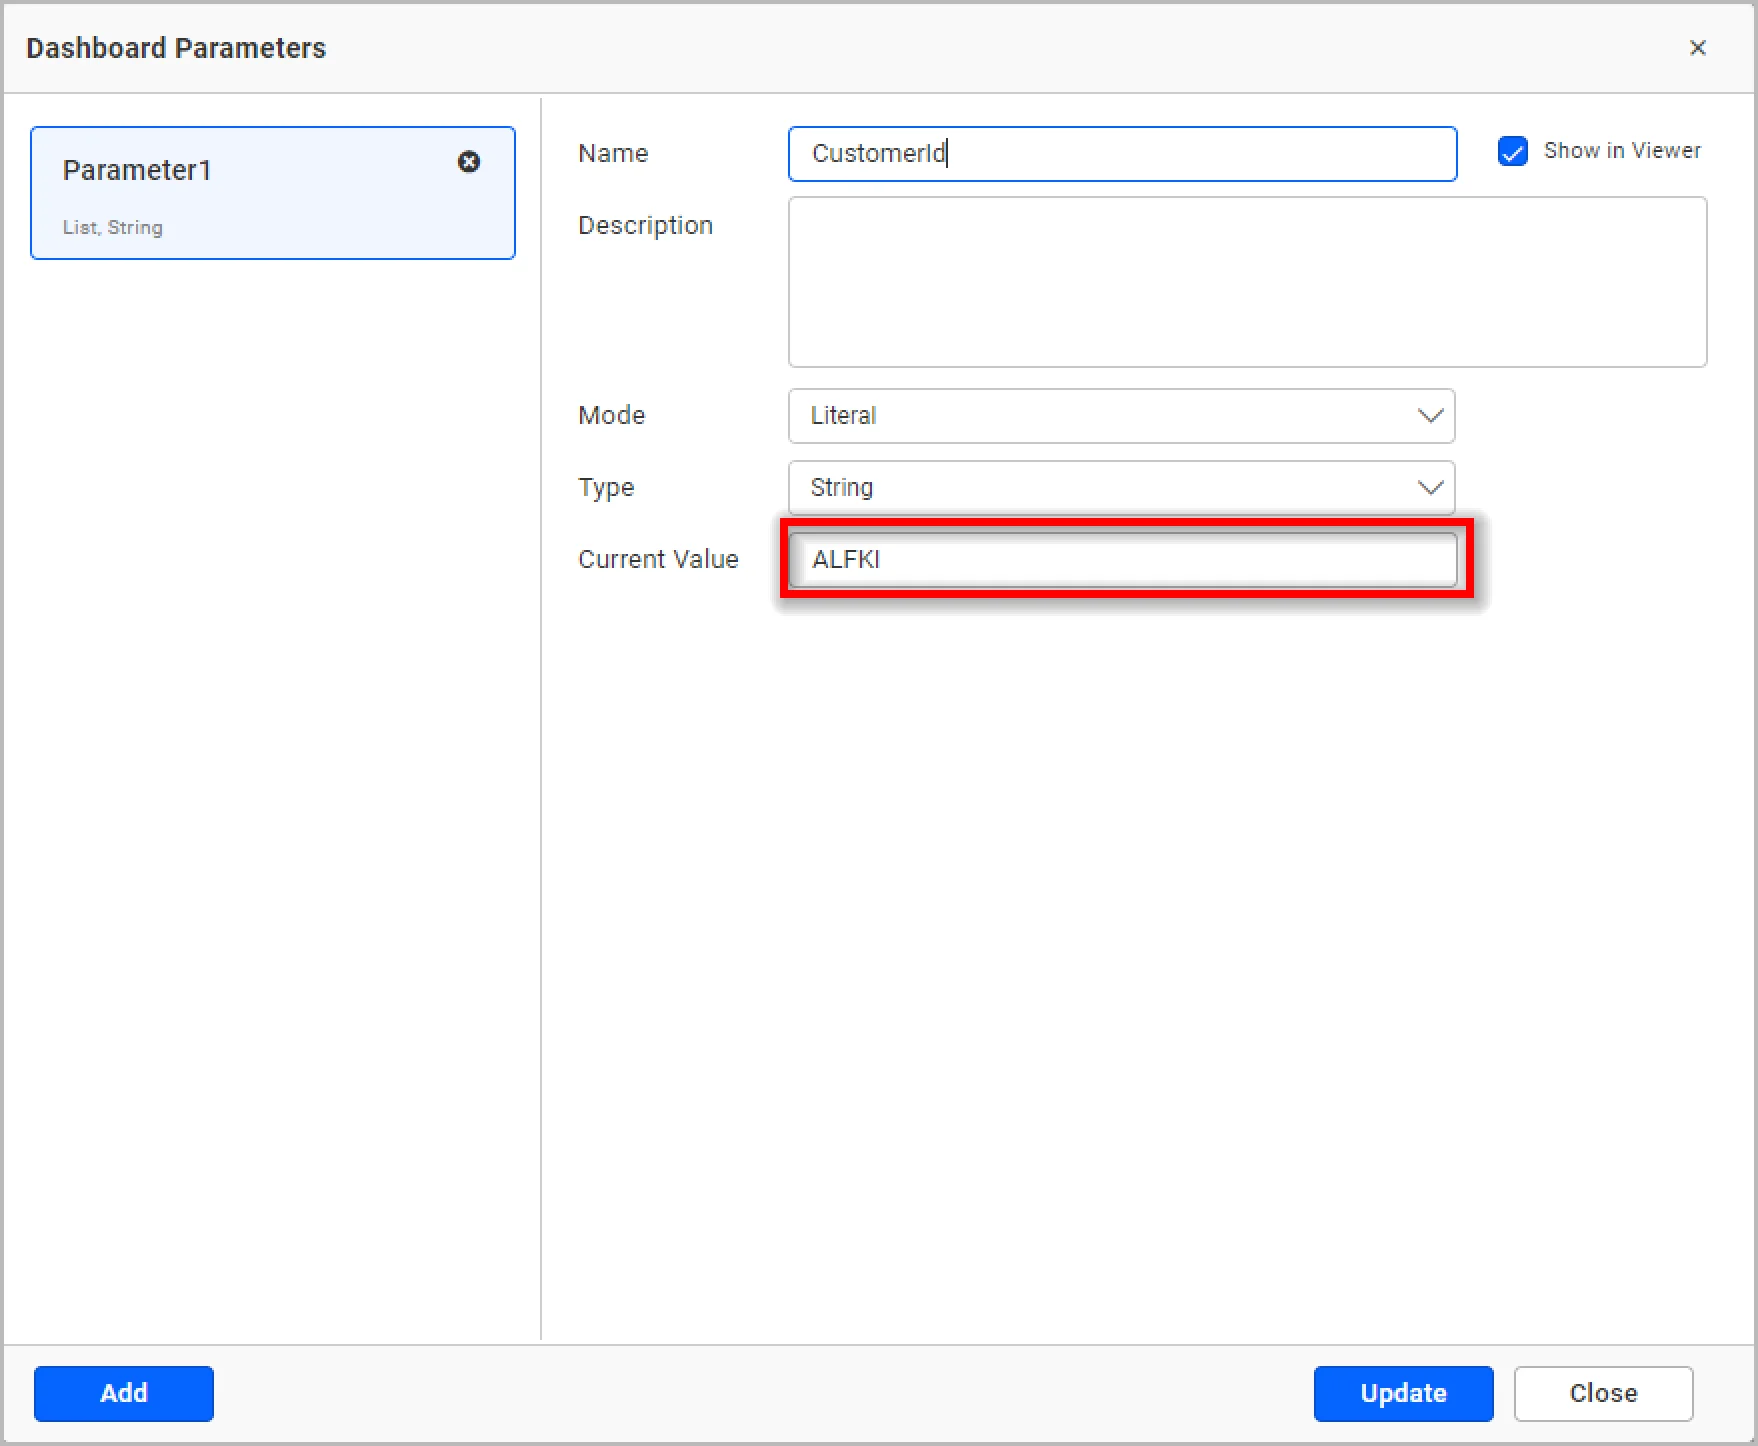
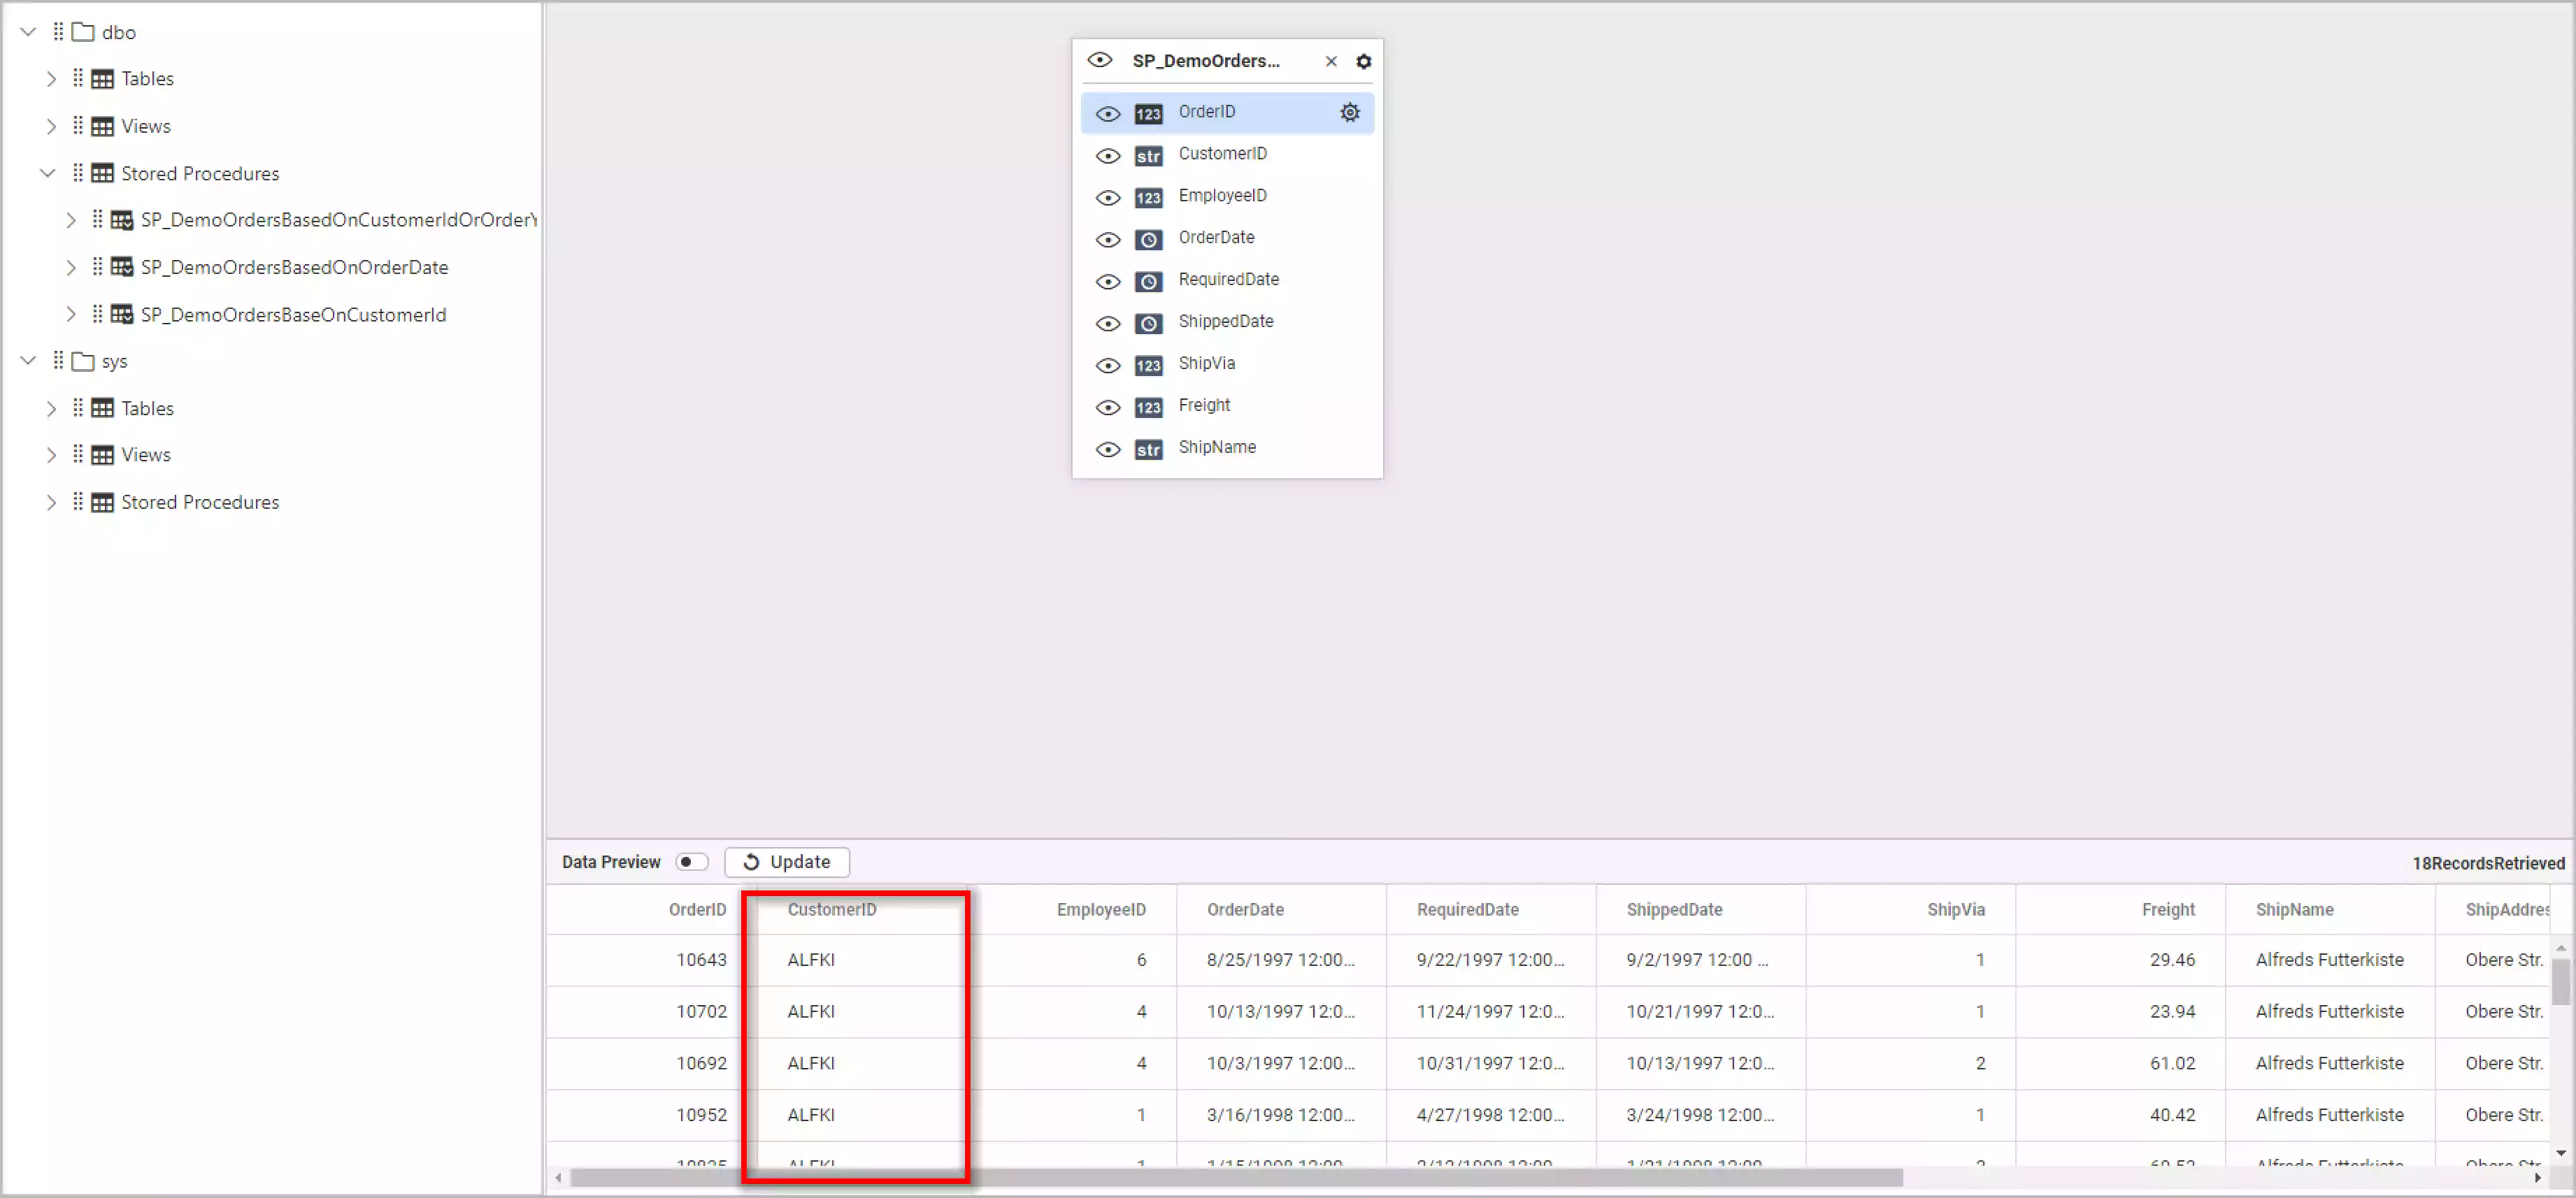
Here, I have created a dashboard parameter named CustomerId with the value ALFKI and used it in a stored procedure.
While connecting to the store procedure, you can connect the parameter value by selecting the Parameter option from the Value type drop-down and selecting the desired parameter from the Value drop-down, as shown in the following image.
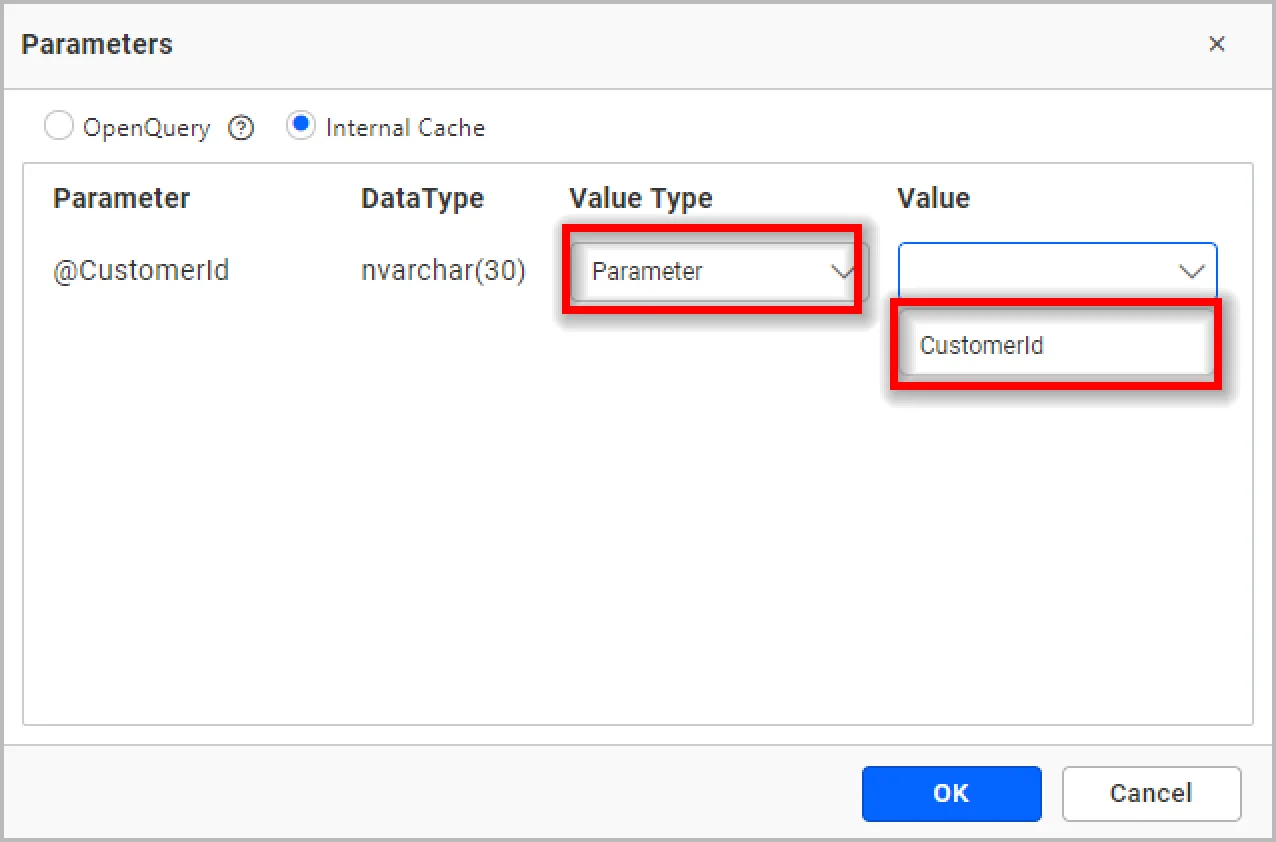
With the Open Query option, you can get live data. It is not supported for Azure SQL. With the Internal Cache option, you can store data inside our intermediate DB, and therefore we will not get live data.
After connecting the dashboard parameter, you can find the parameter applied and the desired values retrieved.
You can see how to handle dynamic parameters in stored procedures in this documentation link.
Now, let’s see how to use a dashboard parameter as a query parameter in a custom query-based data source.
How to use dashboard parameters in a custom query
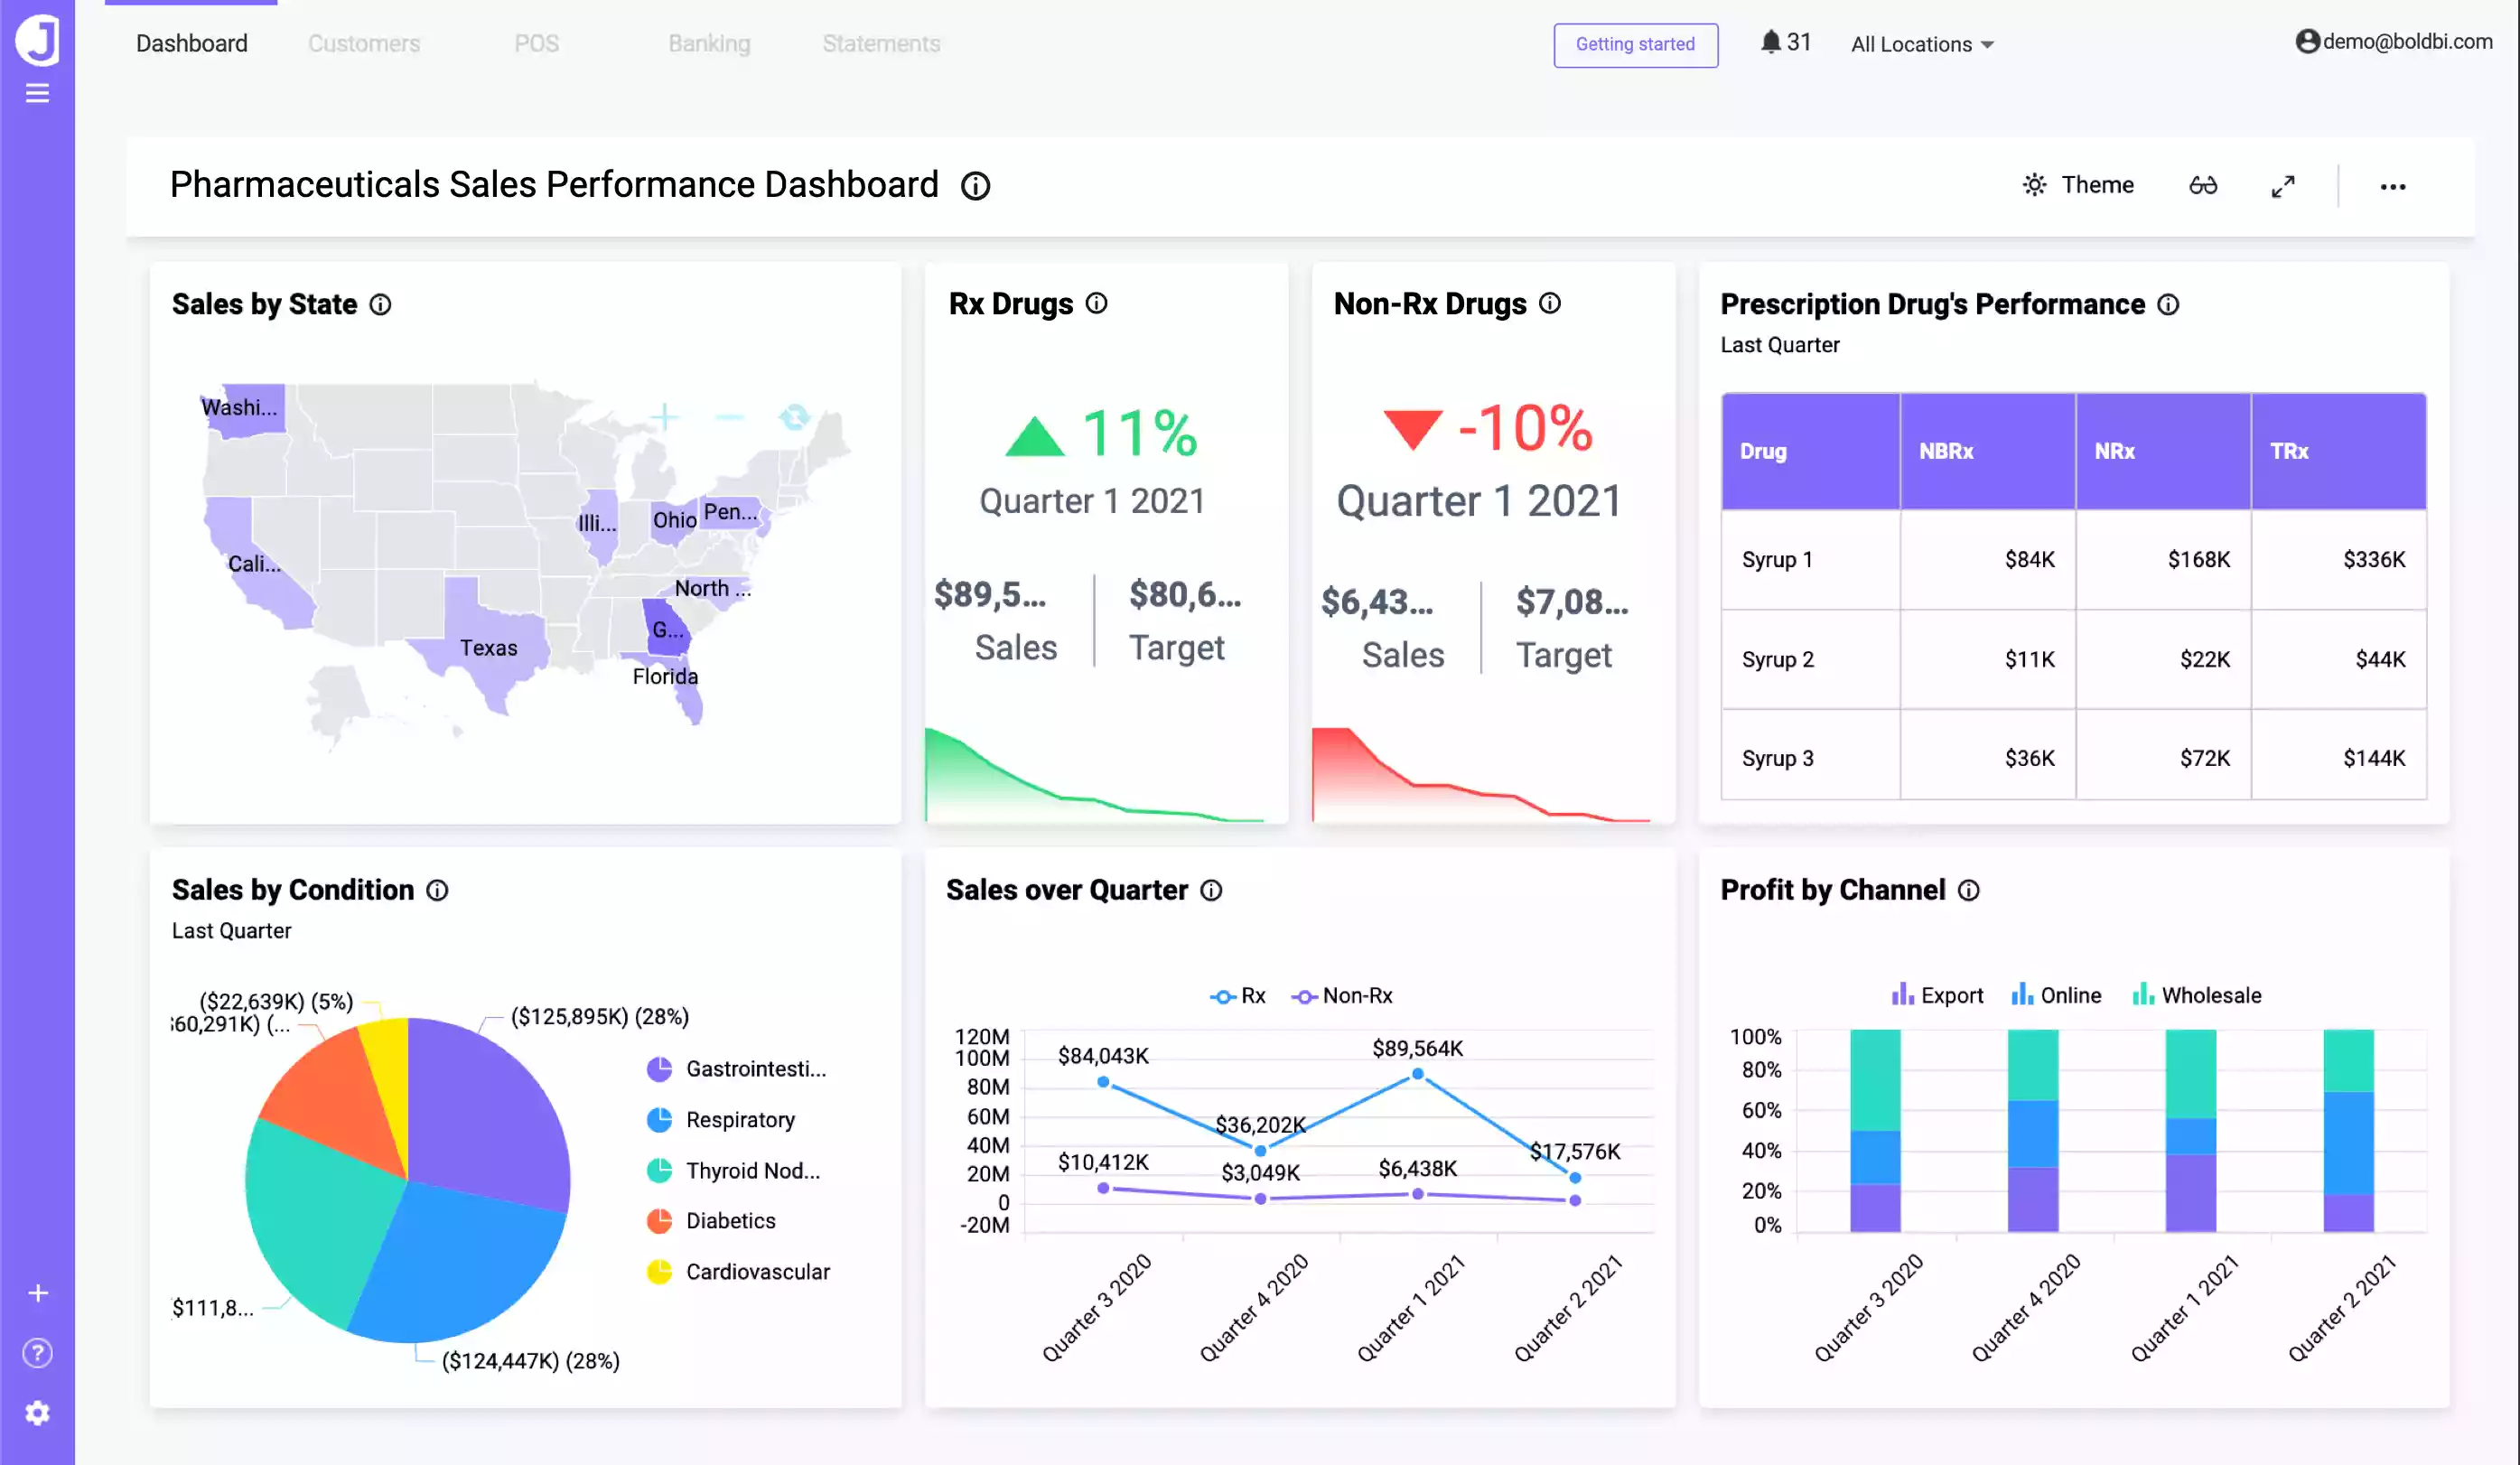
Let’s consider the Pharmaceuticals Sales Performance Dashboard, which shows Rx and non-Rx drug sales performance in different states via important key metrics. You can compare the changes over different quarters and channels and analyze the sales and profit incurred.
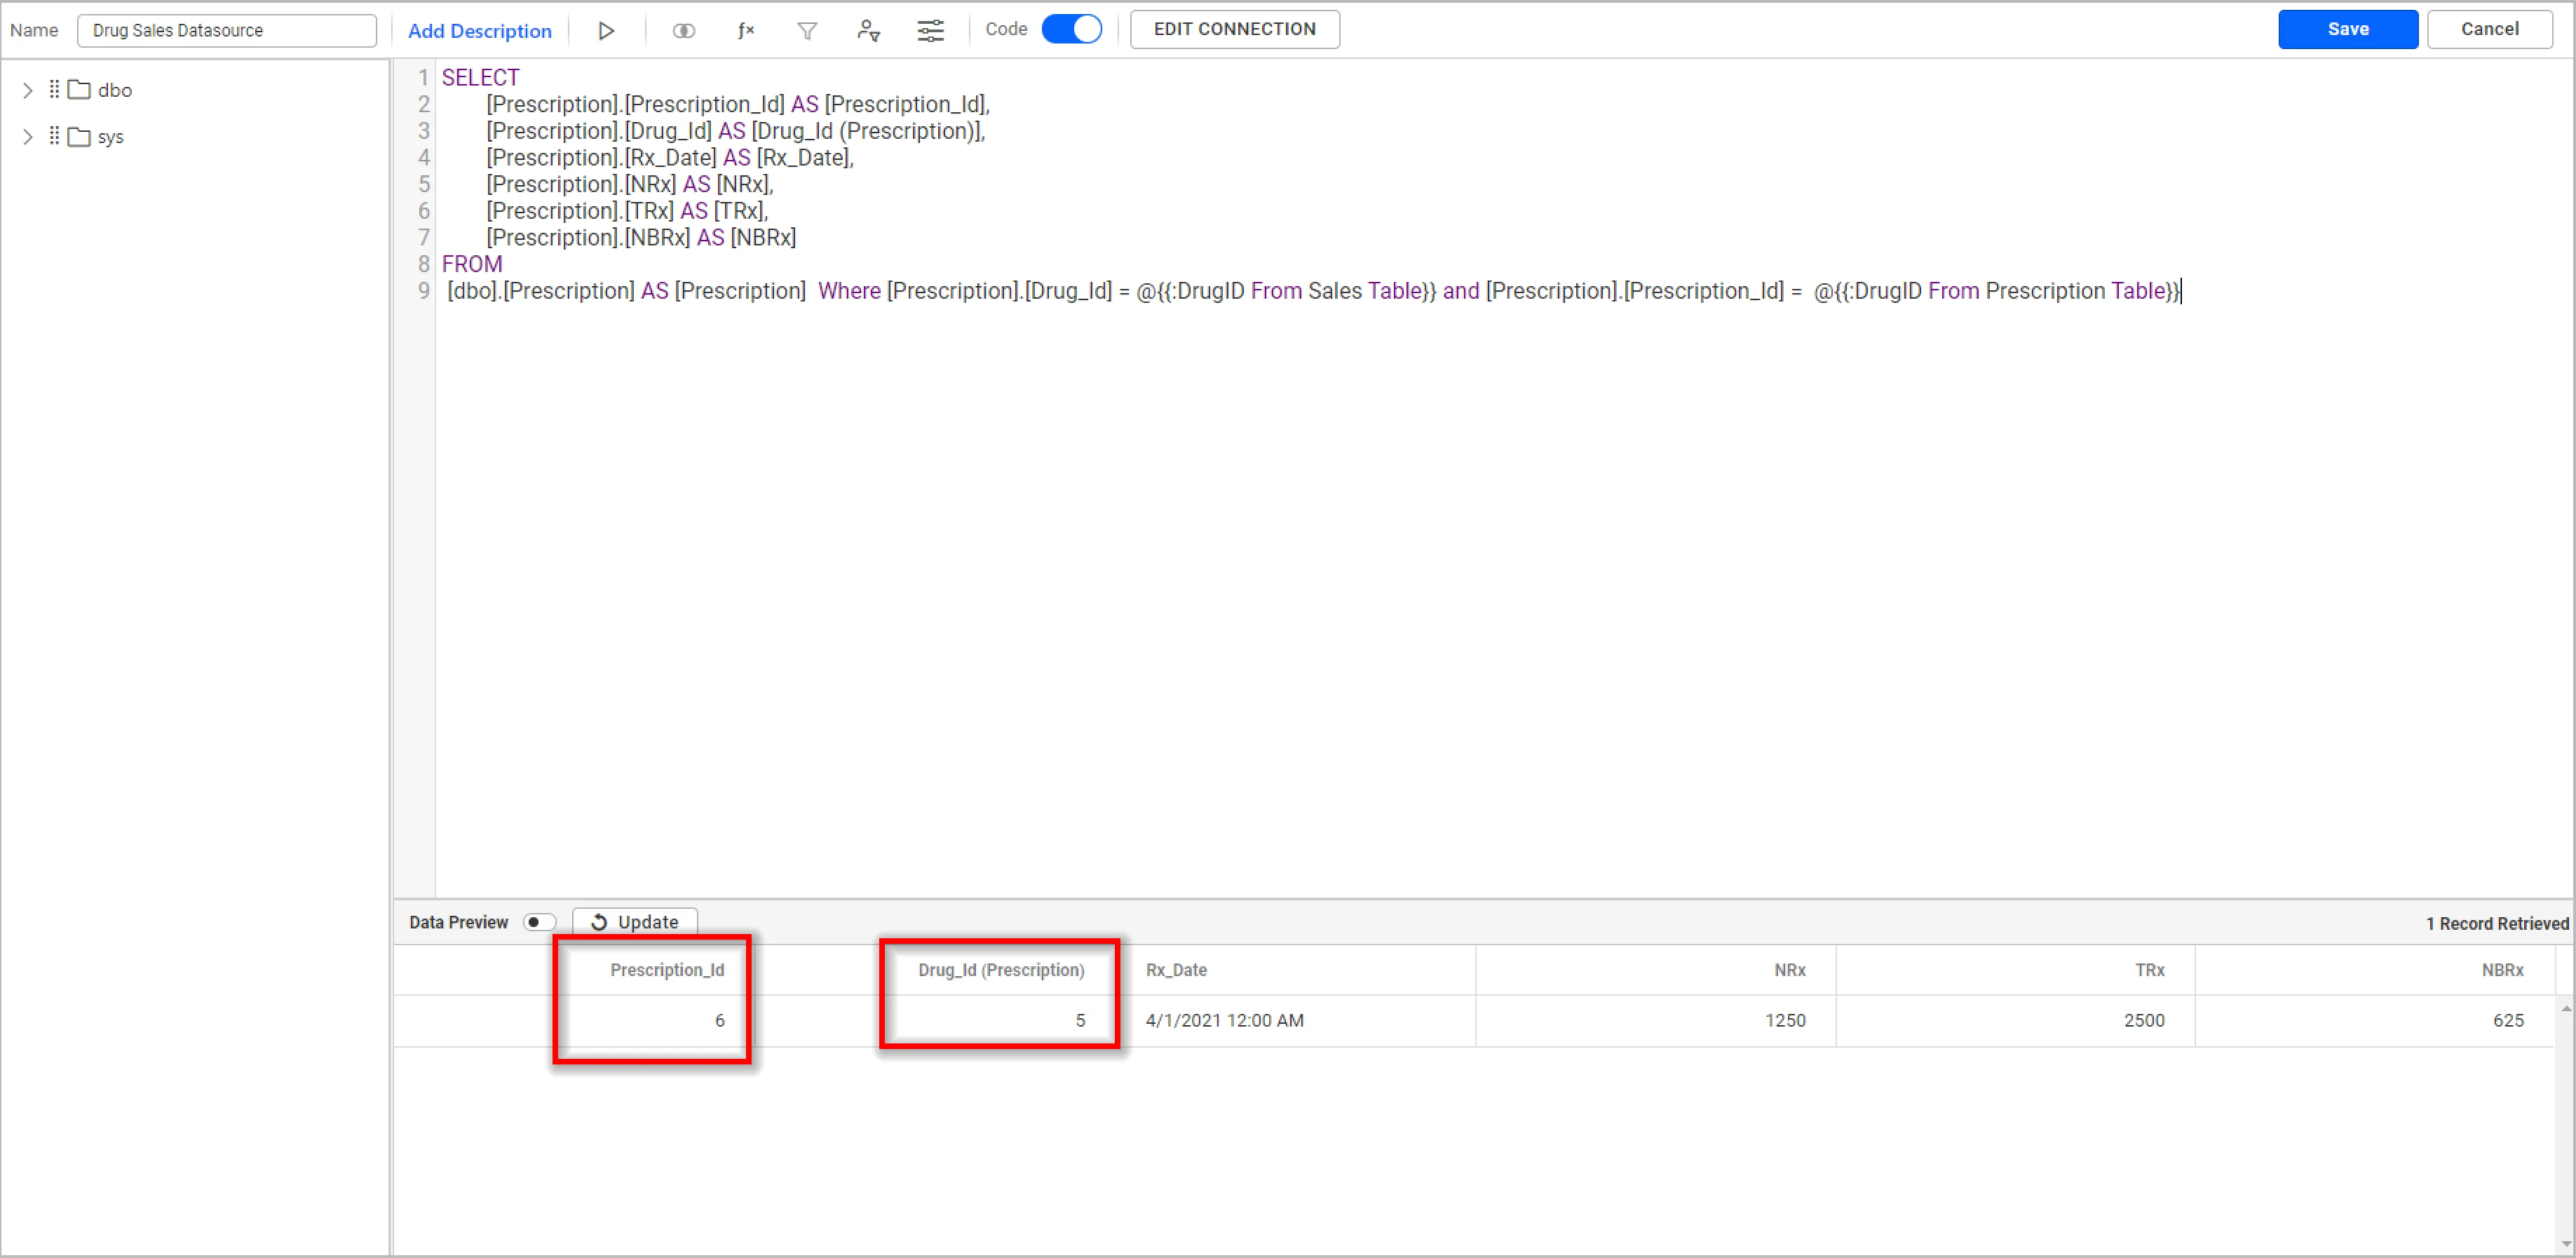
You can use dashboard parameters in custom queries by adding the dashboard parameter in the query editor window. I’m trying to retrieve drugs based on a Drug ID and Prescription ID whose values are 5 and 6. You can add the Drug_ID and Prescription_ID fields from the Drug_sales and Prescription tables from the current data source as shown in the following screenshot.
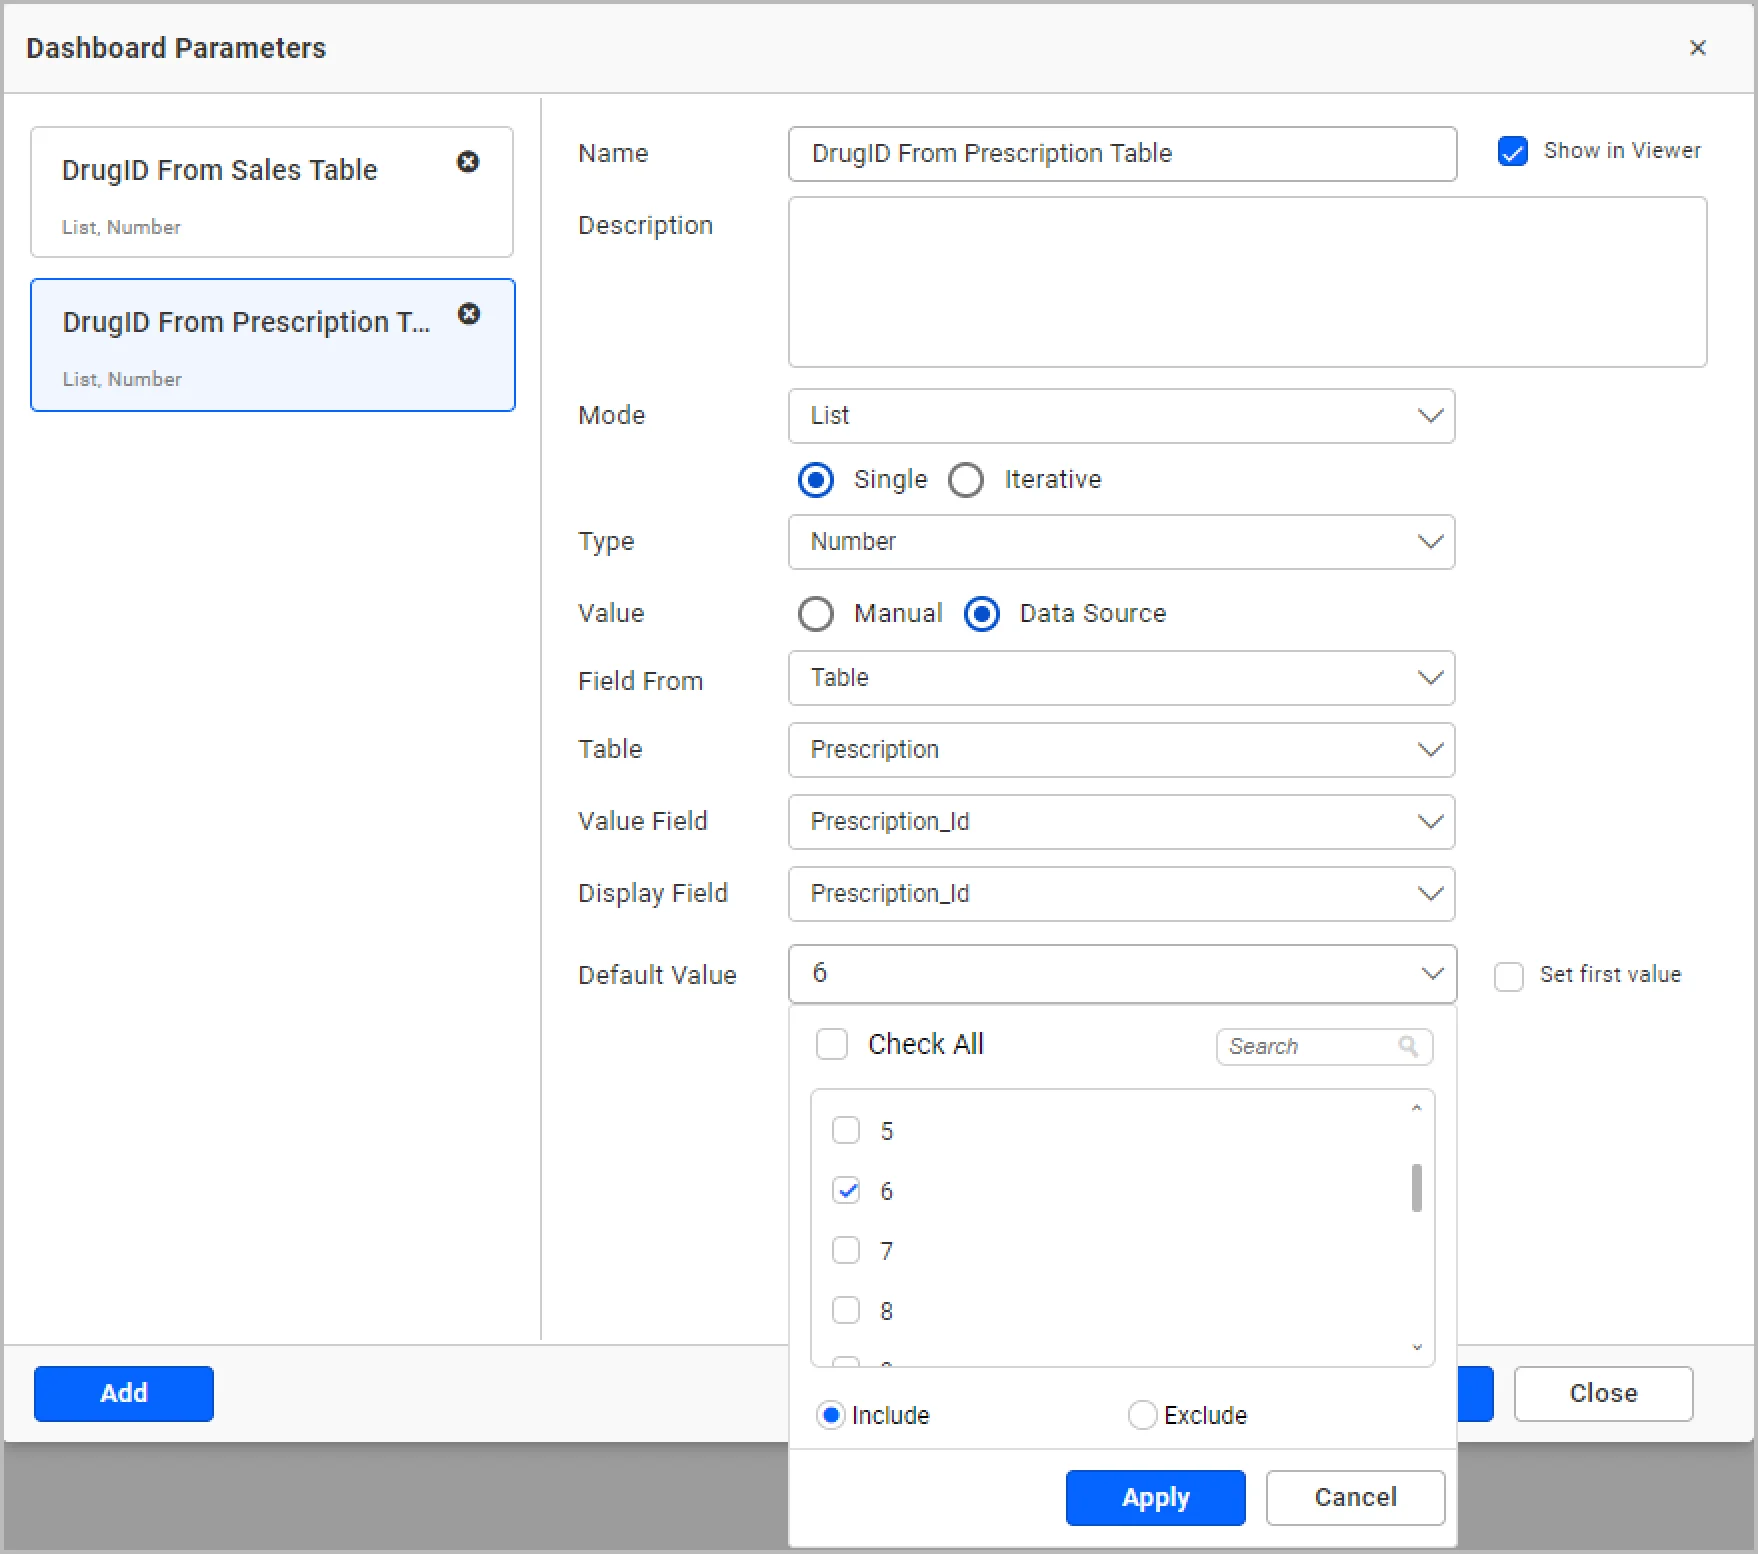
You can add the dynamic parameter in the query editor window on same data source or another data source by clicking the @ symbol and selecting the desired parameter.
Check out our dashboard parameter documentation for more details on configuring dashboard parameters.
We have seen how to configure dynamic parameters in RESTful services, calculated fields, stored procedures, and custom queries. Let’s see how to update dashboard parameter values dynamically while viewing a dashboard.
How to change dashboard parameter values dynamically in view mode
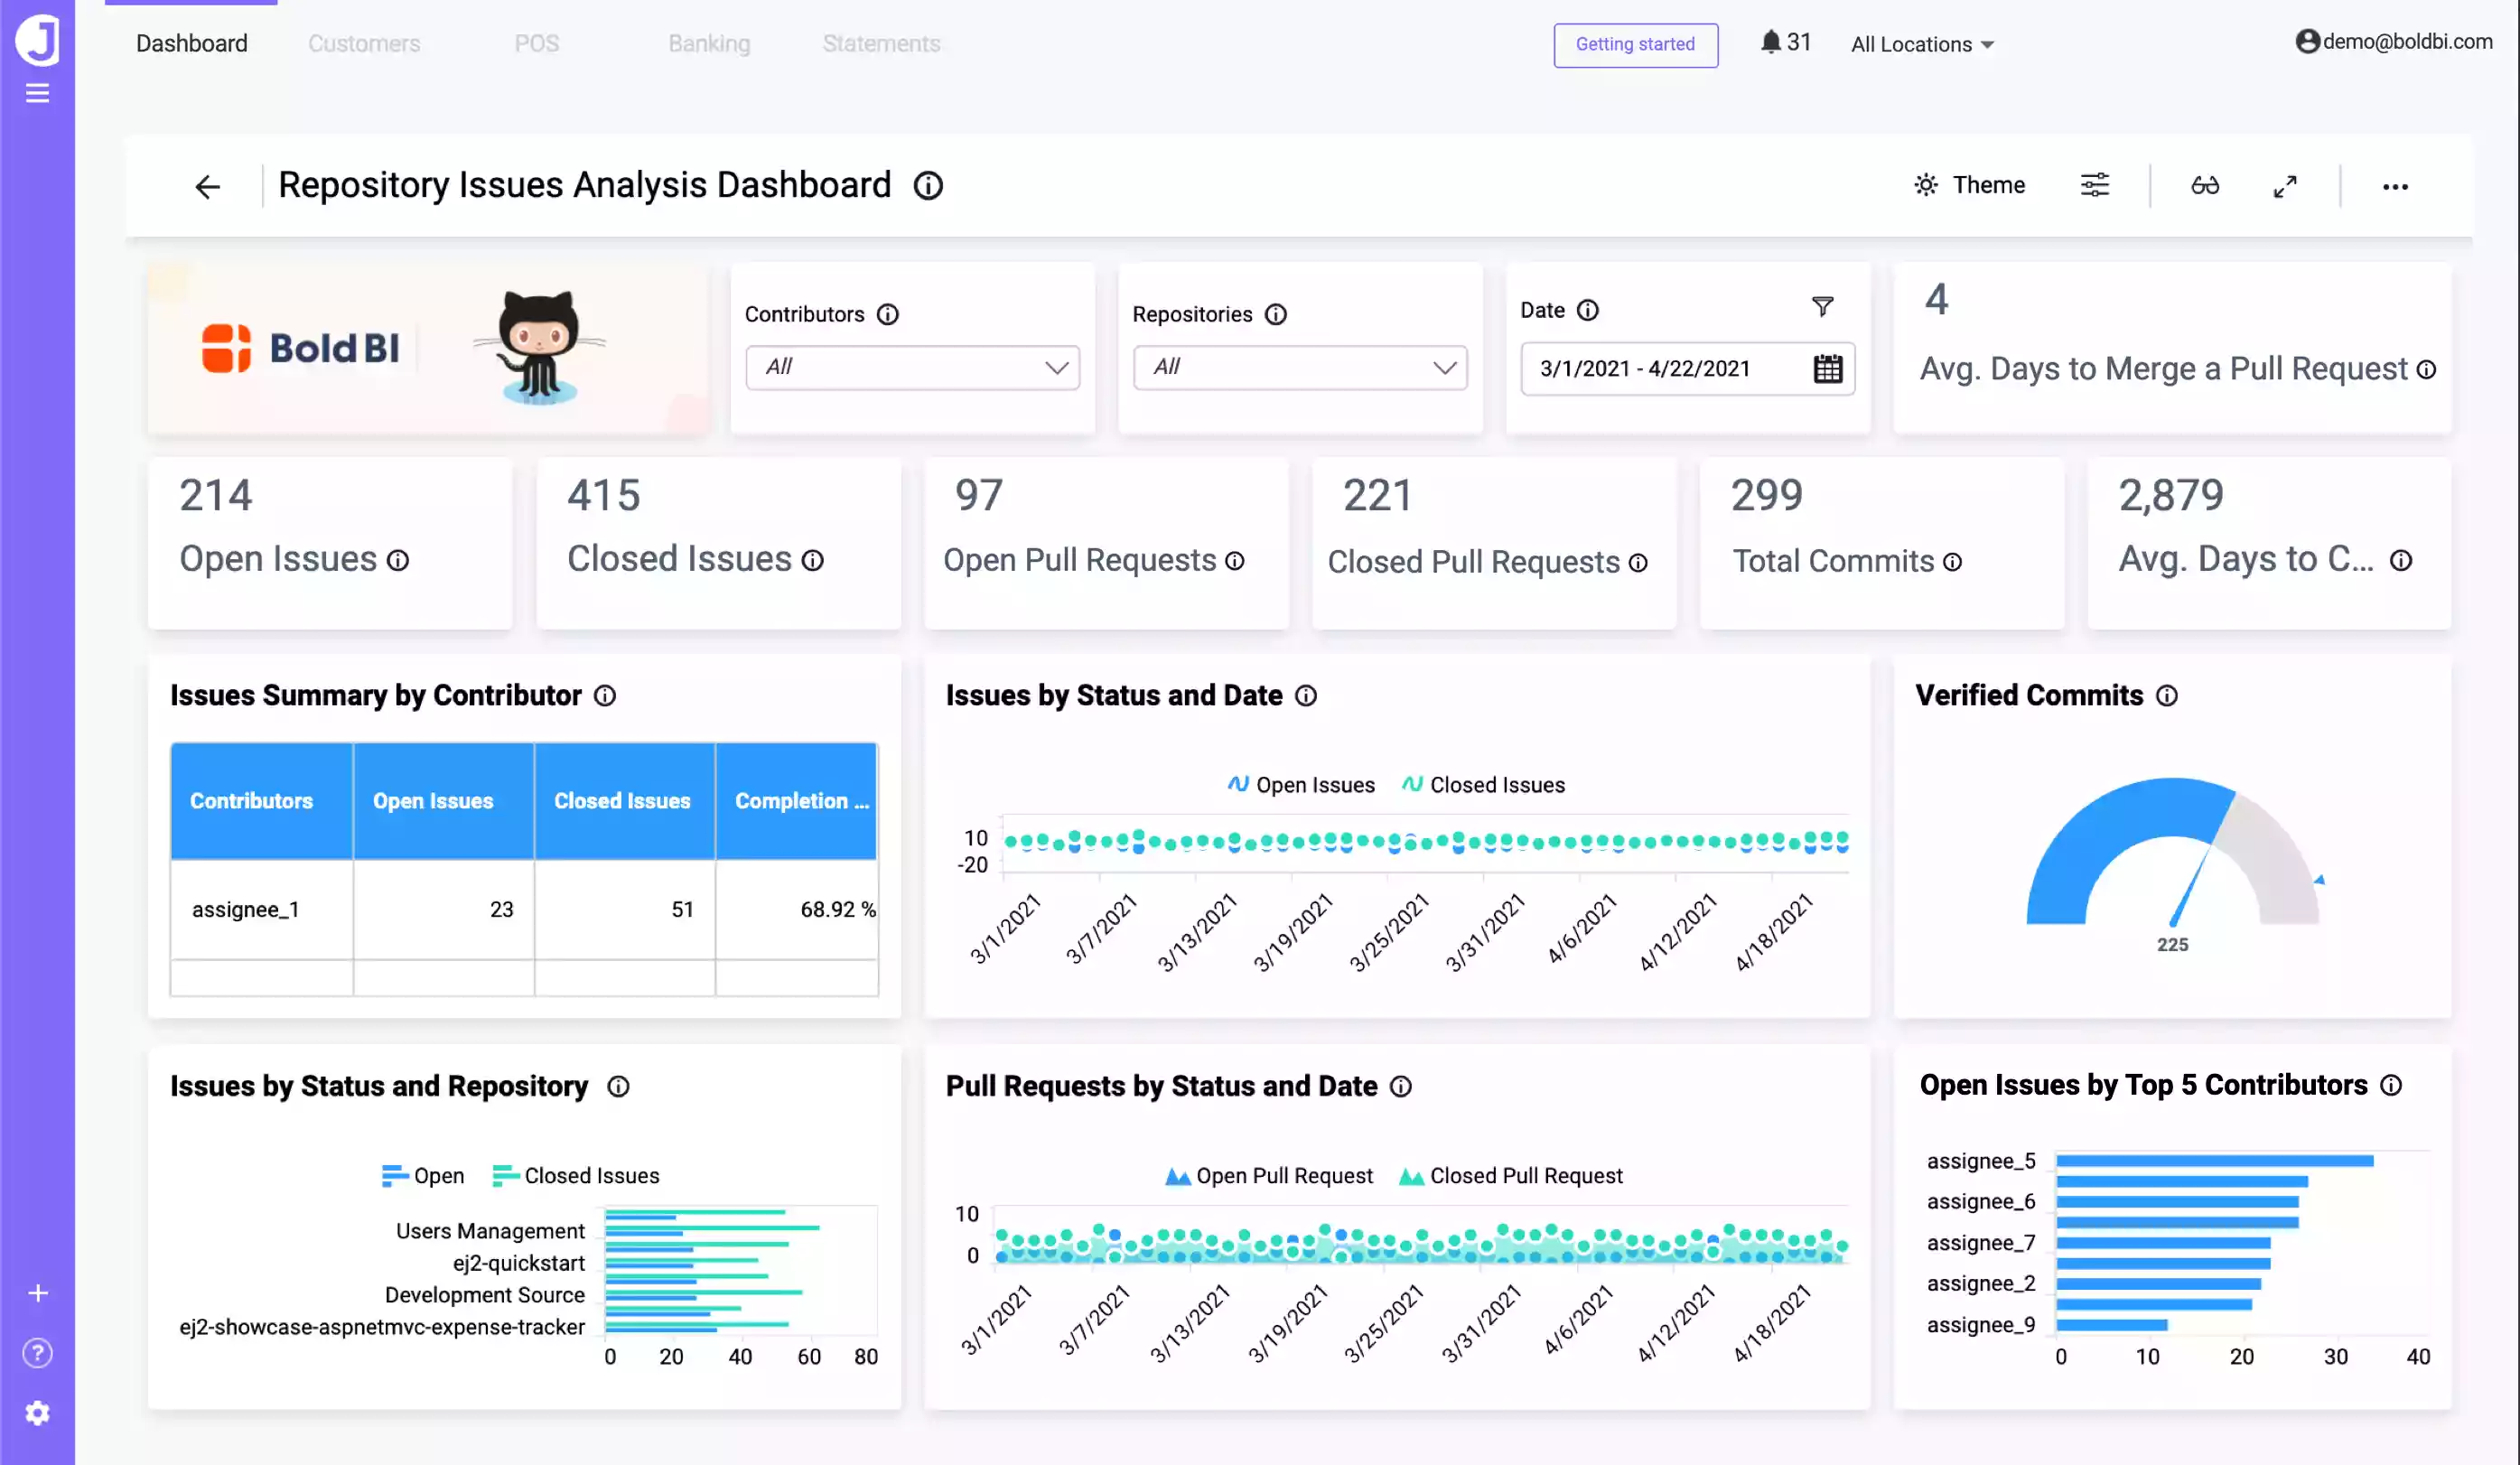
The following GitHub dashboard shows GitHub metrics that track activities, pulls, and commits. These activities are fetched from an individual data source. However, these activities can be tracked for all repositories through a configured repository name in a dashboard parameter with list mode. Then, the dashboard parameter is passed in a web API to fetch the pull request and issue records from all repositories.
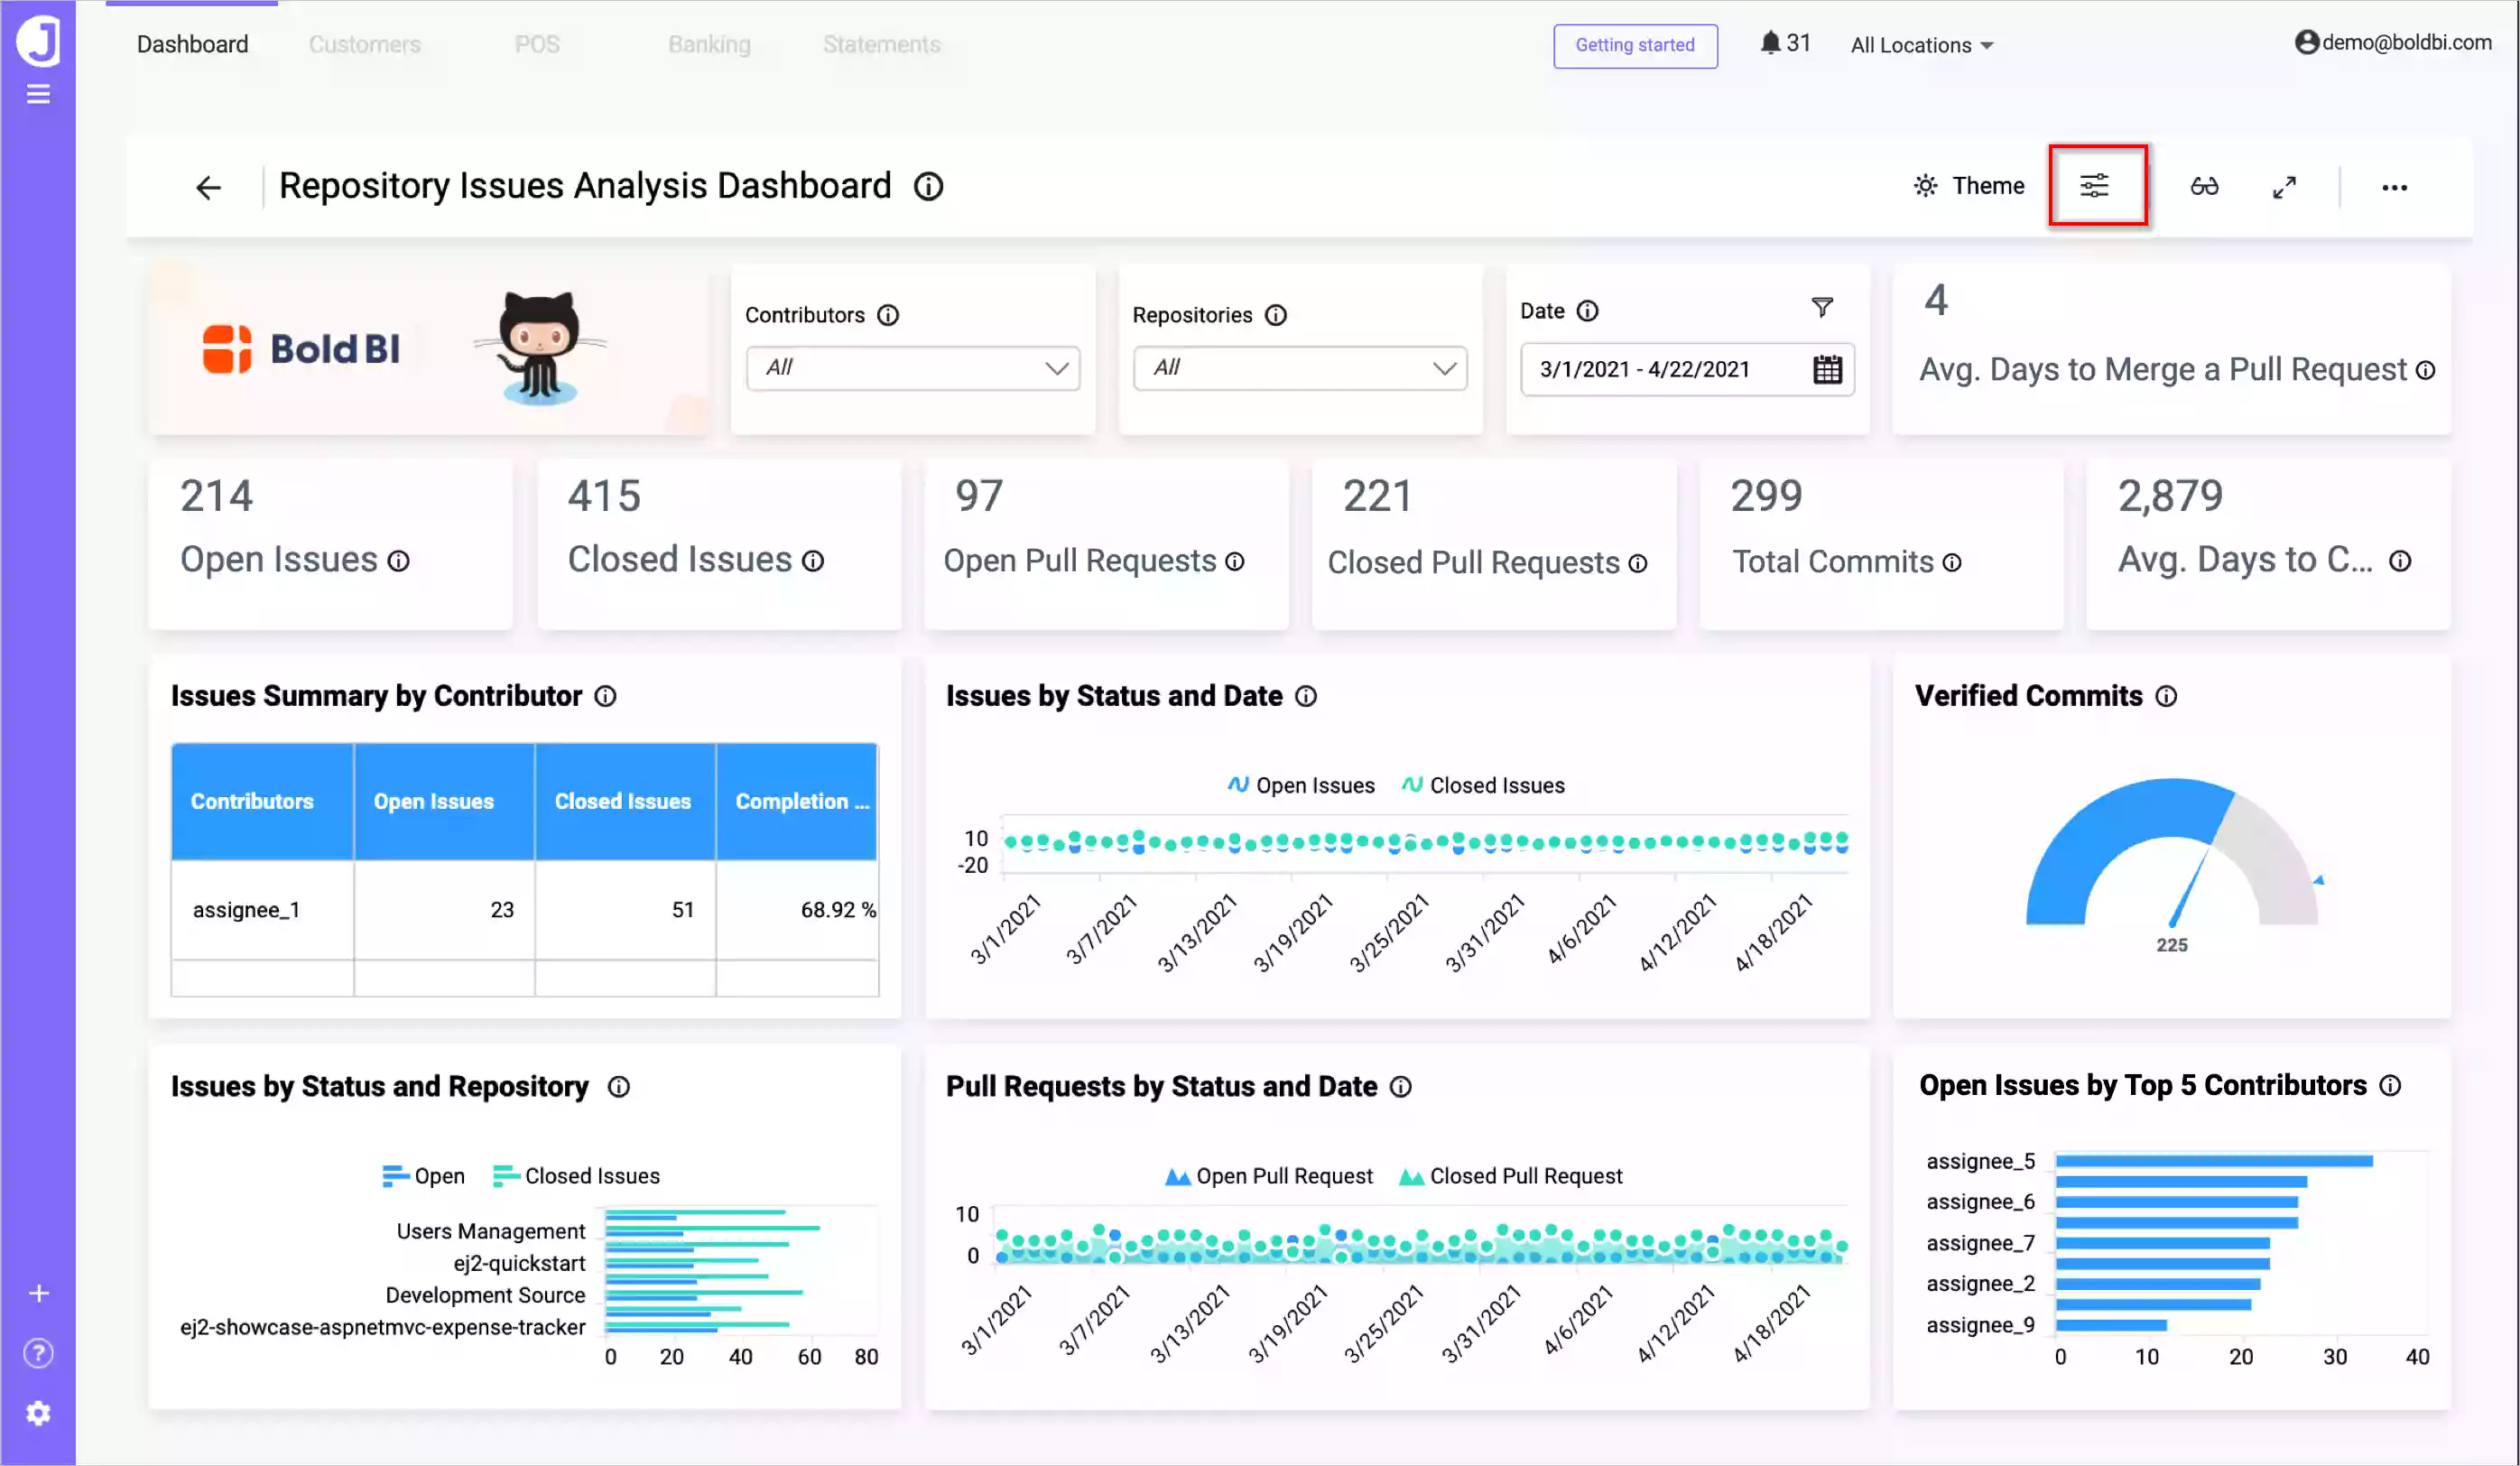
In the previous dashboard, the repository name was added in the dashboard parameter with list mode. Also, the dashboard parameter was passed in the API to fetch the pull request records from all repositories. You can change the parameter values dynamically by clicking the dashboard parameter icon on the top-right side of the dashboard.
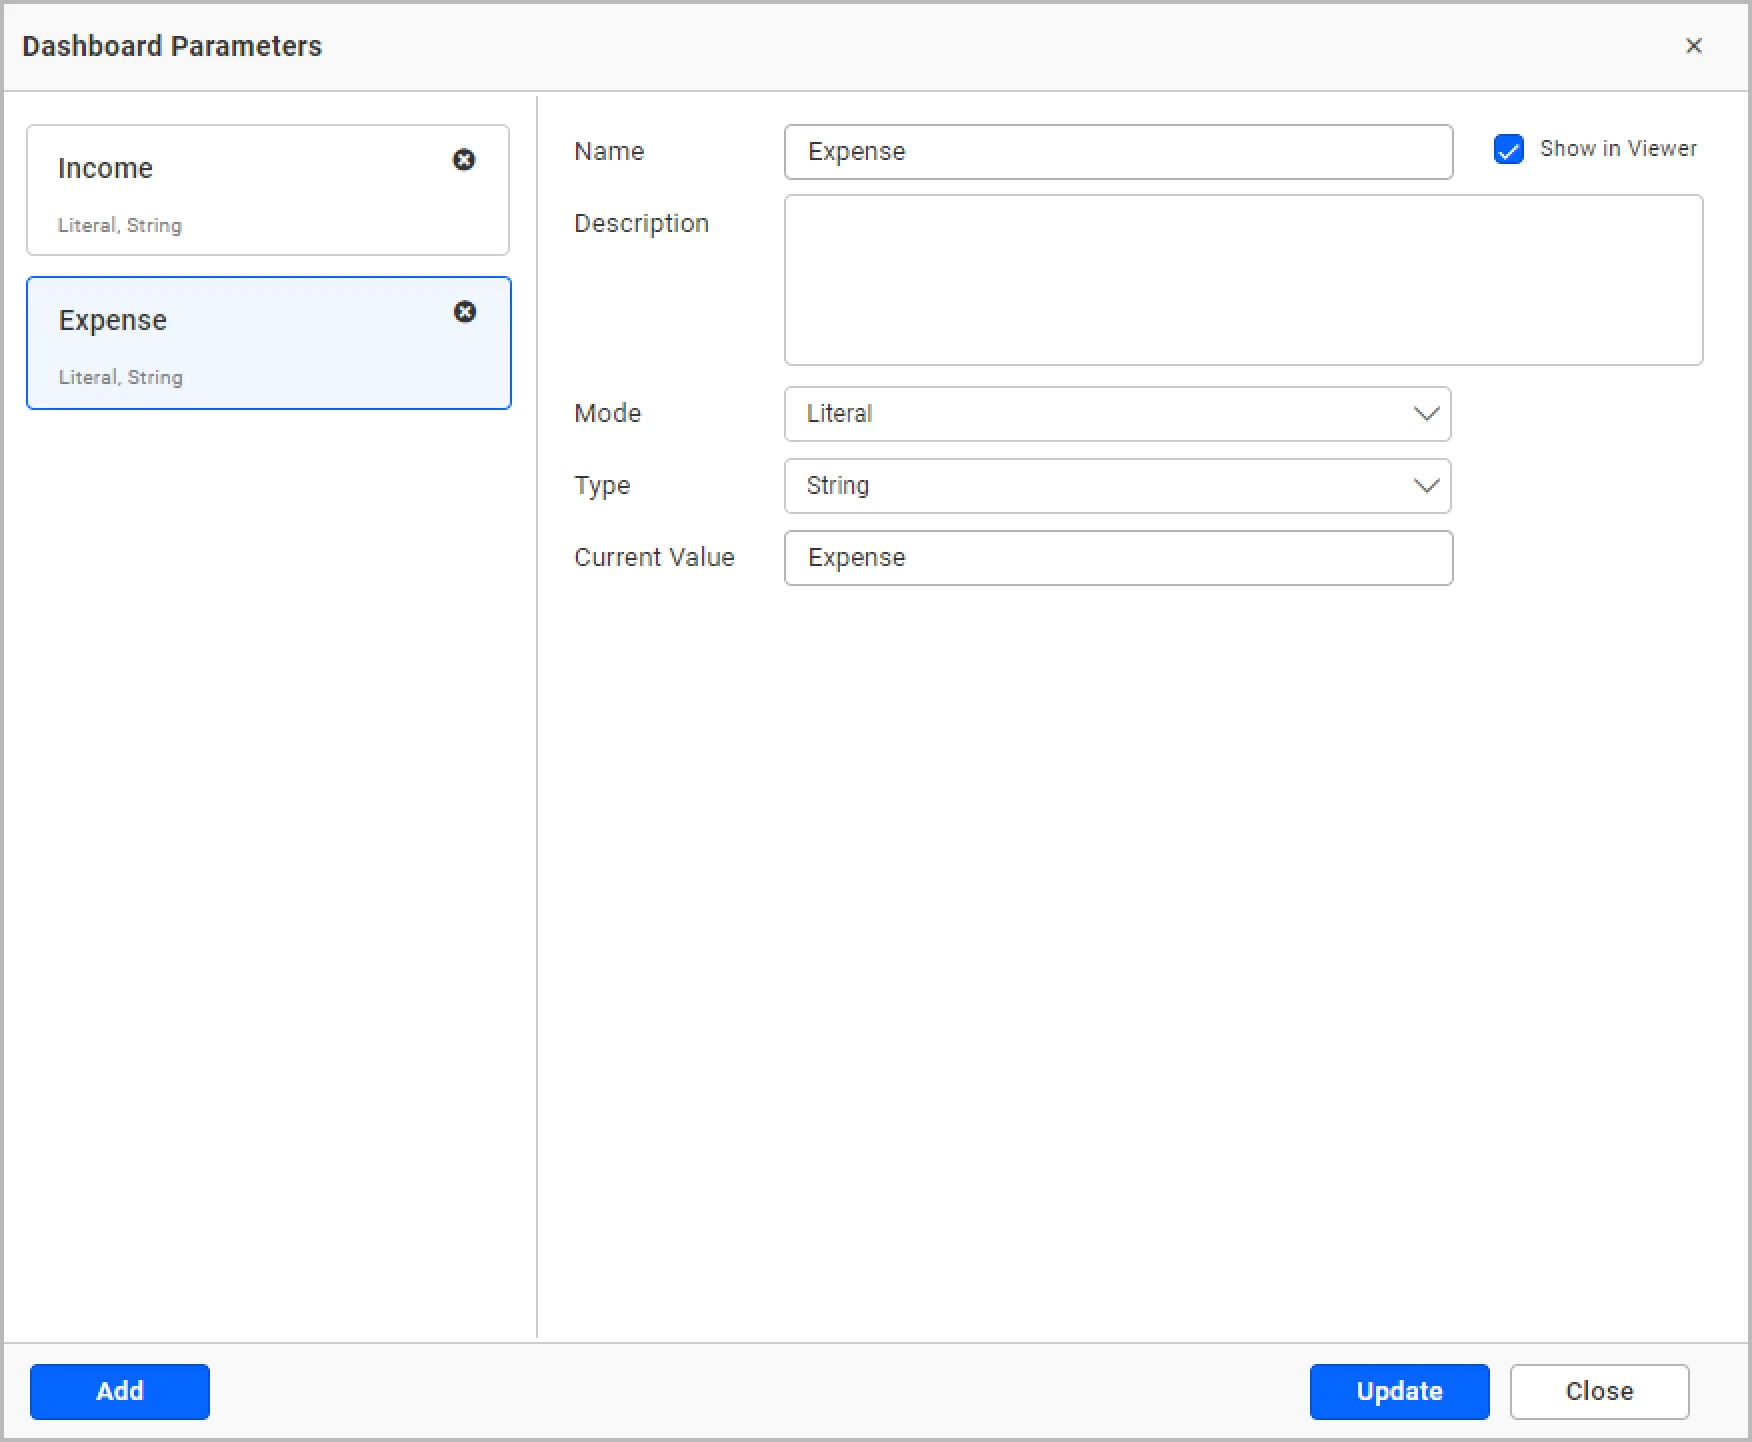
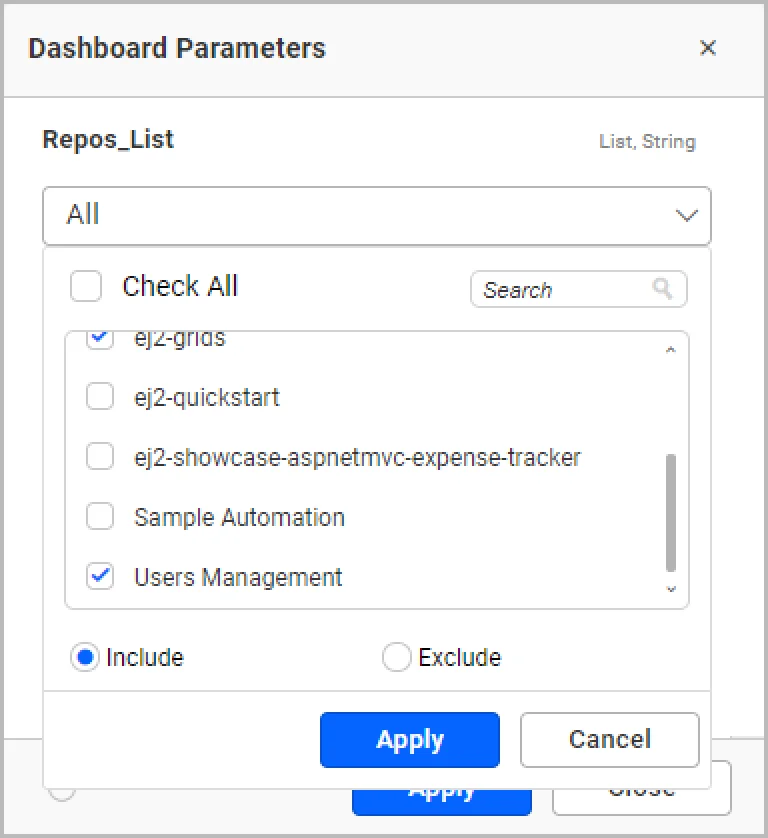
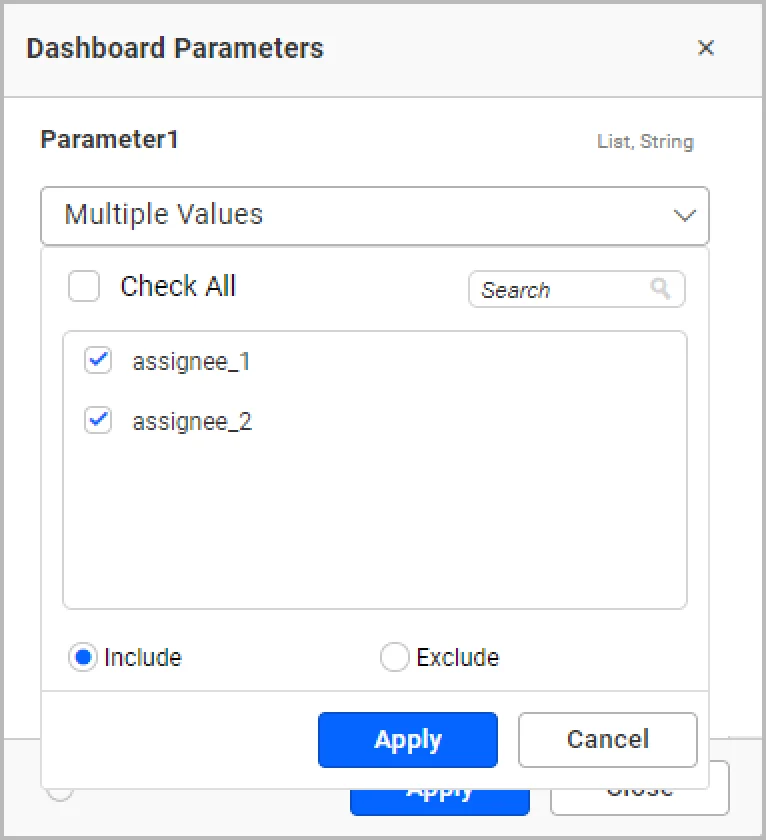
The dashboard parameter dialog will open with a list of added dashboard parameters. You can modify values for literal mode and include or exclude values for list mode as shown in the following screenshots.
When you have restricted access to data based on users and if you preview this dashboard as one of the users, you can see that the parameter shows only the values from this list can be chosen.
If you want to prevent users from accessing and modifying parameter values, you can go to the parameter window and clear the Show in Viewer option. Since we have removed that option for both parameters, a parameter option will not display in the viewer.
Refer to this documentation to learn how to change dynamic parameter values in URLs. You can also pass stored procedure parameters with URLs in a dashboard parameter: find more details here.
Conclusion
We hope you now have a better understanding of dashboard parameters and how to use them in data visualization to handle your data updates dynamically and maintain up-to-date dashboards. If you have any questions on dashboard parameters, please feel free to post them in the following comment section.
Get started with Bold BI® by signing up for a free trial and create more interactive business intelligence dashboards. If you have any questions on this blog, please feel free to post them in the following comment section. You can also contact us by submitting your questions through the Bold BI website or, if you already have an account, you can log in to submit your support question.


