

In my previous blog post, we briefly discussed website conversions, their traffic sources, and how to monitor them through one dashboard by integrating Google Analytics and Salesforce. This blog article focuses on tracking the Stripe payments made and due for the conversions recorded through Google Analytics. This adds more convenience for sales and marketing teams.
For online businesses, the primary objective is to get new users for your product through your website. Knowing the revenue figures for your site will let your marketing team and CEO identify the potential strengths and weaknesses of your landing pages and focus more on those to increase your conversion rates and revenue together. Stripe is a secure payment gateway to make and receive payments over the internet. It allows individuals and small to large businesses to use it. Let’s see how you can monitor online business revenue performance through a revenue performance dashboard integrating Google Analytics and Stripe data using Bold BI®.
KPIs for website conversions and revenue
The following KPIs are enough to track customer conversions and revenue:
- Visitors
- Leads
- Qualified leads
- Customer
- Bounce rate
- Monthly recurring revenue (MRR)
- Average revenue per customer
- Gross volume by channel
- Top five landing pages by revenue
- Annual recurring revenue (ARR)
- Lifetime value (LTV)
- Successful payment
- Gross volume
- Customer churn rate
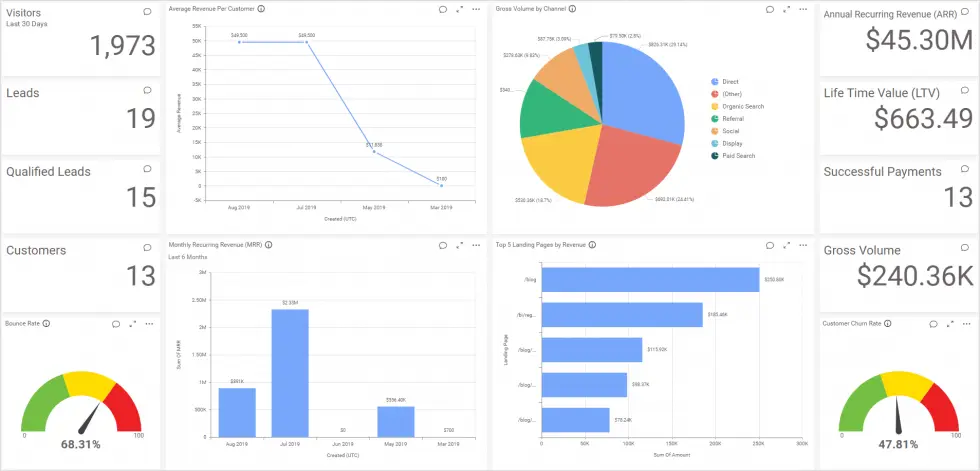
Now let’s start creating a revenue performance dashboard with these KPIs like the following.
Creating a revenue performance dashboard
- To create a new dashboard, click the + icon in the navigation bar on the left.


Add button - The Create Dashboard window opens with four options.


Templates view in Create Dashboard window - Choose Start from Scratch. A window opens to create a new dashboard.
- Enter a name and click Add and Design. Finally, the Dashboard Designer page opens with a new blank dashboard.
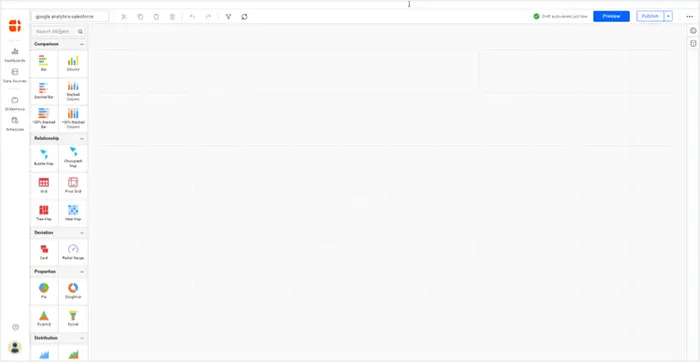

A blank dashboard in editing view
Now, let’s see how to prepare data using Bold BI to showcase these KPIs.
Connecting to Google Analytics and Stripe
Connect to Google Analytics and create a data source named Google Analytics – Channel with the following URL to get the campaign channel and landing page details.
https://www.googleapis.com/analytics/v3/data/ga?ids=ga%3A19544772134& start-date=2019-01-01&end-date=2019-08-26&metrics=ga%3AbounceRate%2Cga%3Apageviews%2Cga%3A pageviewsPerSession&dimensions=ga%3A landingPagePath%2Cga%3Adate%2Cga%3AchannelGrouping&max-results=10000
For more detail on establishing connections with Google Analytics, refer to this documentation.
Connect to Stripe and create a data source with appropriate APIs like following table.
| Data source Name | API |
| Stripe – Subscription | https://api.stripe.com/v1/subscriptions |
| Stripe – Payment | https://api.stripe.com/v1/payment_intents |
| Stripe – Balance (charges) | https://api.stripe.com/v1/charges |
| Stripe – Payouts | https://api.stripe.com/v1/payouts |
For more detail on establishing connections with Stripe, refer to this documentation.
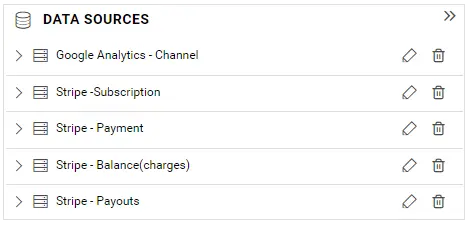
Finally, the created data sources will be added to the DATA SOURCES panel.
Integrating Google Analytics and Stripe data sources
To integrate the Google Analytics and Stripe data, you need to create a new data source by joining the already-created two data sources. Bold BI allows you to join tables in two or more different data sources, provided they were of extract mode connections. As Google Analytics and Stripe work in extract mode in Bold BI, let’s create a new data source joining table GA from the Google Analytics – Channel data source and payouts from Stripe – Payouts.
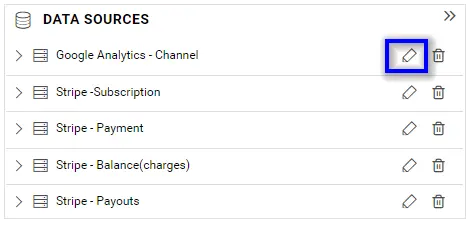
Click the edit icon near the Google Analytics – Channel data source item in the DATA SOURCES panel.
Now, the editing view of the data source opens. In the left panel, the Shared Tables pane remains collapsed at the bottom.
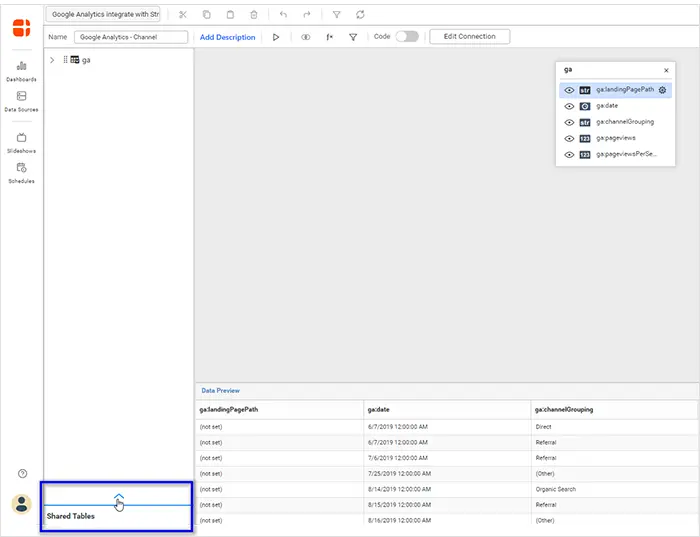
Finally, this pane displays the data sources that you have permission to access. By default, the data sources you created before for this or any other dashboard will be listed here.
Before joining the table, create an expression column named Converted-Arrival Date with following expression in the Stripe – Payouts data source. This is to convert the Unix-time-formatted date column to normal date format.
DATEADD(day,((([arrival_date]/60)/60)/24),‘1970-01-01’)
Joining the shared tables
To combine data from multiple data sources, follow the steps below.
- First, choose the data source whose table needs to be joined. In our case, the Stripe – Payouts data source needs to be selected. Subsequently, expand it.
- After that, drag the payouts table into the design view.
- Select the Join icon in the toolbar of the table design view to open the join editor.
- Create a relationship between the two tables through the Date and Converted-Arrival Date
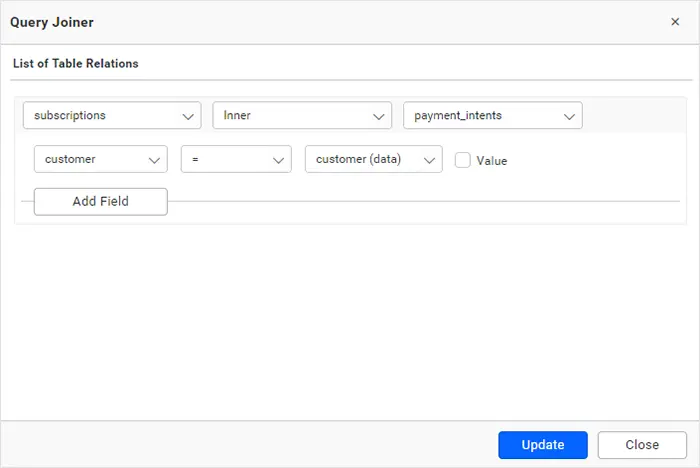
Then, create a new data source joining the table subscriptions from the Stripe – Subscription data source and payments from Stripe – Payments and create a relationship between the two tables through customer, as shown in the following.
Create an expression column in the Stripe – Subscription data source to calculate fields as shown in the following table.
| Expression Name | Function |
| Leads | IF([status]=‘trialing’ AND [status (data)]=’null’,1,0) |
| Qualified Leads | IF([status]=‘Incomplete’ AND [status (data)]=’Pending’,1,0) |
| Customers | IF([status]=‘active’ AND [status (data)]=’succeeded’,1,0) |
| MRR | IF([status]=‘active’,[amount (data_items_data_plan)],0) |
| Active Customer | IF([status]=‘active’,1,0) |
| Average Revenue | SUM([MRR])/SUM([Active customer]) |
| Cancelled Customer | IF([status]=‘canceled’,1,0) |
| New Customer | IF([status]=‘trialing’ ,1,0) |
| Customer Churn Rate | SUM([Cancelled Customer])/SUM([Active customer])+ SUM([New customer]) |
| LTV | [Average Revenue]/[Customer Churn Rate] |
| ARR | SUM([MRR])*12 |
Similarly, create an expression in the Stripe – Payment data source to calculate Successful payment as shown in the following expression.
IF([status (data)]=‘succeeded’,1,0)
Finally, the combined data sources from Google analytics and stripe are ready to configure with dashboard widgets.
Configuring data to the widgets in a dashboard
- Add the required widgets to the blank dashboard that you created in the beginning.
- Configure the widgets in the dashboard with their corresponding data sources, as described in the following table.
| Widget Title | Configuration |
| Visitors | Type: Card Data source: Google Analytics – Channel Actual Value: Page/session |
| Leads | Type: Card Data source: Stripe – Subscription Actual Value: Leads |
| Qualified leads | Type: Card Data source: Stripe – Subscription Actual Value: Qualified Leads |
| Customer | Type: Card Data source: Stripe – Subscription Actual Value: Customers |
| Monthly recurring revenue (MRR) | Type: Column chart Data source: Stripe – Subscription Value(s): MRR Column(s): Converted Date |
| Average revenue per customer | Type: Line chart Data source: Stripe – Subscription Value(s): Average Revenue Column(s): Converted Date |
| Gross volume by channel | Type: Pie Chart Data source: Google Analytics – Channel Value(s): Amount Column(s): Channel |
| Bounce rate | Type: Gauge Data source: Google Analytics – Channel Actual Value: Bounce rate |
| Top 5 landing pages by revenue | Type: Bar chart Data source: Google Analytics – Channel Value(s): Amount Column(s): Landing page |
| Annual recurring revenue (ARR) | Type: Card Data source: Stripe – Subscription Actual Value: ARR |
| Lifetime value (LTV) | Type: Card Data source: Stripe – Subscription Actual Value: LTV |
| Successful payment | Type: Card Data source: Stripe – Payment Actual Value: Successful payment |
| Gross volume | Type: Card Data source: Stripe – Balance Actual Value: Amount |
| Customer churn rate | Type: Gauge Data source: Stripe – Subscription Actual Value: Customer churn rate |
Finally, the dashboard is ready. Now you can share this revenue performance dashboard with your sales team by enabling access permission to it. Then simply copy the URL from the address bar and share it. Refer to this overview for more detail on sharing dashboards.
Conclusion
We hope this article helps you monitor online business revenue performance with the integrated data from Google Analytics and Stripe through a dashboard using Bold BI®. If you have any questions on this blog, please feel free to post them in the following comment section. Get started with Bold BI by signing up for a free trial and create more interactive business intelligence dashboards. You can also contact us by submitting your questions through the Bold BI website or, if you already have an account, you can log in to submit your support question.