

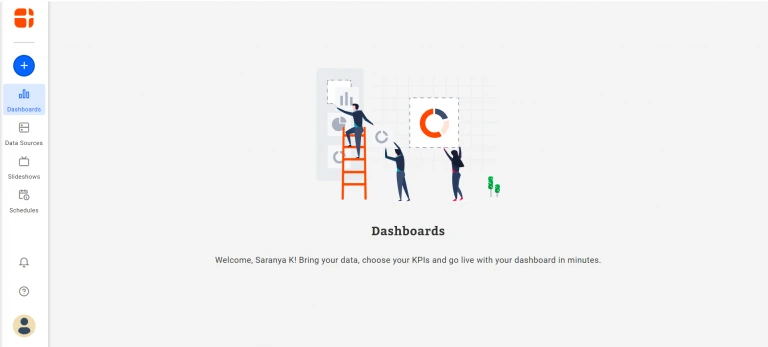
Campaigns play a vital role in promoting a product to customers. Marketing campaigns are not limited to only advertisement. They can be in many forms, such as promotional emails and partnership programs. To monitor campaign performance, you need to have the performance metric defined with benchmarks and targets. This article will walk you through the steps to measure an email campaign’s performance through connecting your Mailchimp and Salesforce CRM data with the Bold BI Dashboards. If you are new to Bold BI, sign up for a free 30-day trial on our website. At the end of the registration process, you will reach the following page view.
What is Mailchimp?
Mailchimp is a marketing platform for growing businesses. It lets you create sophisticated campaigns and gather insights on your successful ones for your next move. Mailchimp gives you the tools to create emails, Facebook ads, Instagram ads, landing pages, Google remarketing ads, signup forms, postcards and to automate your work. Mailchimp also works with e-commerce solutions and web services.
What is Salesforce?
Salesforce is a customer relationship management (CRM) platform. It offers individual CRM applications for sales, service, marketing, and more that can be setup and managed even by non-technical end users. Both small businesses and large-scale enterprises can easily use Salesforce CRM.
How Mailchimp and Salesforce data can be linked
The Email Campaign created in Mailchimp gives you details about the list of members targeted through promotional emails. Also, it helps to identify interested subscribers through the activity data like the number of opens. Marketing people can then convert these qualified leads into contacts, accounts, and opportunities in Salesforce CRM.
Defining metrics to showcase campaign performance
In this blog post, we will be looking at email campaigns and monitoring each of their performances by the lead conversion rate. We will look at the following metrics:
- Mail recipients
- Opens
- Clicks
- Open rate
- Click rate
- Bounces
- Top lead sources
- Leads conversion
- Campaign revenue
- Revenue won
Getting Mailchimp data
Through Mailchimp API 3.0, get the email campaign statistics such as open rate, click rate, and subscriber contacts to estimate the possible conversions. Also, to enable the connection with your Mailchimp account, your username and API key are needed. Furthermore, for API key generation, your account should have an admin or manager role. After that, generate the API key. Therefore, the REST API endpoints needed to get the Mailchimp data are available at https://usX.api.mailchimp.com/3.0/ where, usX should be the last part of your Mailchimp API key.
| Endpoint | Used for | Endpoint URL Example |
| GET /campaigns | Get all campaigns and their results. | https://us6.api.mailchimp.com/3.0/campaigns |
Firstly, create a data source with this connection endpoint in Bold BI Dashboards. Consequently, this gives you the Mailchimp campaign data required to find the leads and convert them into contacts, accounts and opportunities.
Getting Salesforce data
Further, the next step is to create contacts and leads in Salesforce CRM for marketing people. Certainly, this is needed to estimate the campaign performance with converted leads and opportunities. Note: Assuming the subscribers with the most opens had been considered as criteria for Salesforce CRM entry. Also, that the campaign names are the same in both the Salesforce CRM and Mailchimp campaigns. Also, to enable the connection with your Salesforce account, your username and password are required. Hence, the Salesforce data can be fetched using the SOQL query. The following table showcases the required tables and fields needed to prepare data for the dashboard.
| Table | Fields |
| CampaignMember |
|
| Campaign |
|
| Lead |
|
| Opportunity |
|
Creating a dashboard and data sources
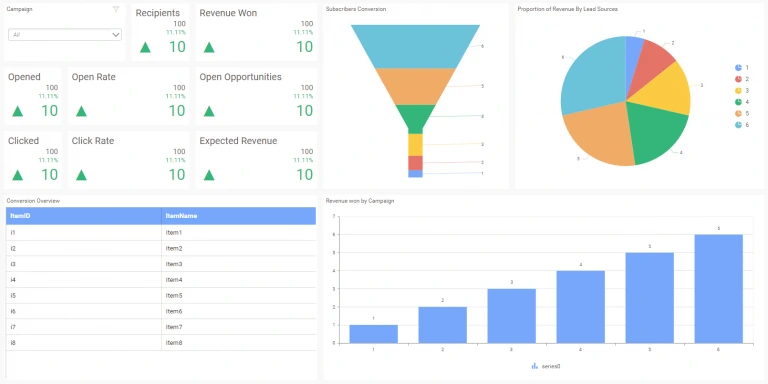
First, decide the dashboard layout and the widgets needed to visualize the planned views. Consider the following dashboard layout with the required widgets to showcase the campaign performance.
Creating a new blank dashboard
- To create a new dashboard, select the New Dashboard tile in the homepage of the Bold BI Dashboards.
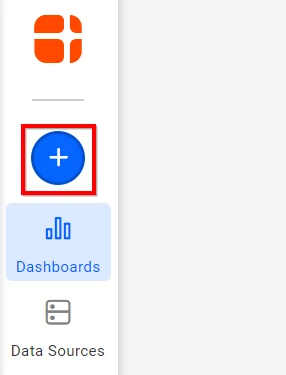

New dashboard tile in homepage - As a result, the Create Dashboard window opens with four options.
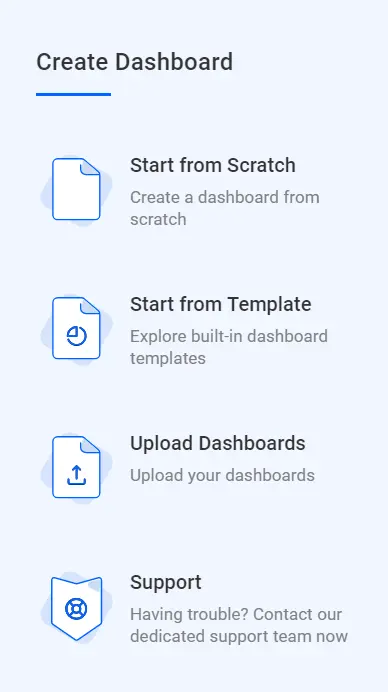

Templates view in Create Dashboard window - Choose Start from Scratch. Finally, the Dashboard Designer page opens with a new blank dashboard created.
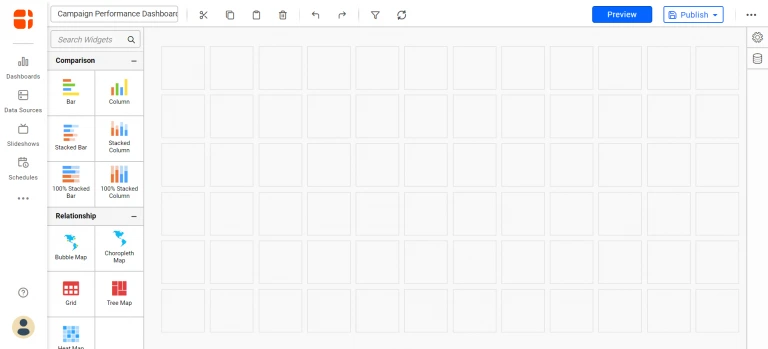

A blank dashboard
Connecting to Mailchimp
- First, select the data source icon at the right. Consequently, the data source panel expands as shown in the following.
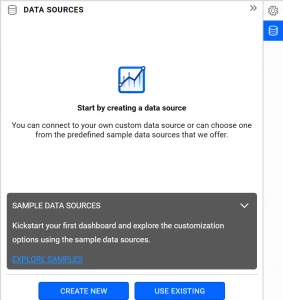

An empty data source panel - Further, select CREATE NEW in the previous panel. Consequently, the list of data connectors will be shown.
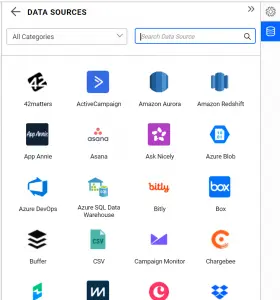

Supported data connections - Likewise, in the Categories drop-down list at the top, choose the category Email Campaign.
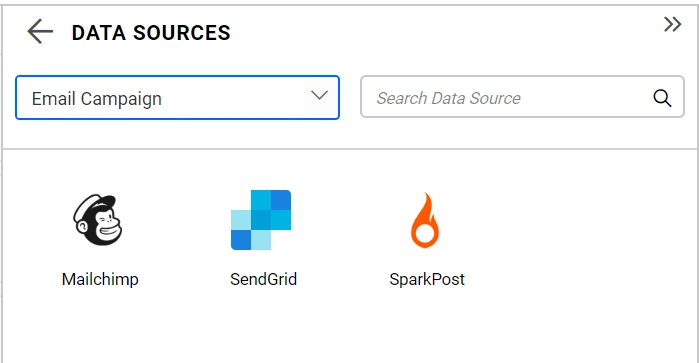

Supported data connections under Email Campaign category - Choose the Mailchimp connector. As a result, the Mailchimp data connection window will be displayed in the panel.
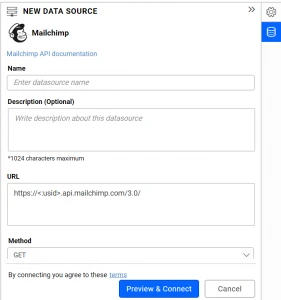

Default view of Mailchimp data source window
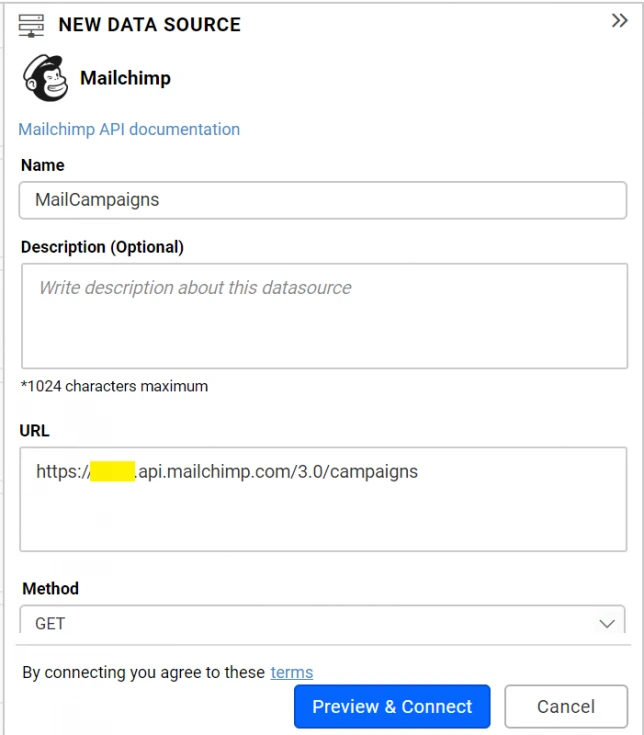
Creating a Mailchimp data source
- Firstly, name the data source MailCampaigns.
- Also, in the URL section, fill the campaigns endpoint URL.
- Further, leave the default value GET selected under the Method section.
- Likewise, under Max Rows section, set the maximum number of rows to be fetched. The default is 10.
- Leave the Header(s) section empty, if you have your account username and API key to enter. Otherwise, add the authorization header with the corresponding value like in the following. Also, set the Authentication Type to None.
Header Value Authorization apikey {your_api_key} 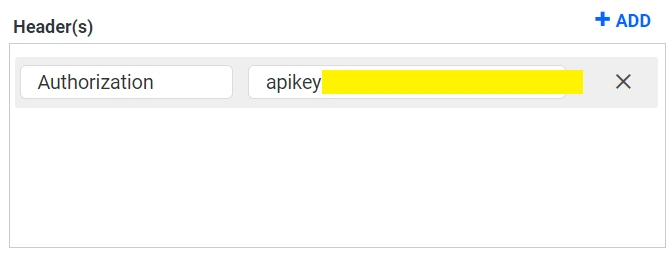

Authorization header configuration for Mailchimp data connection - After that, define the refresh settings with the interval. As a result, the dashboard can refresh itself with the latest data updates.
- Let the Data Format be JSON since the Mailchimp API endpoint returns result in JSON format.
- In addition, if the Authentication Type is set to Basic Http Authentication, enter the user name and API key in the corresponding fields.

Configuring Mailchimp data source window - Click Preview & Connect. As a result, a window opens listing the data results, categorized into a table and columns.
- Choose the desired columns. After that, click Connect. Consequently, the data source with the selected table and columns is created.
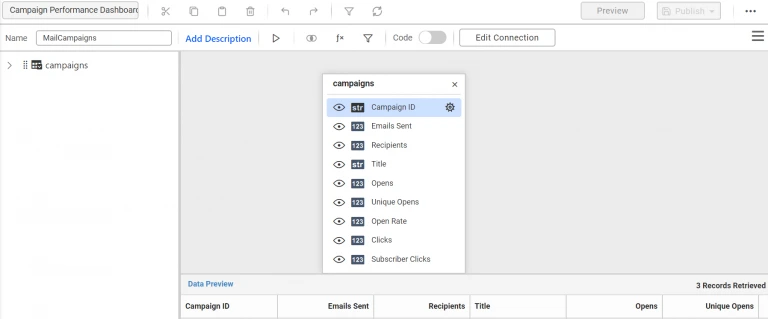

Editing view of Mailchimp data source. - Also, drag and drop the table into the editing window.
- Furthermore, click Save to save the data source.
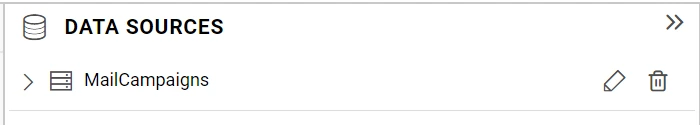
Finally, the data source has been created. The data sources panel lists the created data source like in the following.
Connecting to Salesforce
- First, select CREATE NEW in the DATA SOURCES panel. Consequently, it will display the list of data connectors.
- Furthermore, in the Categories drop-down list at the top, choose the category Sales & CRM.
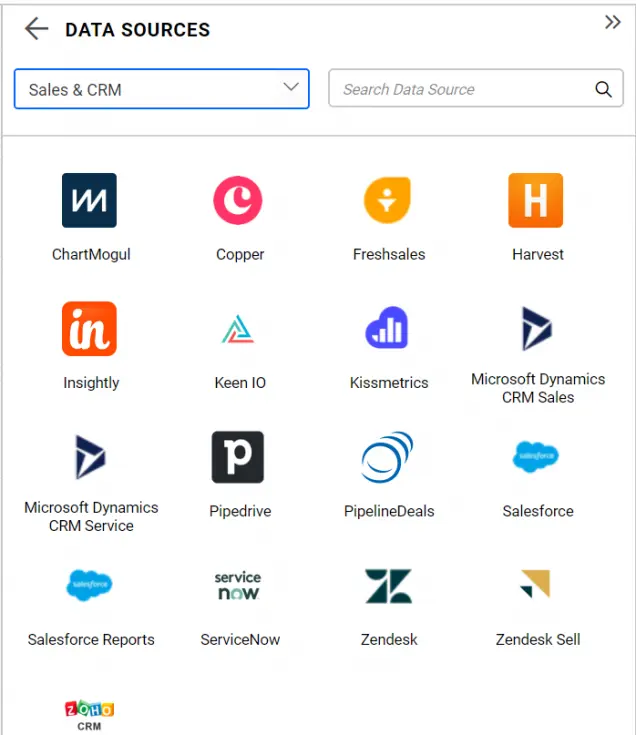

Supported data connections under Sales and CRM category - Choose the Salesforce connector. As a result, the Accounts window will be displayed to connect to your Salesforce account. Once the account details are configured, click Continue.
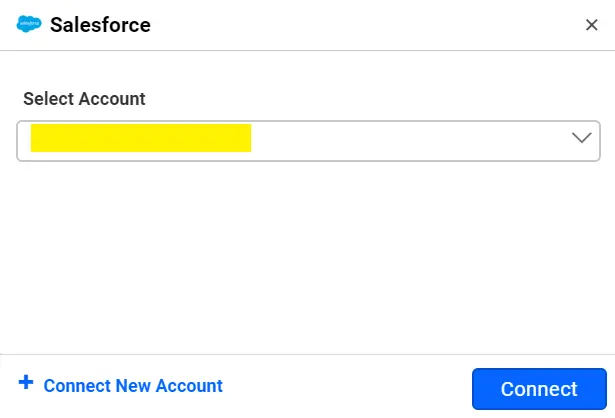

Salesforce Accounts Window
Finally, the Salesforce data connection window will be displayed in the panel.
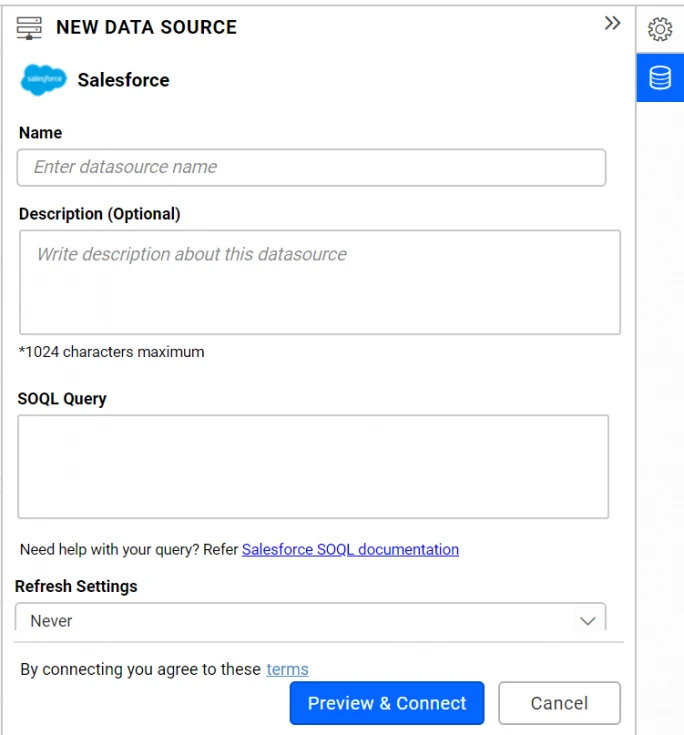
Creating Salesforce data sources
For this blog post, create four data sources from the Salesforce connection. Their names and the SOQL queries are as listed in the following table.
| Data source Name | SOQL Query |
| SalesforceCampaigns | SELECT Id, Name, NumberOfLeads, NumberOfConvertedLeads, NumberOfOpportunities, NumberOfWonOpportunities FROM Campaign |
| SalesforceCampaignMember | SELECT Id, CampaignId, LeadId FROM CampaignMember |
| CampaignOpportunities | SELECT Id, Name, StageName, Amount, LeadSource, IsWon, IsClosed, CampaignId FROM Opportunity WHERE CampaignId in (SELECT Id FROM Campaign) |
| CampaignLeads | SELECT Id, LastName, FirstName, Company, Country, Email, LeadSource, IsConverted, ConvertedOpportunityId, ConvertedDate, CreatedDate FROM Lead |
Finally, the created data sources will get added in the DATA SOURCES panel like in the following.
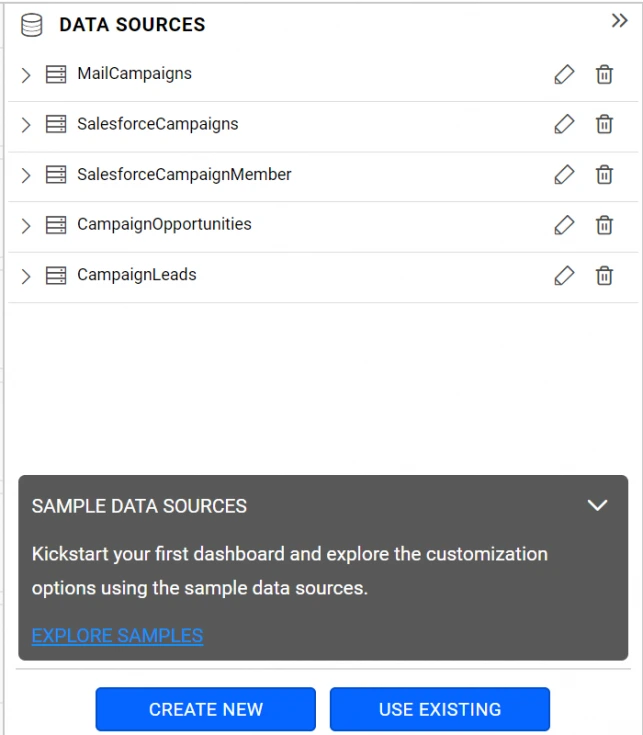
Let’s see how to combine data sources from salesforce and MailChimp using shared tables.
Shared tables
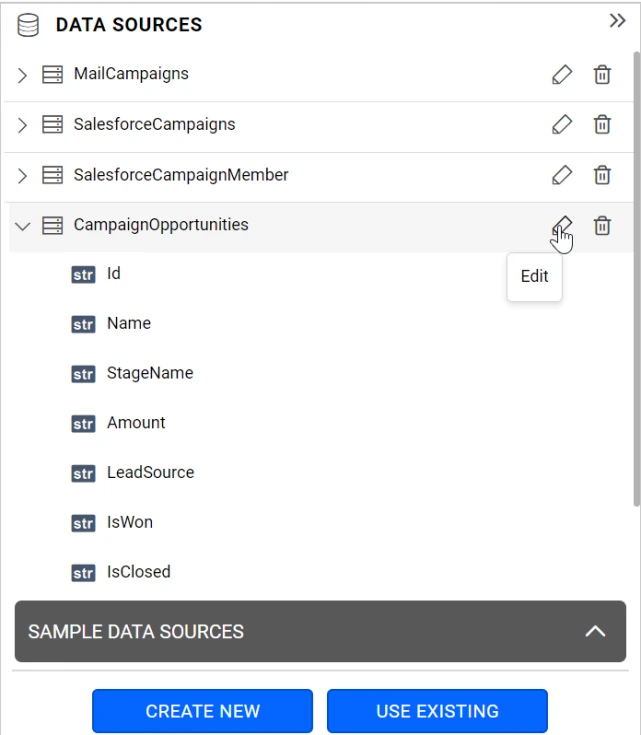
For conversion calculation and comparative analysis in a dashboard, you need to join some of these data sources. Therefore, the CampaignLeads data source holding the Lead table needs to be joined with two tables. One is the Campaign table of the SalesforceCampaigns data source and the other is the CampaignMember table of the SalesforceCampaignMember data source. This is needed to associate the campaign name for Lead table access. Similarly, the CampaignOpportunities data source holding the Opportunity table needs to be joined with the Campaign table of the SalesforceCampaigns data source. This is needed to associate the campaign name for Opportunity table access. Hence, click the edit icon near the CampaignOpportunities data source item added in the DATA SOURCES panel.
Now, the editing view of the data source opens. Consequently, in the left panel, the Shared Tables pane is collapsed at the bottom.
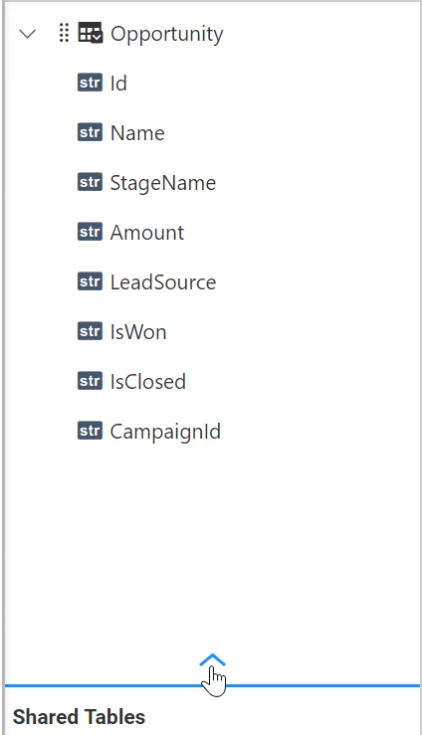
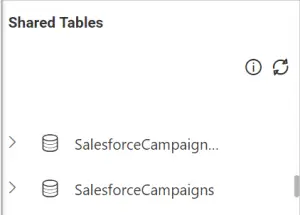
Finally, this pane displays the data sources that you have permission to access. By default, the data sources you created before for this or any other dashboard will be listed here.
Joining with shared tables
- First, choose the data source whose table need to be joined. In our case, the SalesforceCampaigns data source needs to be selected. After that, expand it.
- Further, drag and drop the Campaign table in the design view.
- Select the Join icon in the toolbar of the table design view to open the join editor.
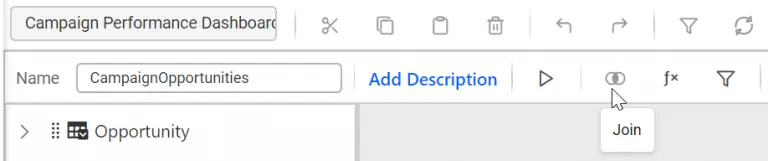

Opening join editor for table joining - Create a relationship between the two tables through the CampaignId column as shown in the following.
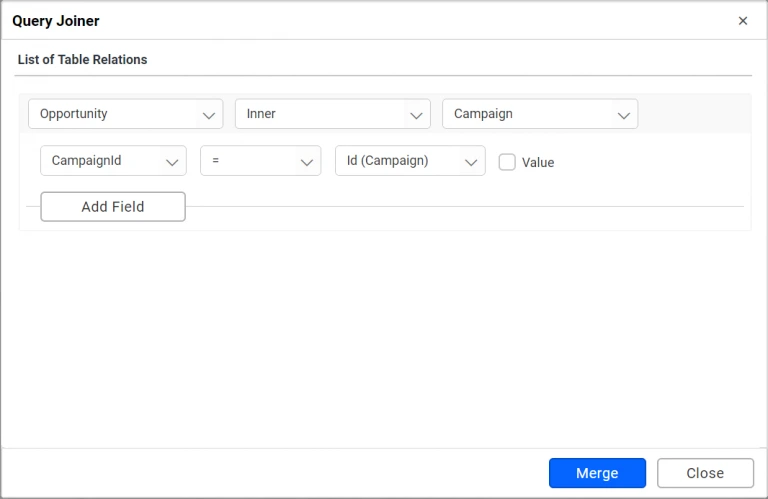

Join editor showing opportunity table relationships - Likewise, the same needs to be done for the CampaignLeads data source table joining shown in the following.
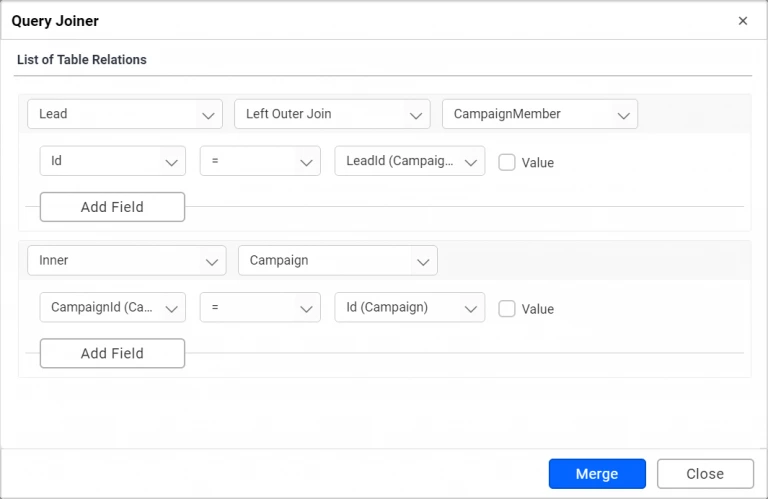
Join editor showing lead table relationships - Further, select the Expression icon in the toolbar of the table design view. Consequently, the expression editor opens.
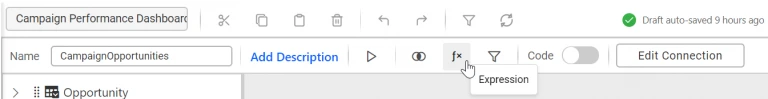

Opening expression editor in CampaignOpportunities data source view - Create three expression columns in the CampaignOpportunities data source with the following listed expressions.
Name Expression Open Opportunities IF([IsClosed]=’false’,1,0) Expected Revenue IF([IsClosed]=’false’,[Amount],0) Revenue Won IF([IsWon]=’true’,[Amount],0)
Finally, the combined data from multiple data sources are ready to configure with dashboard widgets.
Configuring widgets in dashboard
- First, configure the widgets in the dashboard with corresponding data sources as described in the following table.
Widget Data Configuration Campaign (Type: Combo Box) - Date source: MailCampaigns
- Column: Title
Recipients (Type: Card) - Data source: MailCampaigns
- Actual Value: Recipients
- Aggregation Type: Sum
Opened (Type: Card) - Data source: MailCampaigns
- Actual Value: Opens
- Aggregation Type: Sum
Clicked (Type: Card) - Data source: MailCampaigns
- Actual Value: Clicked
- Aggregation Type: Sum
Open Rate (Type: Card) - Data source: MailCampaigns
- Actual Value: Open Rate
- Aggregation Type: Avg
Click Rate (Type: Card) - Data source: MailCampaigns
- Actual Value: Click Rate
- Aggregation Type: Avg
Revenue Won (Type: Card) - Data source: CampaignOpportunities
- Actual Value: Revenue Won
- Aggregation Type: Sum
Open Opportunities (Type: Card) - Data source: CampaignOpportunities
- Actual Value: Open Opportunities
- Aggregation Type: Sum
Expected Revenue (Type: Card) - Data source: CampaignOpportunities
- Actual Value: Expected Revenue
- Aggregation Type: Sum
Subscribers Conversion (Type: Funnel Chart) - Data source: SalesforceCampaigns
- Value(s)
- NumberOfWonOpportunities
- NumberOfOpportunities
- NumberOfConvertedLeads
- NumberOfLeads
Proportion of Revenue by Lead Sources (Type: Pie Chart) - Data source: CampaignOpportunities
- Value(s): Revenue Won
- Column(s): Lead Source
Revenue won by Campaign (Type: Column Chart) - Data source: CampaignOpportunities
- Value(s): Revenue Won
- Column(s): Name
Conversion Overview (Type: Grid) - Data source: CampaignLeads
- Column
- Id
- FirstName
- LeadSource
- IsConvertedFirst, configure the widgets in the dashboard with corresponding data sources as described in the following table.
- After that, define the master-listener configuration to filter across the two different data sources like in the following.
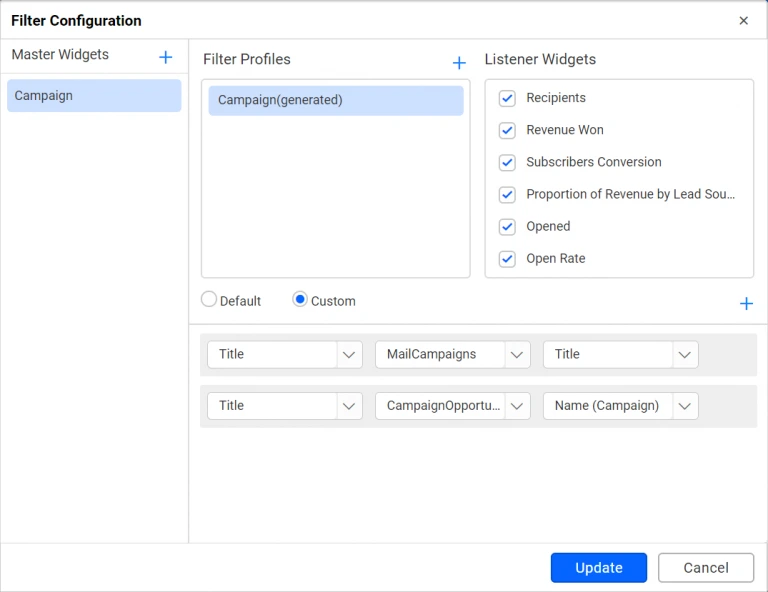

Dashboard filter window showing master-listener configuration - Also, set Campaign widget as master.
- Furthermore, make other widgets except Revenue won by Campaign widget as listeners to it.
Finally the dashboard is ready.
Sharing dashboard
You can share this dashboard with your marketing team to assess the campaign performance on the go. We hope this article helps you measure mail campaign performance with the statistical data of Mailchimp and Salesforce CRM. If you have any questions on this blog, please feel free to post them in the following comment section. Get started with Bold BI by signing up for a free 30-day trial and create more interactive business intelligence dashboards. You can also contact us by submitting your questions through the Bold BI website or, if you already have an account, you can log in to submit your support question.