

SendGrid offers a trusted email delivery service for marketing, transactional emails, and email campaign monitoring. This article will walk through the steps to connect your SendGrid account and explore, monitor and track email marketing statistics with Bold BI Dashboards, starting either from a blank dashboard or with the built-in SendGrid dashboard templates.
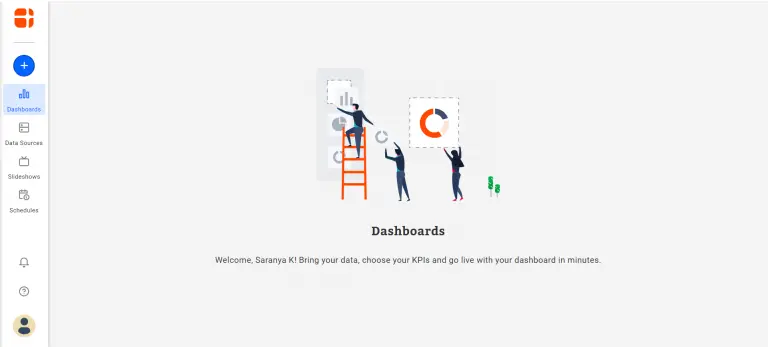
If you are new to Bold BI, sign up for a free 30-day trial on our website. At the end of the registration process, you will reach the following page view.
Getting SendGrid data
Before getting into the dashboard creation process, decide the metrics you require from the email stats and respective API endpoints. Through the SendGrid API, obtain the email stats and analyze them based on category, subuser, country, email client, mailbox provider and browser. Above all, be sure to acquire SendGrid API call returns response in JSON format.
To establish a connection with your SendGrid account, two different authentication modes are supported. Choose any one of these modes.
- Basic HTTP Authentication
- API Key
For Basic HTTP Authentication, just provide the username and password for your SendGrid account in the connection window.
For API Key, add an Authorization header passing API key as its value, such as Bearer {API Secret Key}.
Get the API key for your account. Above all, your API key should have specific permissions to access your preferred areas. For this walkthrough, the API key should have permission to access stats endpoints.
Here is a table illustrating the stats endpoints for reference.
| Endpoint | Used for | Endpoint URL Example |
| GET /stats | Retrieval of global email statistics between a given date range. | https://api.sendgrid.com/v3/stats?start_date=2018-11-01 |
| GET /geo/stats | Retrieval of email statistics based on country and state/province. | https://api.sendgrid.com/v3/geo/stats?start_date=2018-11-01 |
| GET /devices/stats | Retrieval of email statistics based on device type. | https://api.sendgrid.com/v3/devices/stats?start_date=2018-11-01 |
| GET /clients/stats | Retrieval of email statistics based on client type. | https://api.sendgrid.com/v3/clients/stats?start_date=2018-11-01 |
| GET /clients/{client_type}/stats | Retrieval of email statistics based on specific client type. | https://api.sendgrid.com/v3/clients/phone/stats?start_date=2018-11-01 |
| GET /mailbox_providers/stats | Retrieval of email statistics based on mailbox provider. | https://api.sendgrid.com/v3/mailbox_providers/stats?start_date=2018-11-01 |
| GET /browsers/stats | Retrieval of email statistics based on browser. | https://api.sendgrid.com/v3/browsers/stats?start_date=2018-11-01 |
Finally, you have all the metrics and the respective API URL endpoints in hand. These can be used to monitor and track the email stats. The next step is to create data sources using these API URL endpoints and design a SendGrid dashboard.
Creating dashboard using SendGrid data
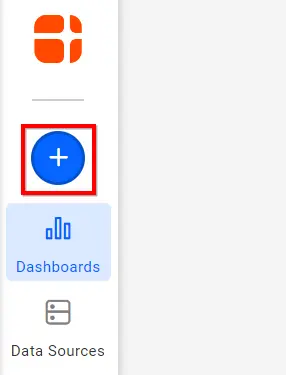
From the homepage of Bold BI Dashboards, navigate to and select the New Dashboard tile.
As a result, the Create Dashboard window opens with four options.
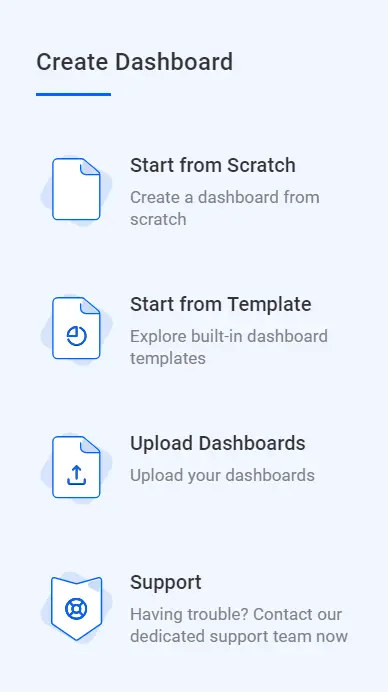
Click the option Start from Scratch and connect to your data.
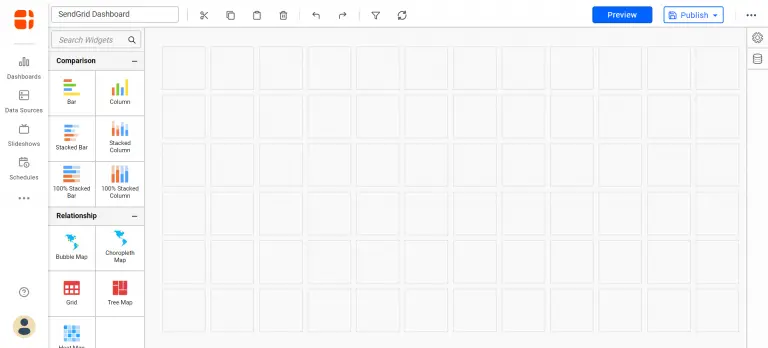
Choose Blank Dashboard. As a result, the dashboard designer page opens with a new blank dashboard created.
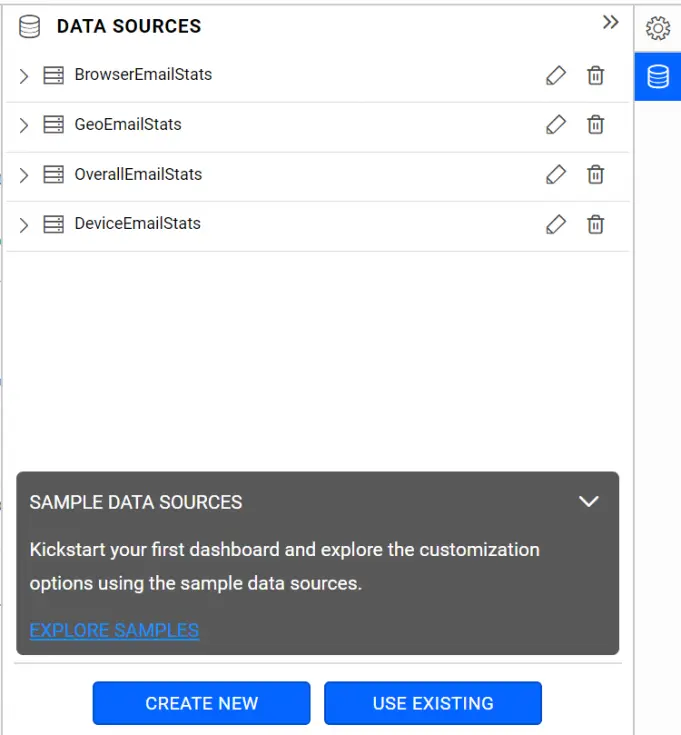
To create a new data source with SendGrid data, select the data source icon at the right. Consequently, this will expand the data source panel as shown below.
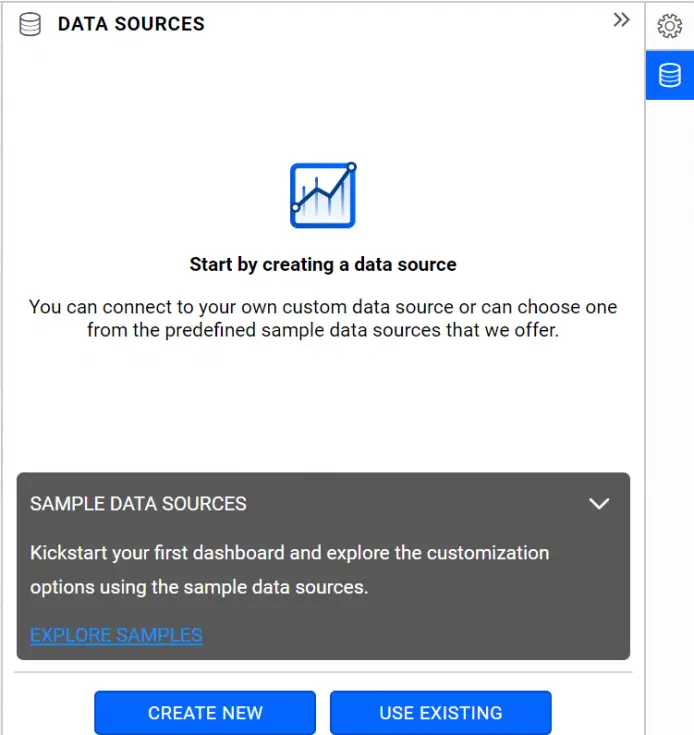
Select CREATE NEW in the above-mentioned panel. As a result, it shows the list of data connectors.
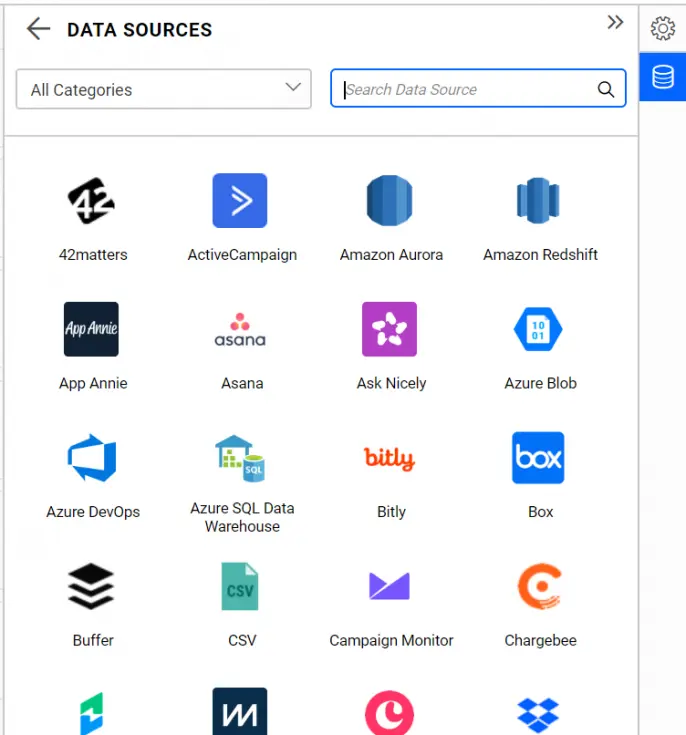
In the Categories dropdown list at top, choose the category as Email Campaign.
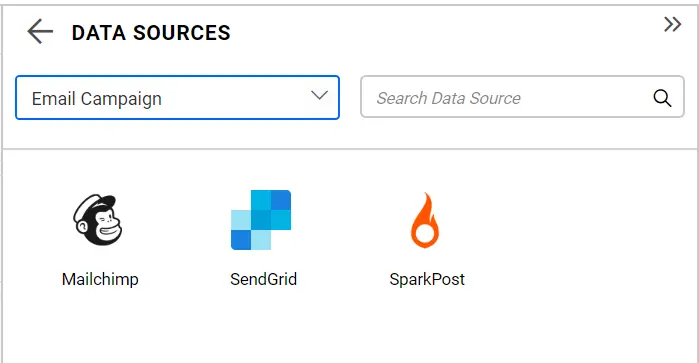
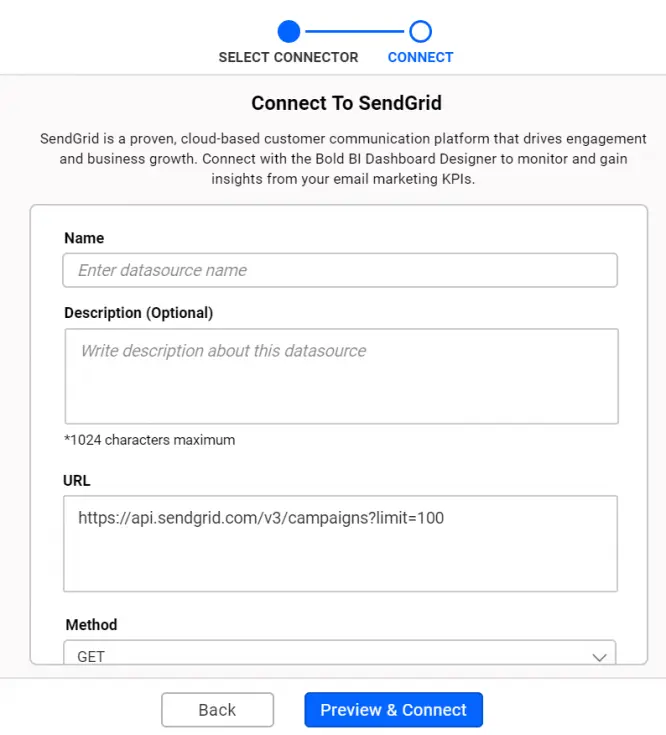
Finally, choose the Twilio SendGrid connector. Consequently, the SendGrid data connection window will be displayed in the panel.
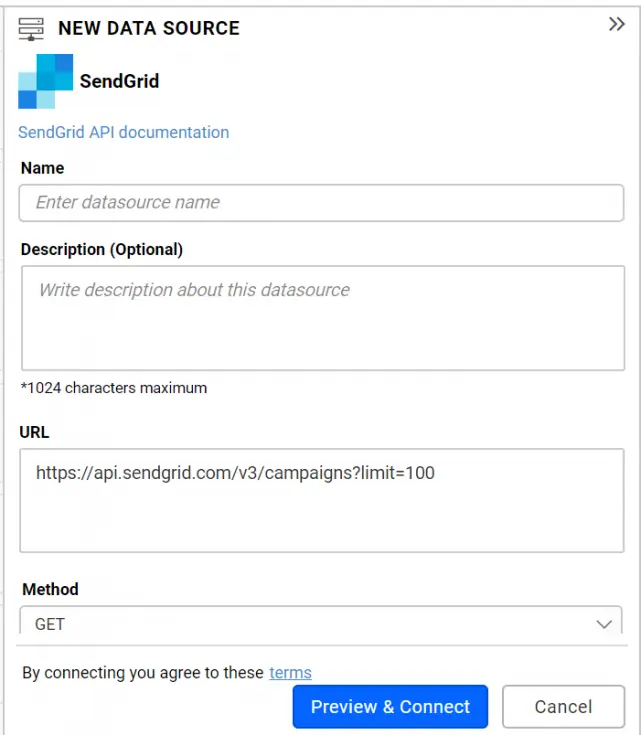
Configuring new data source
Name the data source BrowserEmailStats.
In the URL section, fill any of the Stats endpoint URL like, https://api.sendgrid.com/v3/browsers/stats?start_date=2018-11-01.
Leave the default value GET selected under the Method section as-is.
Clear the content under Header(s) section if you have your account username and password to enter.
Choose Authentication Type as Basic Http Authentication. Enter the correct username and password in their respective fields.
If you have API key with needed permissions, add Authorization as plain text header and its value as Bearer {API Key} as shown below. Set the Authentication Type to None.
Define the refresh settings with the interval. Based on this, the dashboard can refresh itself with latest data updates.
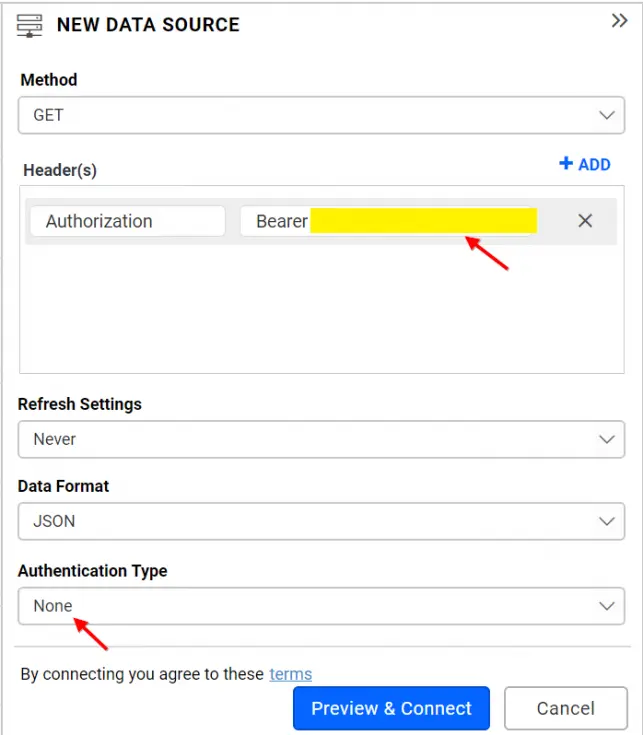
Click Preview & Connect. As a result, window prompts like the below screenshot will list the data results, categorized into table and columns.
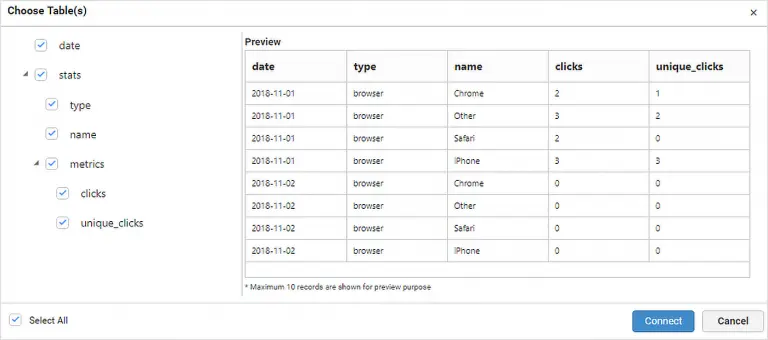
Choose the desired columns and click Connect. Consequently, the data source with selected table and columns is created.
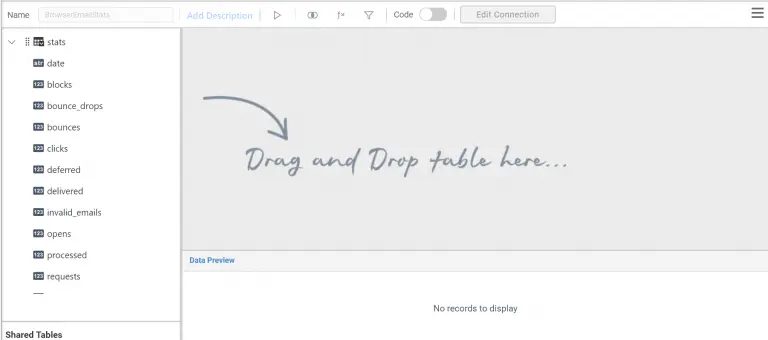
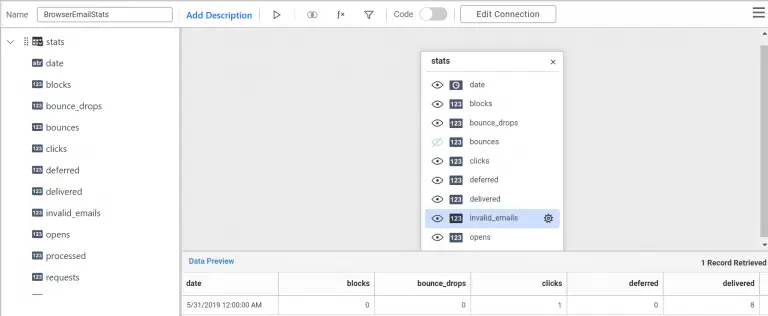
Drag and drop the table into the editing window. Perform required data modeling operations like column type conversion (for example, changing the date column from string type to date type) and column hiding (type column).
Finally, click Save to save the data source.
The data source has been created. You can also create data sources for other statistics with their respective endpoint URLs. Consequently, the data sources panel lists the created data sources.
You can start creating dashboards with the required widgets using the following links.
Adding a widget to design view
Configuring properties to widget
Finally, the end result of all of this a dashboard like the one shown below.

Start with data connected to a blank dashboard
You can also start creating data and then moving to a blank dashboard for designing.
In the homepage, click the data sources icon to create new data source as highlighted below.
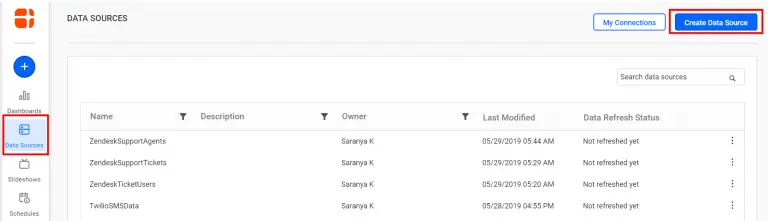
As a result, the Create Data Source window opens with the supported data connections list.
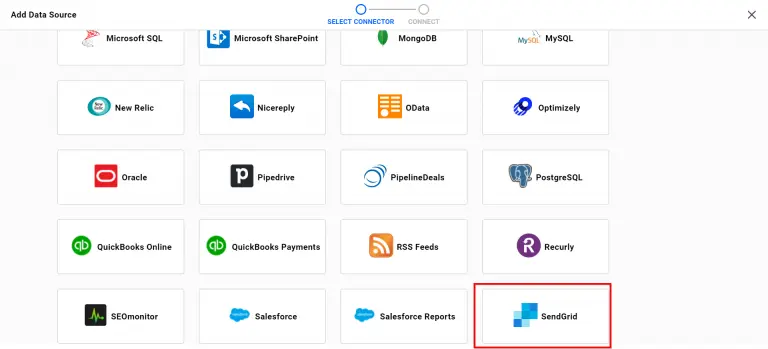
Choose the SendGrid connector. Consequently, the SendGrid data connection window will appear.
As described above, fill in the details. As a result, new data source will be created and a blank dashboard will open to be designed.
Start with a built-in SendGrid dashboard template and connect to your data
To create a new dashboard with a SendGrid dashboard template, navigate to the New Dashboard tile in the homepage.
Click Start from Template option to open the Dashboard Templates page.
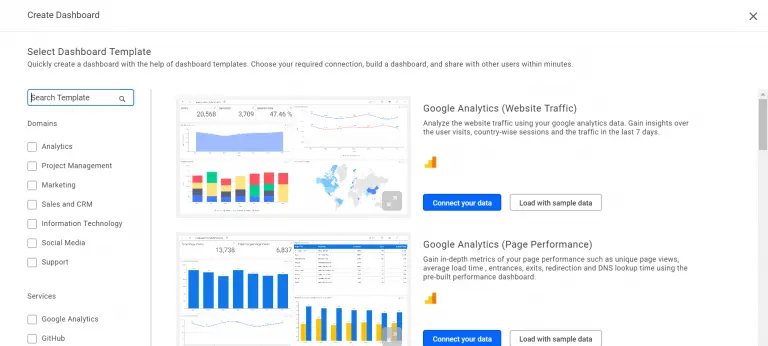
Search SendGrid in the Data Sources listing at left. Consequently, the SendGrid dashboard templates will be displayed at right.
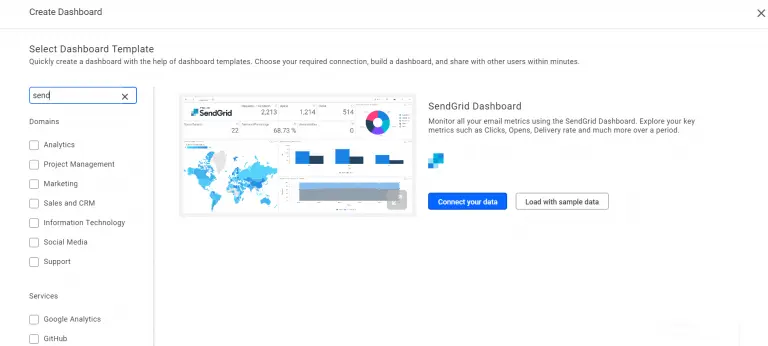
Choose the preferred template from the listing.
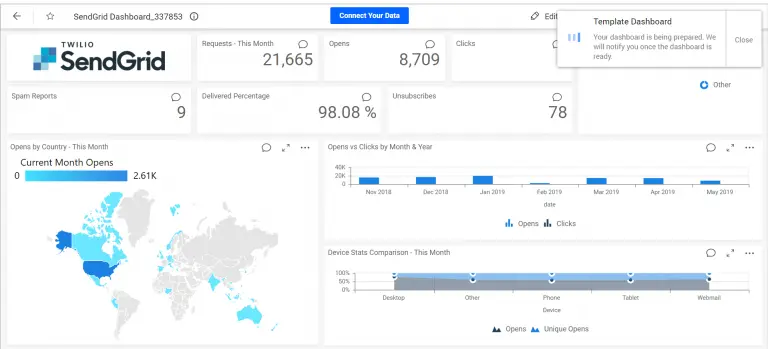
Furthermore, to preview the dashboard template, click Load with sample data.
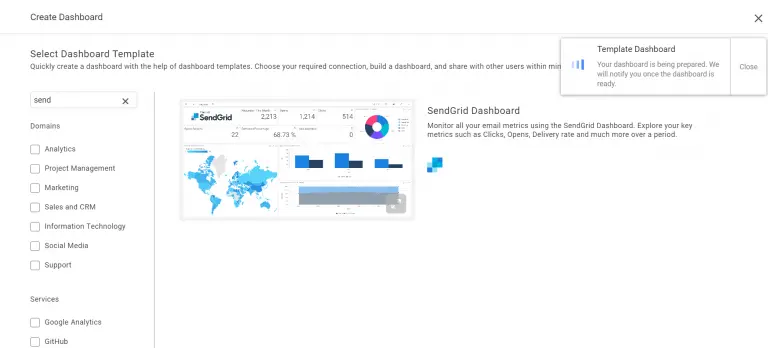
As a result, the SendGrid dashboard with sample data loads.

To visualize your own data, click Connect Your Data at top of the dashboard. As a result, the authorization window prompts you to provide your SendGrid account details. Most importantly, this is needed to authorize the connection to your SendGrid account from dashboard.
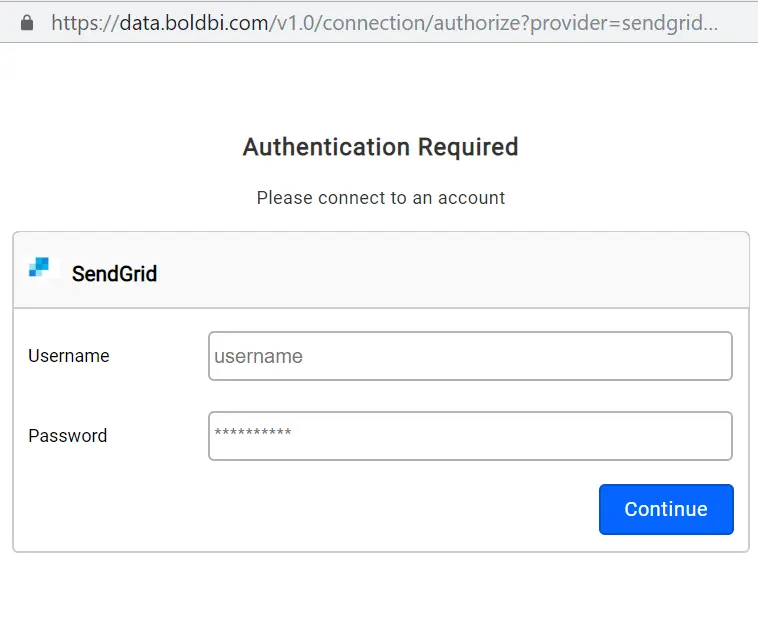
Enter the requested details and click Continue.
As a result, the SendGrid dashboard renders in the same page with your data.
Sharing dashboard
To share this dashboard with others, enable access permission to it for concerned users. You can copy the URL from address bar and share. Please refer for more details on sharing the dashboard. Also, look at this blog article to get a quick and complete overview of features available in Bold BI Dashboards.
Therefore, we hope this blog article helps you connect your SendGrid data with Bold BI Dashboards. You can monitor and track the email stats with ease. If you have any questions on this blog, please feel free to post them in the following comment section. Get started with Bold BI by signing up for a free 30-day trial and create more interactive business intelligence dashboards. You can also contact us by submitting your questions through the Bold BI website or, if you already have an account, you can log in to submit your support question.