
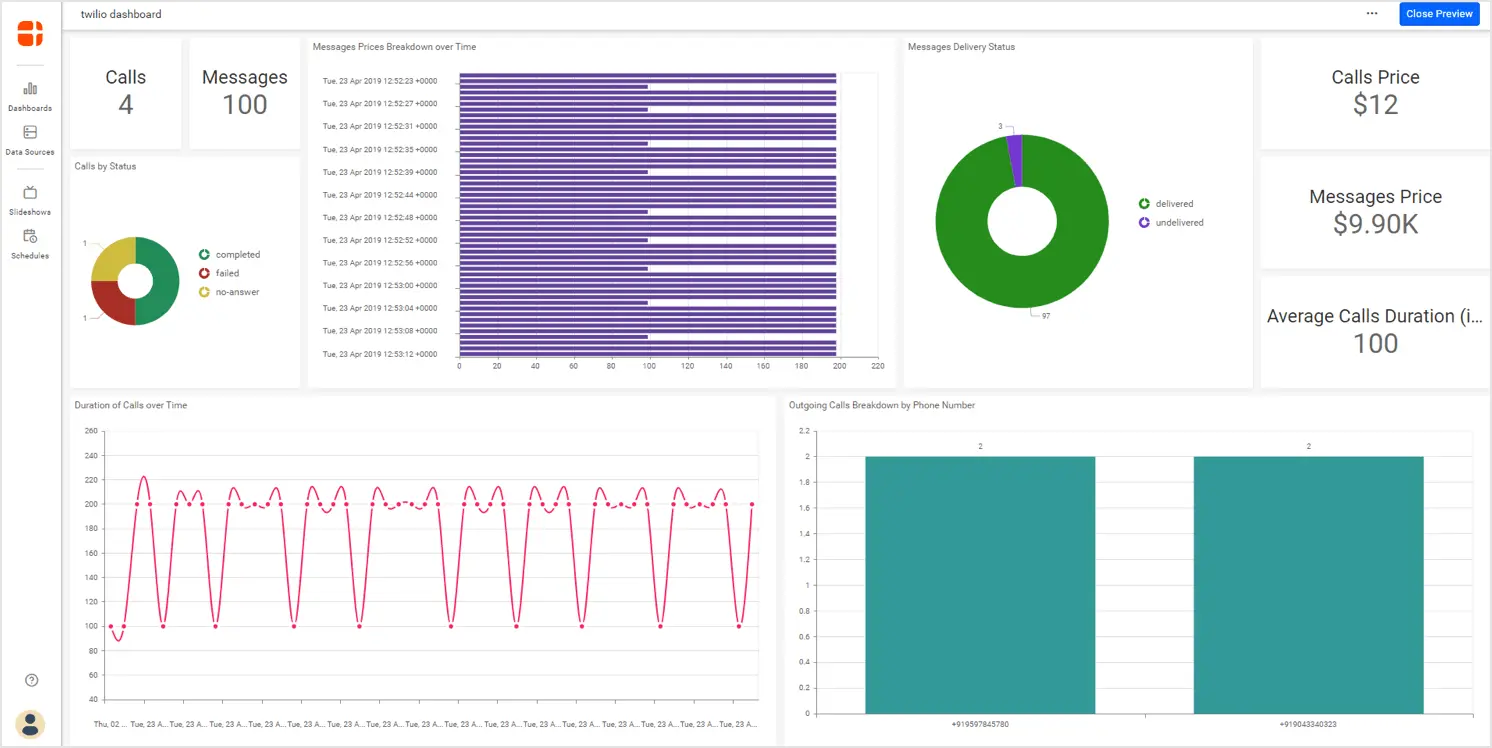
In this business world, secure and automated communication plays a vital role in success. Twilio offers a platform for this. This article will walk you through building an activity dashboard with your Twilio data with which your support team can track phone calls made and received, messages sent and received over time, and their costs using Bold BI Dashboards.
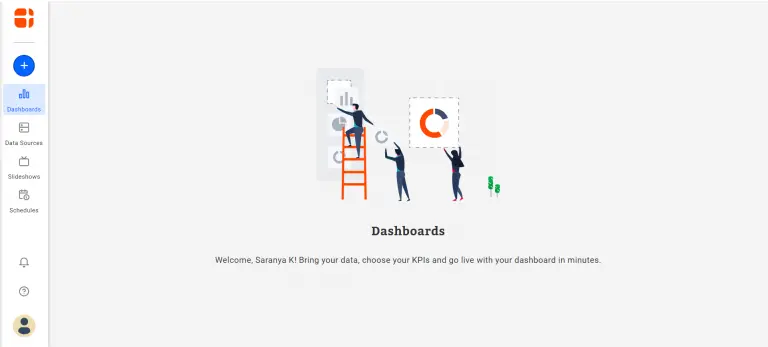
If you are new to Bold BI Dashboards, sign up for a free 30-day trial on our website. At the end of the registration process, you will reach the following page view.
What is Twilio?
Twilio is a cloud communications platform offering communication APIs for developers to make, receive, and control phone calls and messaging from apps, embed live video and audio in apps, and perform authentication. Through these web service APIs, businesses of any size can benefit in terms of marketing campaigns, upcoming announcements, trip scheduling, etc., through secured communication.
Defining metrics for activity tracking
In this blog post, we are going to create a dashboard showcasing calls and SMS activities with your Twilio data to get better insights and make quick decisions for your support team. Hence, the following metrics are needed:
- Number of messages
- Number of calls
- Call prices
- Call durations
- Message prices
- Message breakdown by direction
- Call breakdown by direction
- Messages by status
- Calls by status
- Duration of calls over time
Getting Twilio data
Twilio’s Voice API allows you to make and manage calls programmatically. Likewise, Twilio’s SMS API allows you to send and manage messages programmatically.
The base URL for Twilio REST API is, https://api.twilio.com/2010-04-01.
HTTP requests to the Twilio’s Voice API and SMS API are protected with HTTP Basic authentication. Hence, your Twilio’s AccountSid will be the username and your AuthToken will be the password.
Further, you can find those details in your console. Also this blog walkthrough uses only this form of authentication.
However, the other form of authentication is through creating an API key in your console. Hence, for this case, your API Key’s Sid will be the username and your API Key’s Secret will be the password.
The required Twilio REST API endpoints are illustrated in the following table for reference.
| Endpoint | Used for | Endpoint URL Example |
| GET /Accounts/{AccountSid}/Messages.json | Retrieval of list of messages associated with your account. | https://api.twilio.com/2010-04-01/Accounts/{AccountSid}/Messages.json |
| GET /Accounts/{AccountSid}/Calls.json | Retrieval of list of phone calls made to and from your account. | https://api.twilio.com/2010-04-01/Accounts/{AccountSid}/Calls.json |
Creating a dashboard and data sources
Firstly, decide the dashboard layout and the widgets needed to visualize the planned metrics. Then, add those widgets from the toolbox to the dashboard layout.
Creating a new blank dashboard
- Select the New Dashboard tile in the homepage of the Bold BI Dashboards.
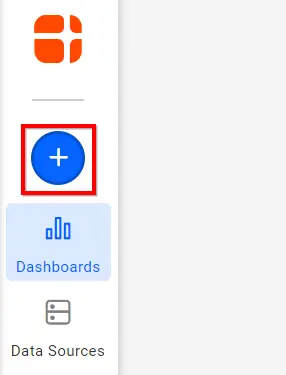

New Dashboard Tile in Homepage - As a result, the Create Dashboard window opens with four options.
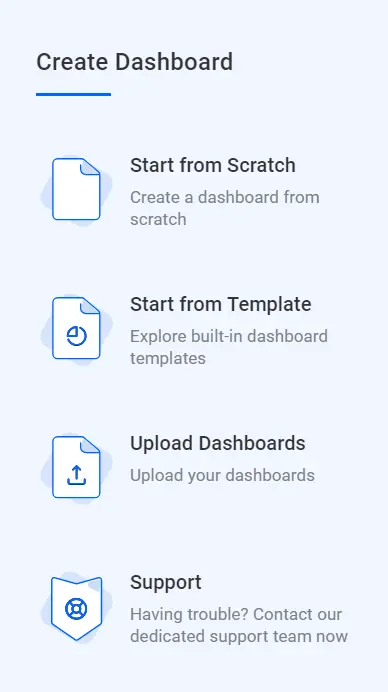

Templates view in Create Dashboard window - Choose Start from Scratch. Finally, the Dashboard Designer page opens with a new blank dashboard created.
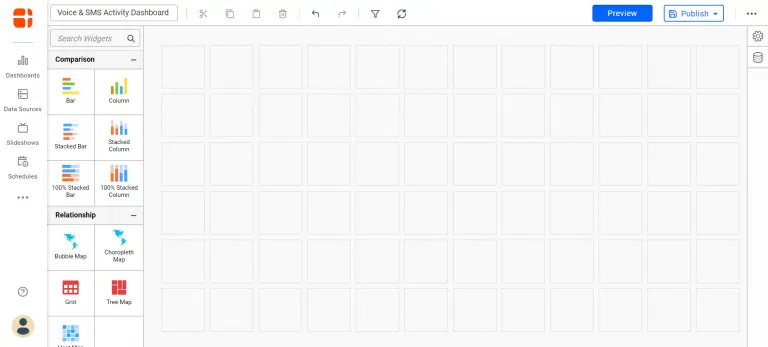

Blank dashboard in editing view
Connecting to Twilio
- First, select the data source icon at the right. Consequently, the data source panel will expand as shown in the following.
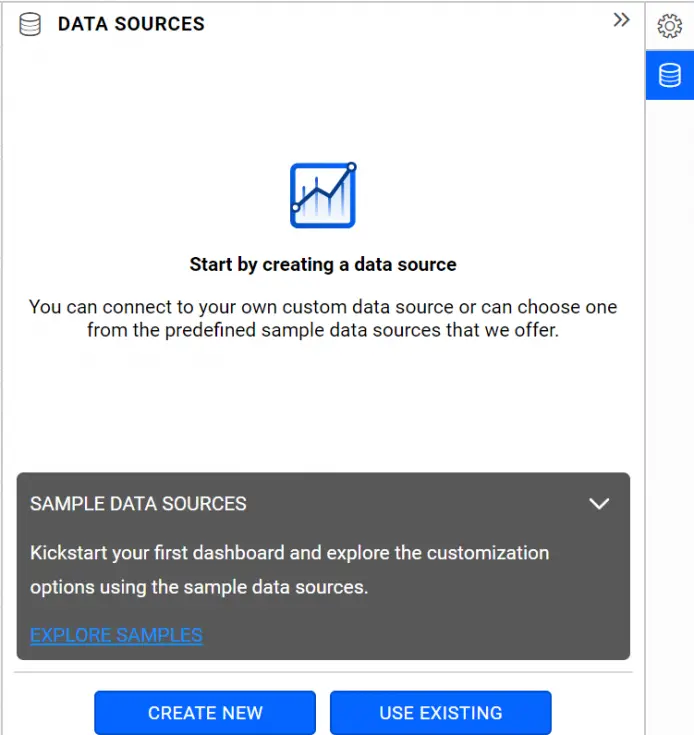

An empty data source panel - Select CREATE NEW in the previous panel. As a result, this shows the list of data connectors like in the following.
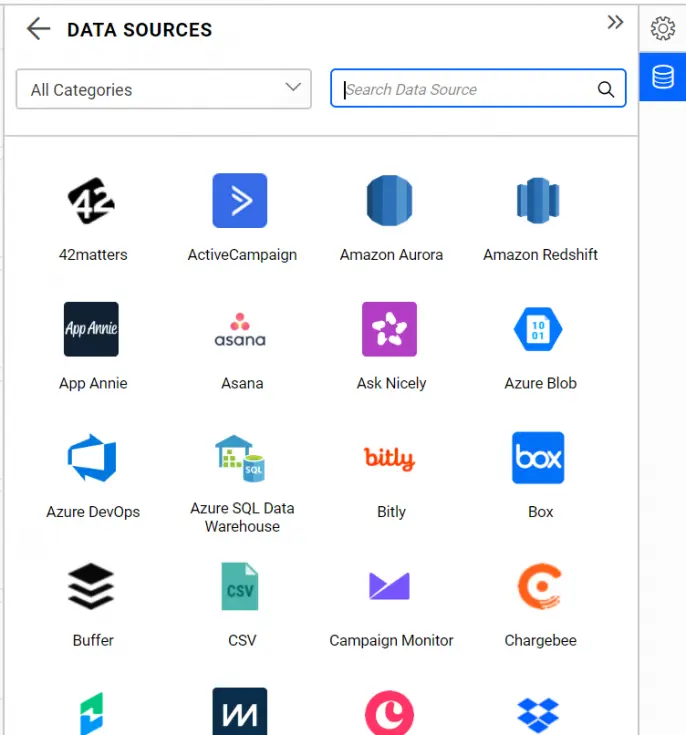

Supported Data Connections - In the Categories drop-down list at the top, choose the category Support. Consequently, it shows the data connectors available under Support category like in the following.
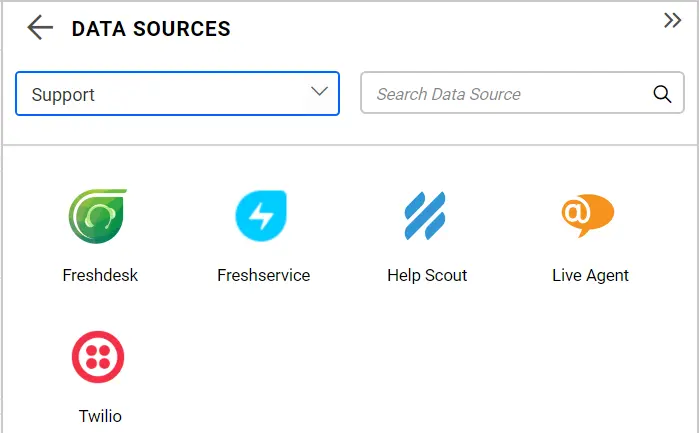

Supported Data Connections in Support Category - Choose the Twilio connector. As a result, the Twilio data connection window will be displayed in the panel.
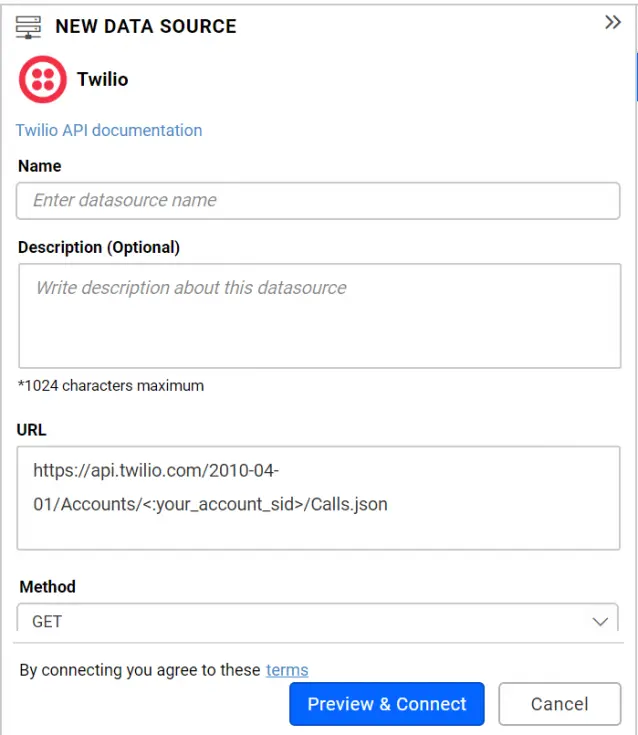

New Twilio Data source Window
Creating a Twilio data source
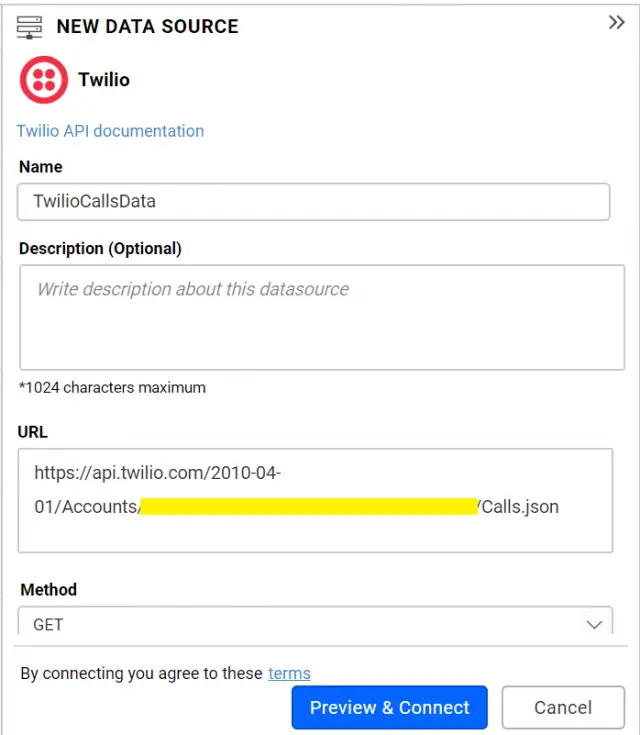
- Firstly, name the data source as TwilioCallsData.
- In the URL section, fill the calls endpoint URL as shown in the following and replace the {AccountSid} placeholder with your account Sid.
https://api.twilio.com/2010-04-01/Accounts/{AccountSid}/Calls.json - Leave the default value GET selected under the Method section. Also, leave the Header(s) section empty.
- In addition, define the refresh settings with the interval. Furthermore, the dashboard can refresh itself with the latest data updates.
- Let the Data Format be JSON since the Calls and Messages API endpoints return result in JSON format.
- Set the Authentication Type to Basic Http Authentication since Twilio API supports this authentication type.
- Enter the User Name with the account Sid and Password with the Auth Token like in the following.

Twilio data source window with details filled - Click Preview & Connect. As a result, a window opens listing the data results, categorized into a table and columns.
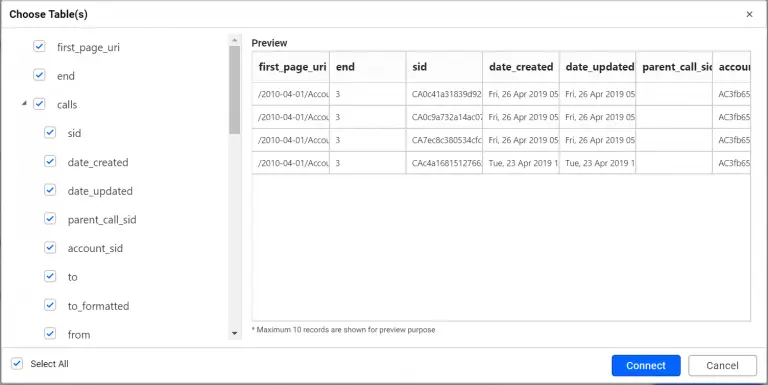

Preview window showing calls detail - Finally, choose the desired columns and click Connect. Consequently, the data source with the selected table and columns is created like in the following.
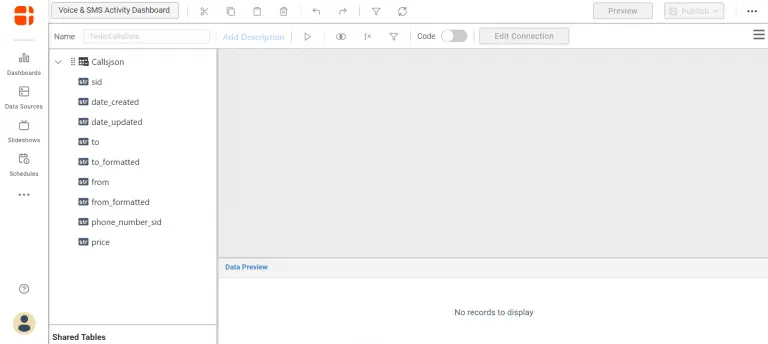

Data source view of Twilio Calls API
Editing the Twilio data source
- Furthermore, drag the table into the editing window.
- Select the Expression icon in the toolbar of the table design view like in the following. Consequently, the expression editor opens.
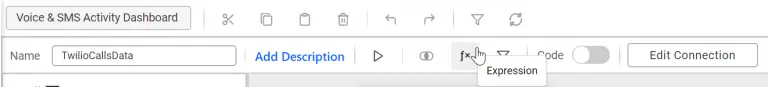

Opening expression editor in TwilioCallsData data source view - Create an expression column named Amount with the expression like in the following. This is needed since the REST API returned values are all strings by default and this column value needs to undergo an aggregation process (SUM).
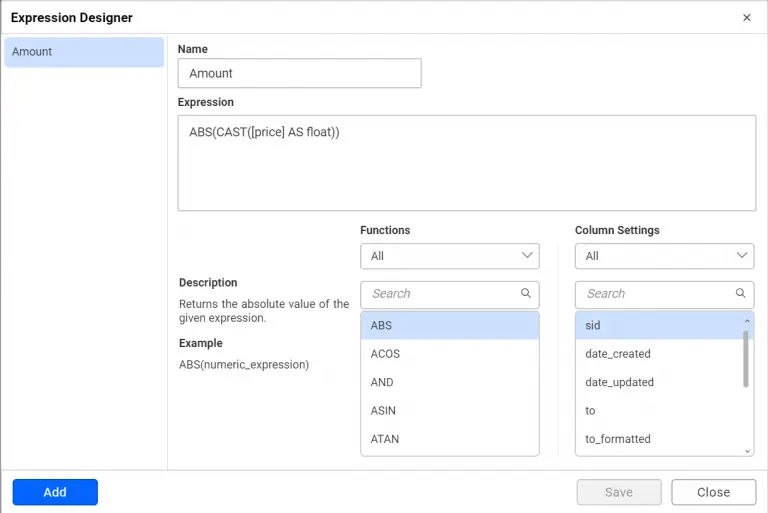

Expression editor showing expression column created for TwilioCallsData data source - Also, save and close the expression editor.
- Click Save to save the data source. Consequently, the data sources panel lists the created data source like in the following.
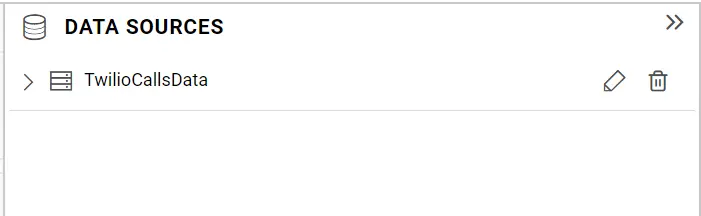

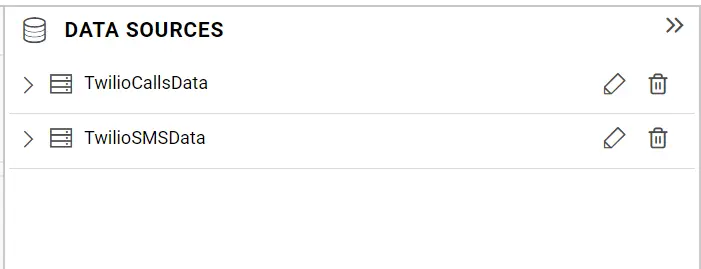
TwilioCallsData data source view in DATA SOURCES panel - Similarly, create a data source named TwilioSMSData with a Messages endpoint URL like in the following and create an Amount expression column like previously discussed.
https://api.twilio.com/2010-04-01/Accounts/{AccountSid}/Messages.json
Finally, the created data sources will get added in the DATA SOURCES panel like in the following.
Configuring widgets in a dashboard
Configure the widgets in the dashboard with corresponding data sources as described in the following table.
| Widget | Data Configuration |
| Calls (Type: Card) |
|
| Messages (Type: Card) |
|
| Messages Delivery Status (Type: Doughnut Chart) |
|
| Messages Prices Breakdown over Time (Type: Bar Chart) |
|
| Calls by Status (Type: Doughnut Chart) |
|
| Calls Price (Type: Card) |
|
| Messages Price (Type: Card) |
|
| Average Calls Duration (in secs) (Type: Card) |
|
| Duration of Calls over Time (Type: Spine Chart) |
|
| Outgoing Calls Breakdown by Phone Number (Type: Column Chart) |
|
For display-level formatting like currency format, elements visibility in charts such as, legend, value labels, etc., make relevant changes through the Properties tab of individual widgets. Finally, the dashboard is ready.
Sharing your dashboard
Now, share this dashboard with your support team to assess the call and SMS statistics over time and make business decisions quicker. We hope this article helps you build a support tracker dashboard with Twilio data using Bold BI Dashboards.If you have any questions on this blog, please feel free to post them in the following comment section. Get started with Bold BI by signing up for a free 30-day trial and create more interactive business intelligence dashboards. You can also contact us by submitting your questions through the Bold BI website or, if you already have an account, you can log in to submit your support question.