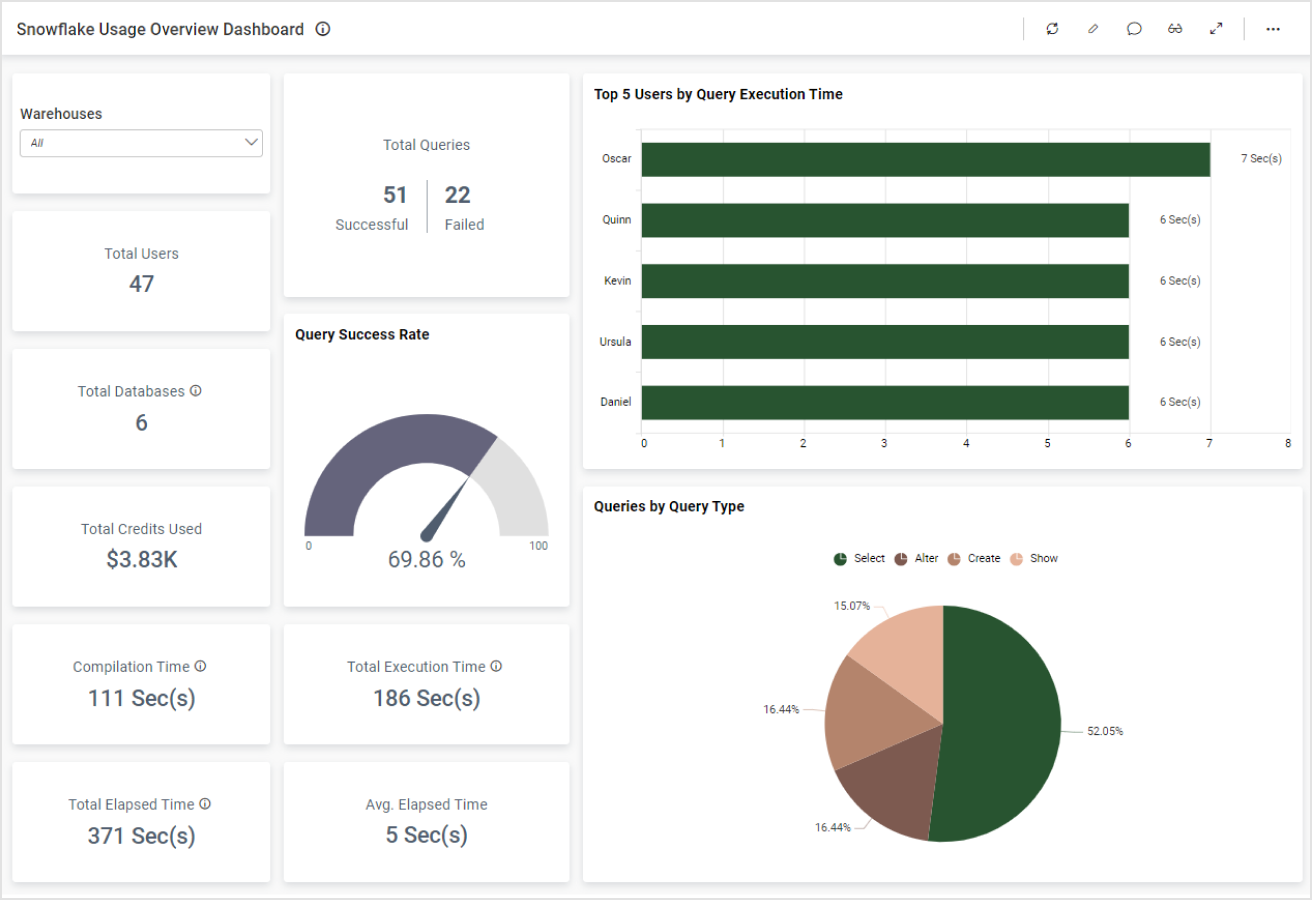
The Snowflake dashboard for analyzing usage is an invaluable resource highly sought by IT professionals managing Snowflake integration and storage. It allows you to answer the following questions:
How many queries were submitted?
What is the query success rate?
How many total credits were used?
Who are the users by database?
The Snowflake Usage Overview Dashboard is an indispensable asset for IT teams tasked with overseeing Snowflake integration and storage. This comprehensive dashboard offers a wide range of critical metrics to streamline operational workflows and resource management. IT professionals can effortlessly track key parameters such as the total number of warehouses, users, databases, and queries, providing a holistic view of their Snowflake environment.
The dashboard further enhances performance monitoring with metrics like query success rates, top users ranked by query success, total elapsed time, average elapsed time, and compilation time. Cost-conscious organizations benefit from insights into total credits used and a breakdown of credit usage by warehouse, ensuring efficient resource allocation.
One of the essential features of the dashboard is its ability to analyze user behavior and query performance. It provides a holistic approach toward data management by incorporating valuable insights into queries by type, user queries, and warehouse and database users. Understanding and analyzing user behavior helps improve efficiency by optimizing resources and enhancing customer service by providing personalized solutions. The dashboard is a valuable tool for IT professionals, as it enables them to make data-driven decisions, saving resources and improving productivity.
By carefully studying the reports generated by the dashboard, IT managers can gain insights into how their employees interact with data and identify patterns in query performance. The ability to anticipate and predict user needs is crucial in maintaining a competitive edge in today’s rapidly changing business environment. With the insights provided by the dashboard, IT managers are better equipped to manage their organization’s data and streamline their operations.
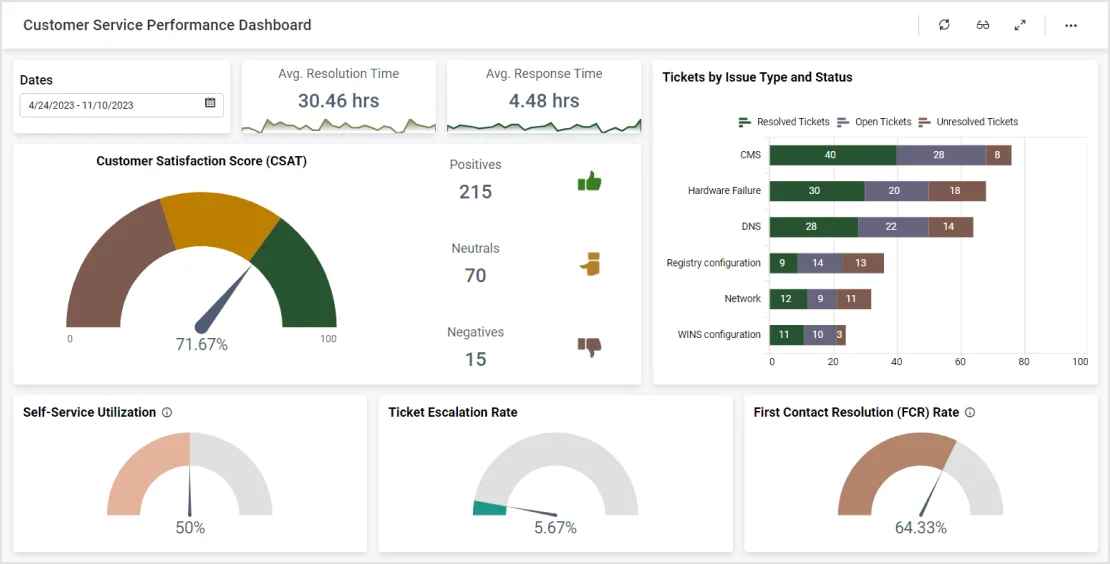
This customer service performance dashboard provides a detailed breakdown of an IT team's operations. With this...
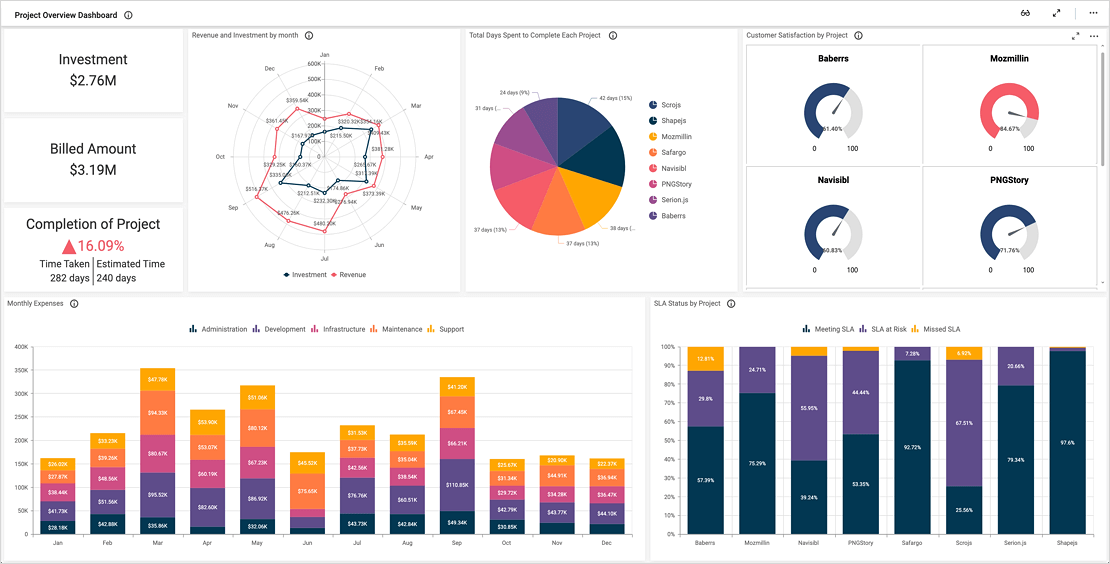
Learn More View DashboardBold BI’s project management dashboard outlines the financial health of an IT company. Further, it displays detailed....
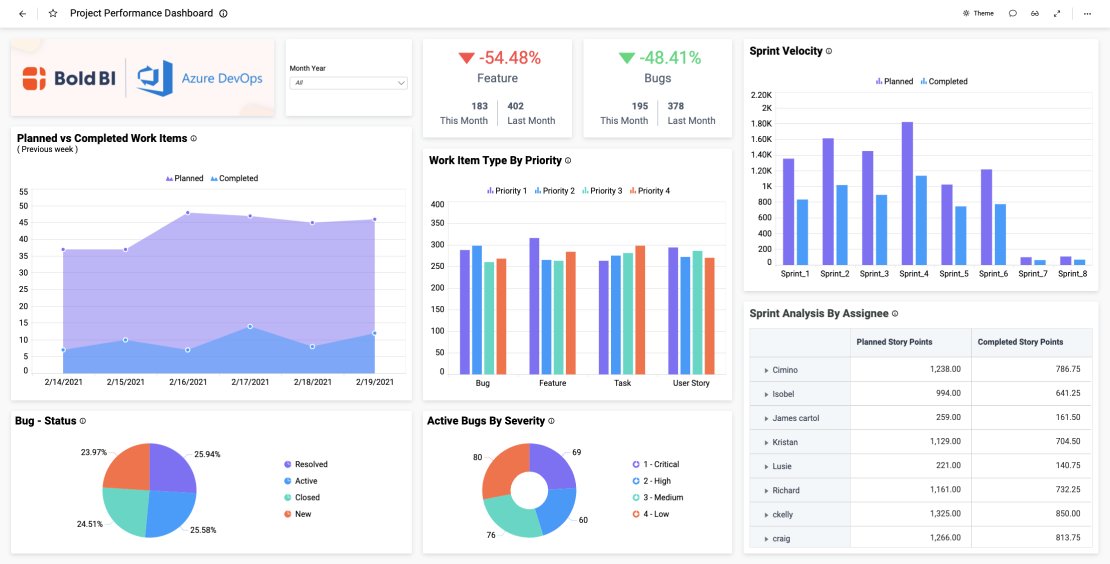
Learn More View DashboardThis project performance dashboard provides an overview of an IT team's sprint tasks. With this Azure DevOps dashboard...
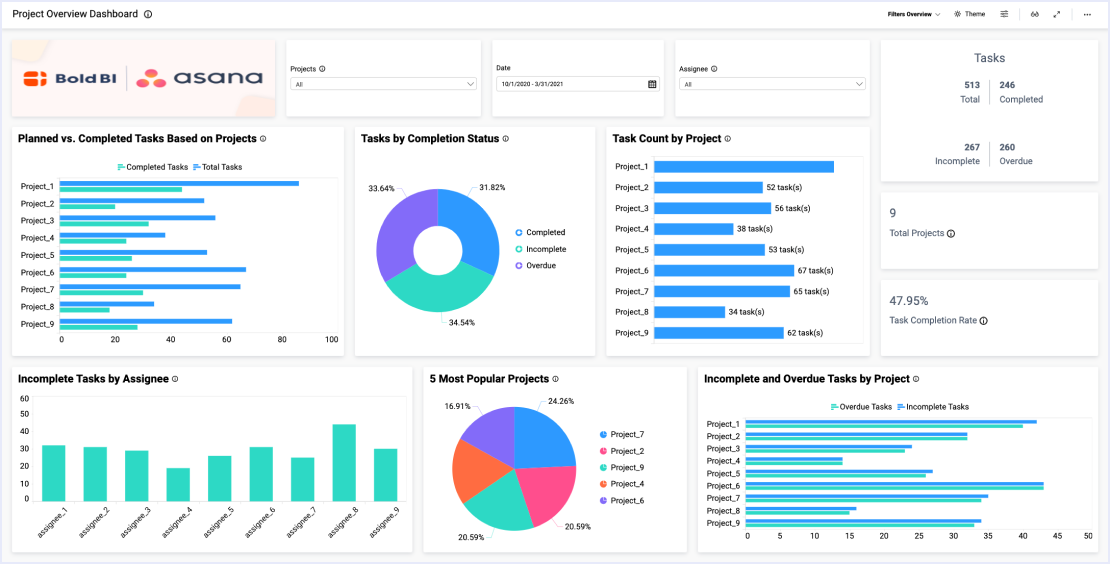
Learn More View DashboardThis Asana project dashboard provides an overview of a team's projects and tasks. With this IT operations dashboard, we can answer...
Learn More View DashboardThis issue tracker dashboard provides a detailed overview of a team’s created and closed issues. With this dashboard, we can answer...
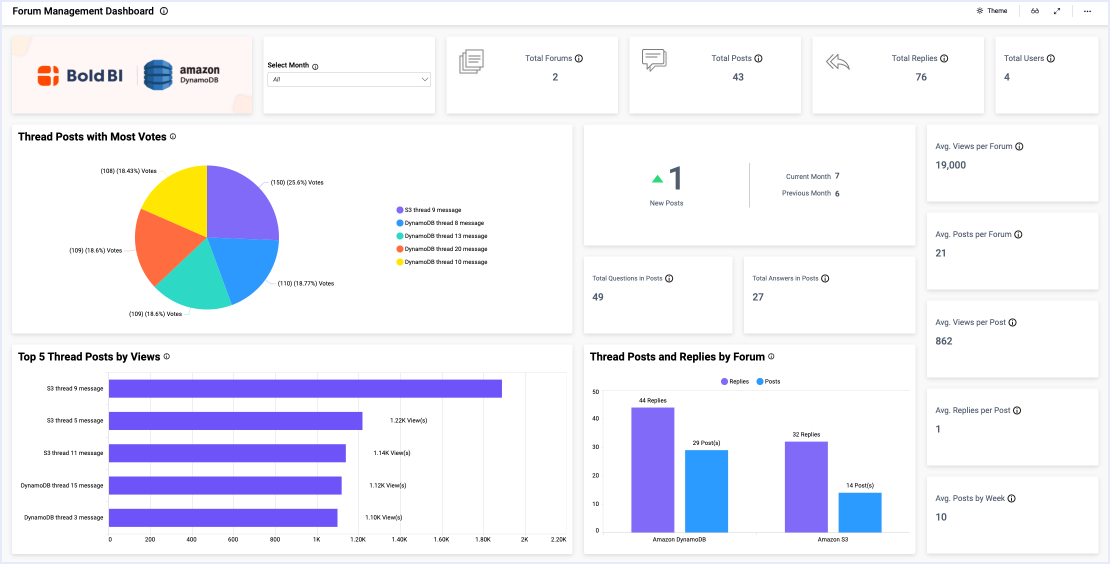
Learn More View DashboardThis forum management dashboard allows moderators to track key metrics relating to threads and forums. With this dashboard...
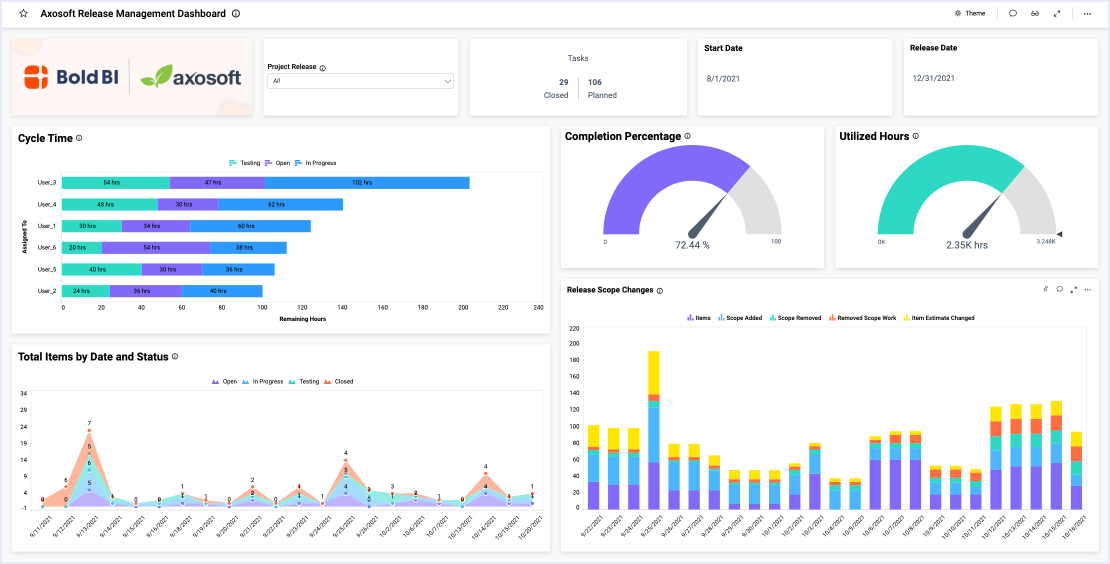
Learn More View DashboardThis Axosoft release management dashboard allows product managers to track key product release metrics.
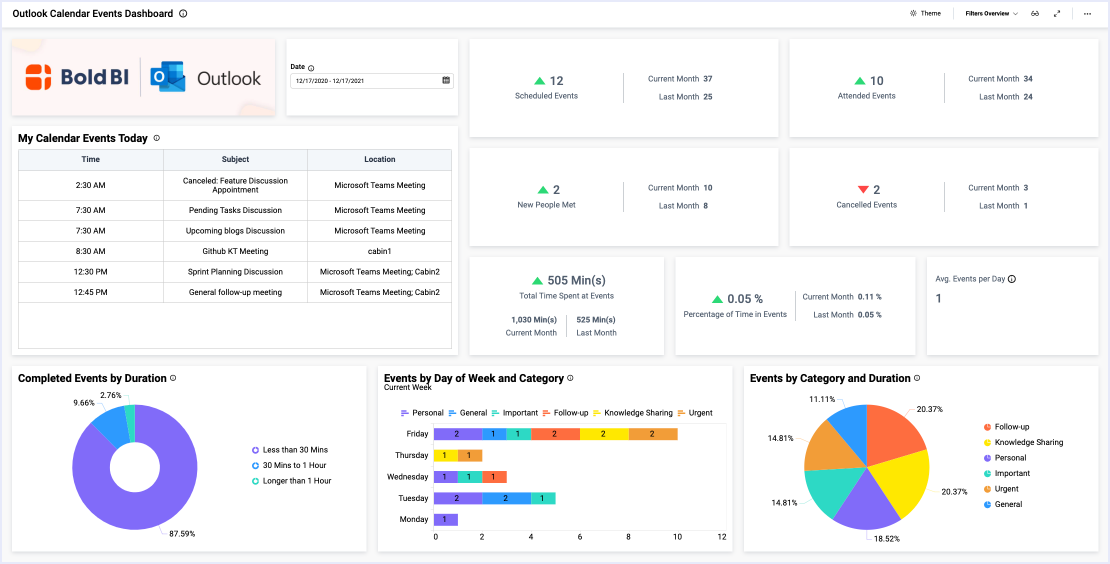
Learn More View DashboardThis Outlook calendar events dashboard helps team members optimize their daily activities. With this dashboard, we can answer...
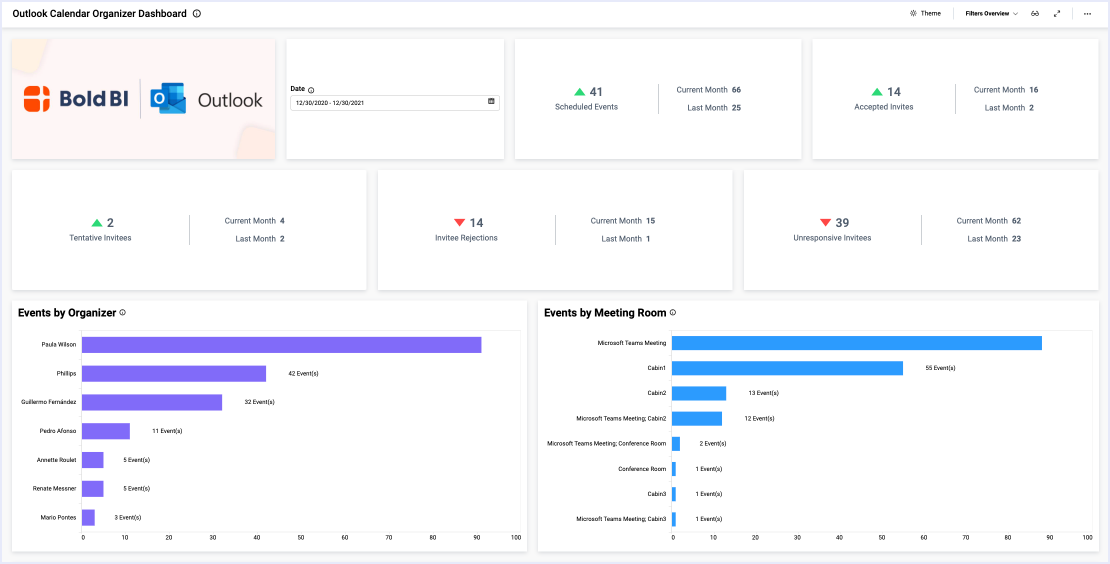
Learn More View DashboardThis Outlook calendar organizer dashboard helps team members optimize their daily activities. With this dashboard, we can answer the following...
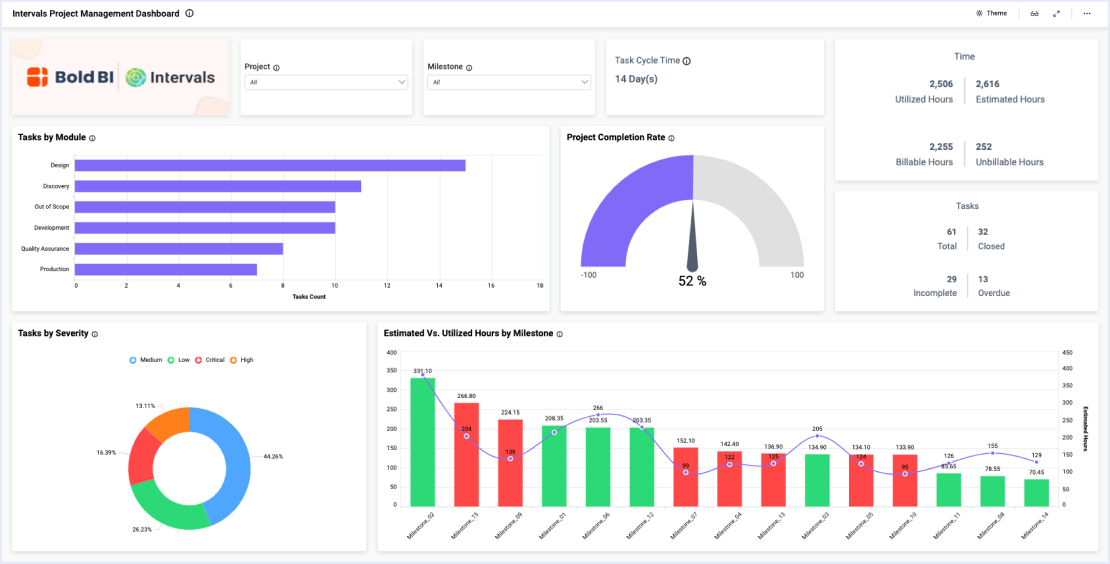
Learn More View DashboardThe Intervals Project Management dashboard helps team members and managers organize, track, and measure the success of team projects and tasks.
Learn More View DashboardThis IT Toggl Project Time Tracking Dashboard allows professionals to thoroughly track a wide range of project based metrics. With this dashboard...
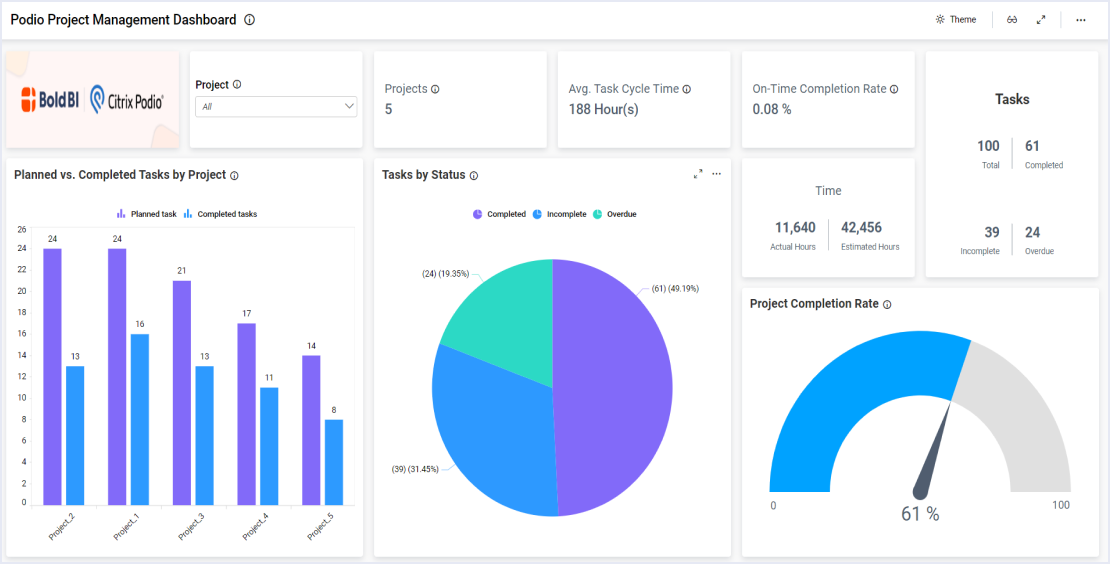
Learn More View DashboardThis Podio Project Tracking Dashboard allows professionals to thoroughly track a wide range of tasks based metrics. With this dashboard...
Learn More View DashboardThis Harvest Project Time Tracking Dashboard allows professionals to thoroughly track a wide range of tasks based metrics. With this dashboard...
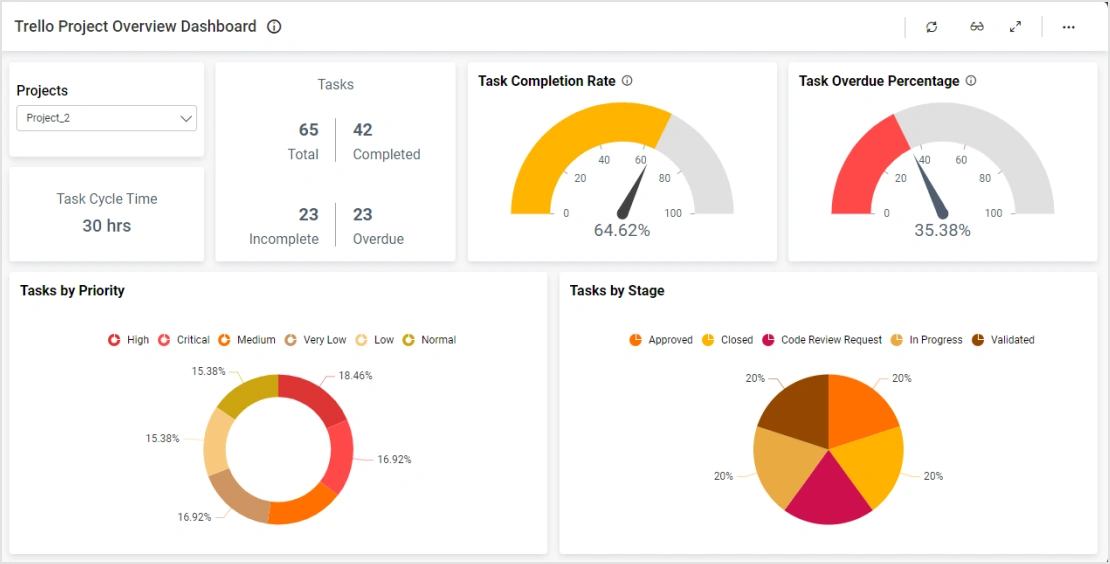
Learn More View DashboardThis Trello Project Overview Dashboard allows professionals to thoroughly track a wide range of tasks and project based metrics. With this dashboard...
Learn More View DashboardFrom evaluating equipment downtime to analyzing labor and production costs...
Learn MoreTry out all the features of Bold BI® with 30-day free trial and get to know how it suit to your needs of embedded analytics.
Platform