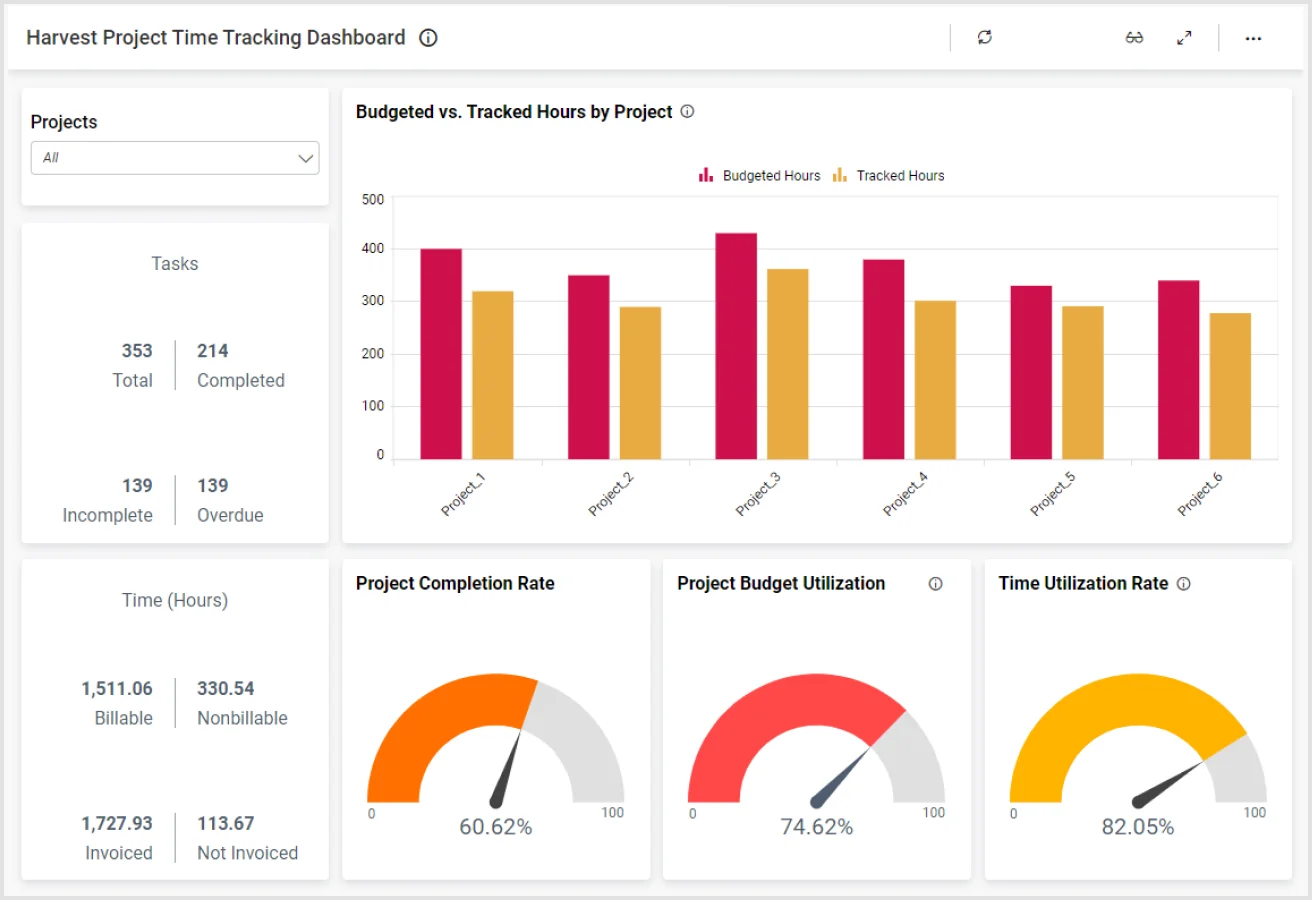
This Harvest time tracking dashboard keeps project managers well-informed of how time is handled across projects. With this dashboard, we can answer the following questions:
What is our ratio of completed to total tasks? How many tasks are currently incomplete or overdue?
How are our tracked hours measuring up to our budgeted hours in each project?
What is our project progress in terms of tracked and remaining hours over the past 30 days?
What are the budget and deadline details of our active projects?
The role of project managers is to keep multiple budgets balanced: budgets in terms of money, hours, and tasks. This Harvest time tracking dashboard helpfully visualizes numerous aspects of projects managed with Harvest, giving project managers a single resource they can rely on to stay on top of everything they need to know.
To let project managers view only necessary data, the Projects dropdown at the top of the Harvest time tracking dashboard lets project managers filter what data is visualized throughout the dashboard, whether only a specific project, several projects, or all current projects.
For instant metrics, project managers can consult the Tasks card and Time (Hours) card. These present figures about project tasks—total versus completed, incomplete and overdue—and time on tasks—billable versus nonbillable hours, invoiced versus not-invoiced hours. Being able to call on these numbers at a moment’s notice is important, but understanding their relationships without having to do any mental math even more helpful.
Thus, this Harvest integration provides the trio of Project Completion Rate, Project Budget Utilization, and Time Utilization Rate radial gauges visualize the ratios from the Tasks and Time cards. In a look, project managers can see whether they are running on time or falling behind in the selected projects. From there, they can make informed decisions to complete projects by their deadlines.
The Budgeted versus Tracked Hours by Project column chart further breaks down the Harvest time tracking in this dashboard. Each category in the chart represents a project, and the columns in each category represent the budgeted hours and tracked hours next to each other. This provides another easy way for managers to check the progress of their various projects immediately. It also allows managers to instantly see how close their teams are to meeting or exceeding allotted time budgets.
For project managers looking to dig into the details of how time is being used in projects, the Project Progress by Date line chart of this Harvest time tracking dashboard plots two series, tracked hours and remaining hours, on a day-by-day basis. This chart can also be used to see the overall trend of how well time is being used.
Next is the Tracked Hours by Assignee column chart, showing the billable hours and nonbillable hours accumulated by each assignee. This evaluates the working efficiency of each employee, which can be used to inform targeted trainings, manpower reallocation, and other strategies to maximize billable hours while minimizing nonbillable hours.
Finally, the Active Projects Summary data grid at the bottom of the Harvest time tracking dashboard lists the details of each project, including its budget, billable hourly rate, created date, due date, and more. This widget is particularly helpful for evaluating the finances of each project, revealing which projects should be the most profitable for the company.
The unique collection of charts, widgets, and cards allows project managers to ensure time is utilized efficiently so that deadlines are met and clients are satisfied.
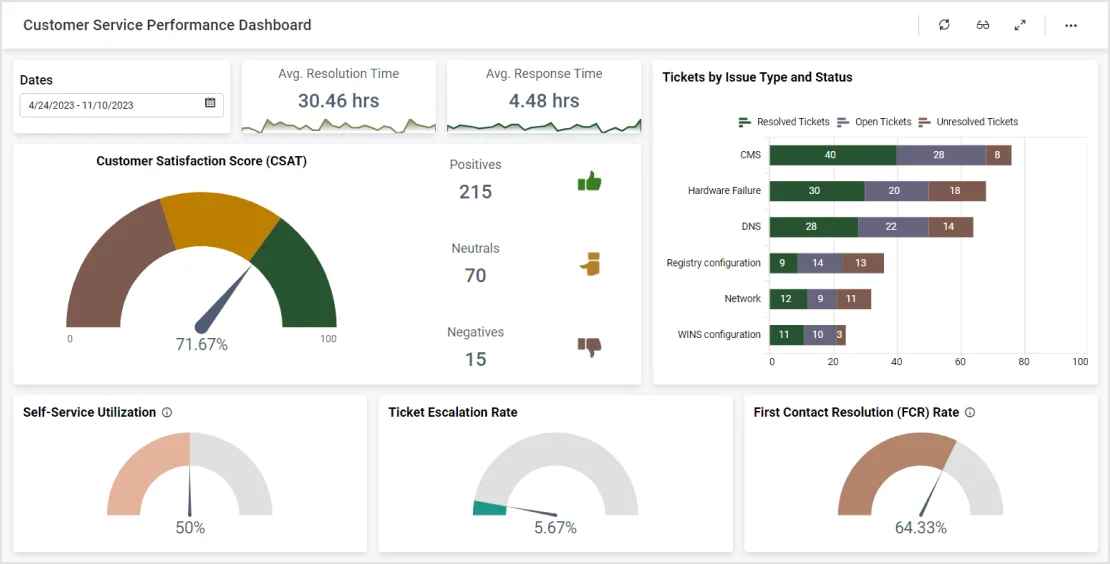
This customer service performance dashboard provides a detailed breakdown of an IT team's operations. With this ...
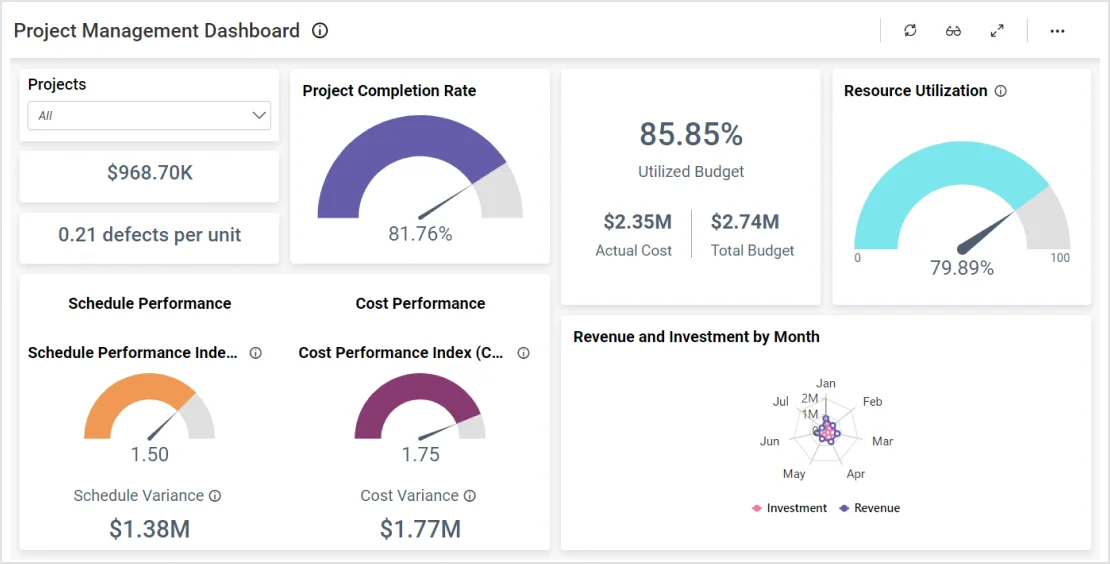
Learn More View DashboardBold BI’s project management dashboard outlines the financial health of an IT company. Further, it displays detailed....
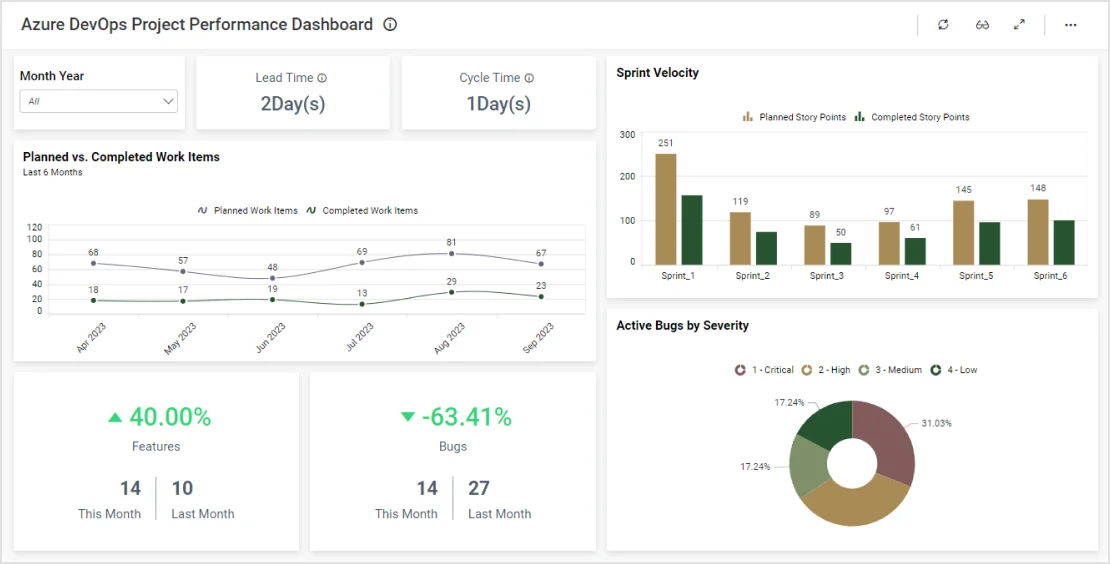
Learn More View DashboardThis project performance dashboard provides an overview of an IT team's sprint tasks. With this Azure DevOps dashboard...
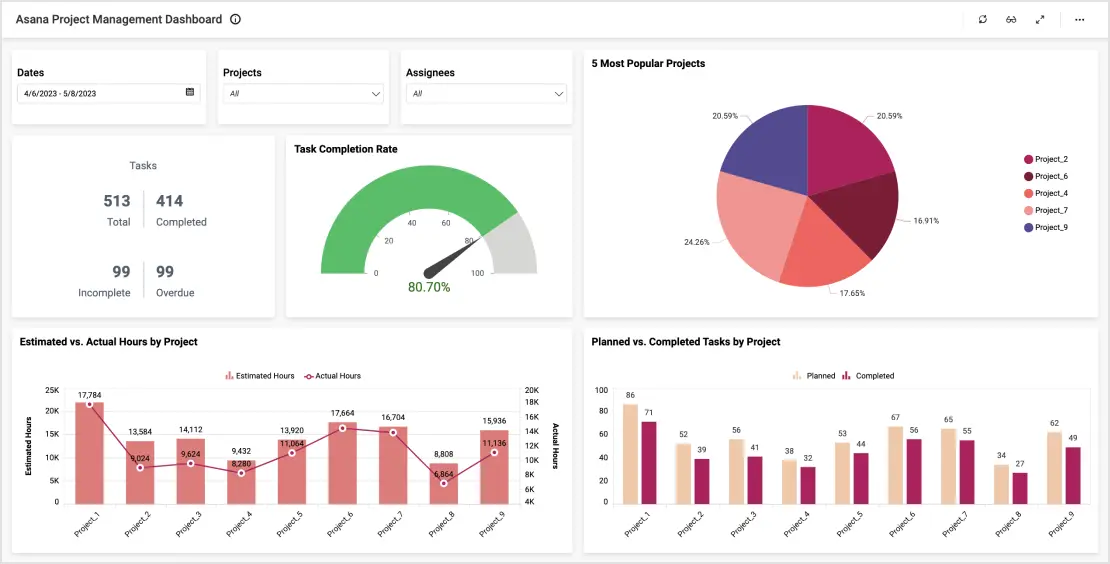
Learn More View DashboardThis Asana project dashboard provides an overview of a team's projects and tasks. With this IT operations dashboard, we can ...
Learn More View DashboardThis issue tracker dashboard provides a detailed overview of a team’s created and closed issues. With this dashboard, we can answer...
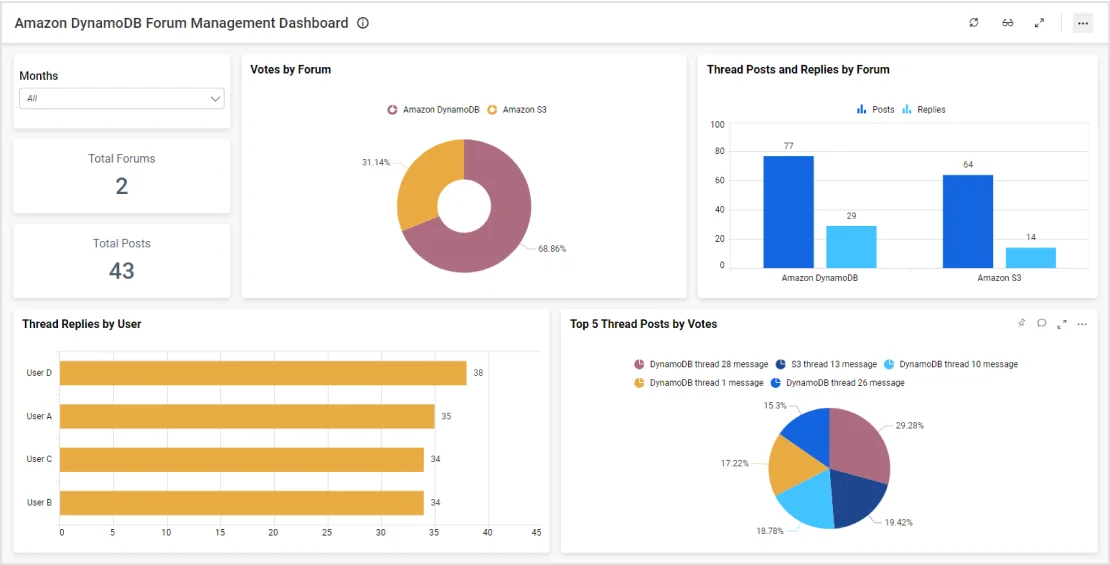
Learn More View DashboardThis forum management dashboard allows moderators to track key metrics relating to threads and forums. With this dashboard, we can answer...
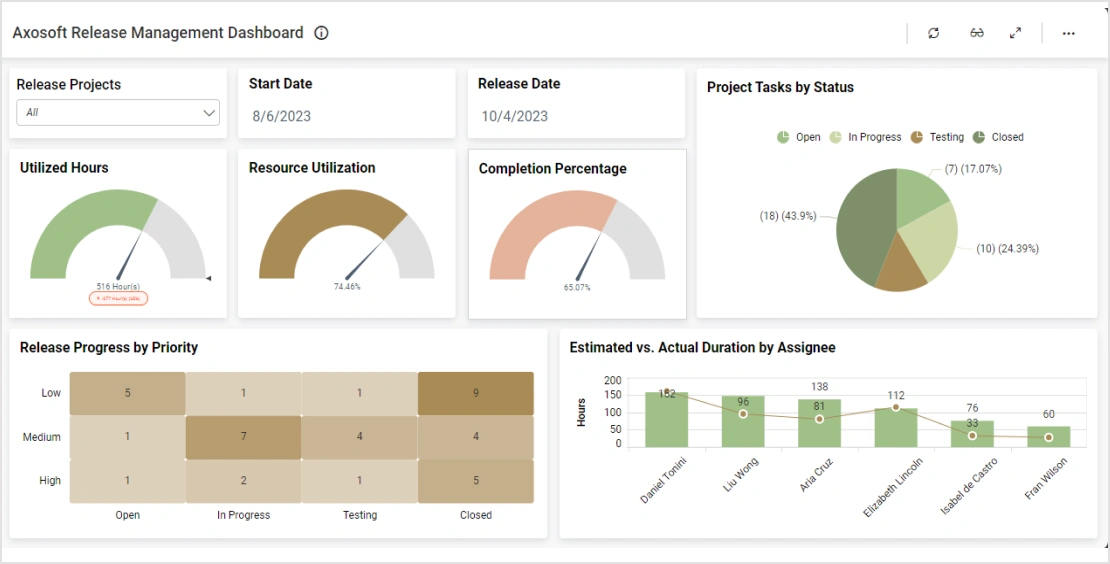
Learn More View DashboardThis Axosoft release management dashboard allows product managers to track key product release metrics.
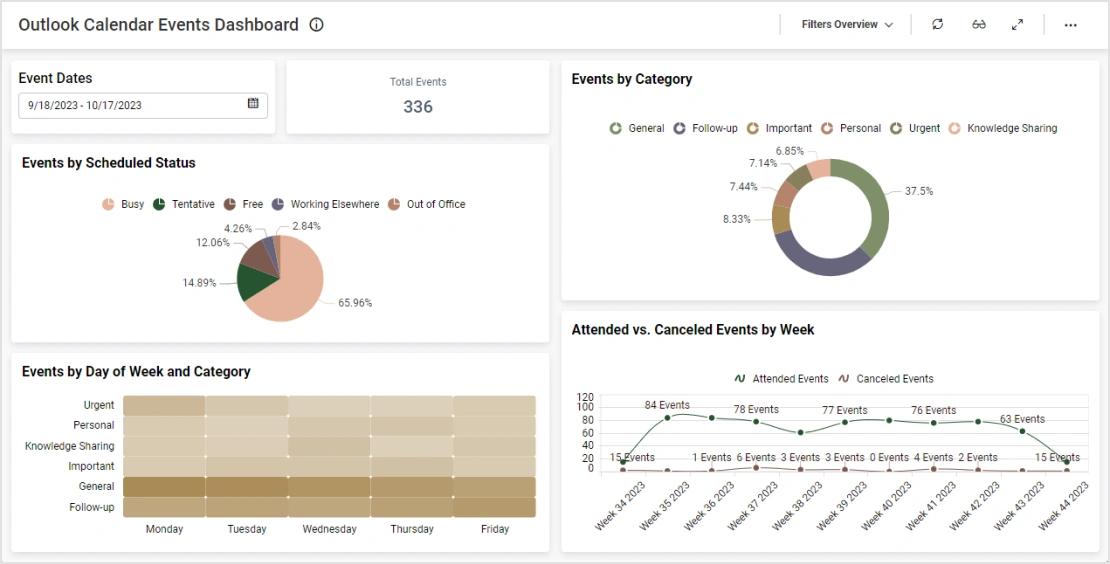
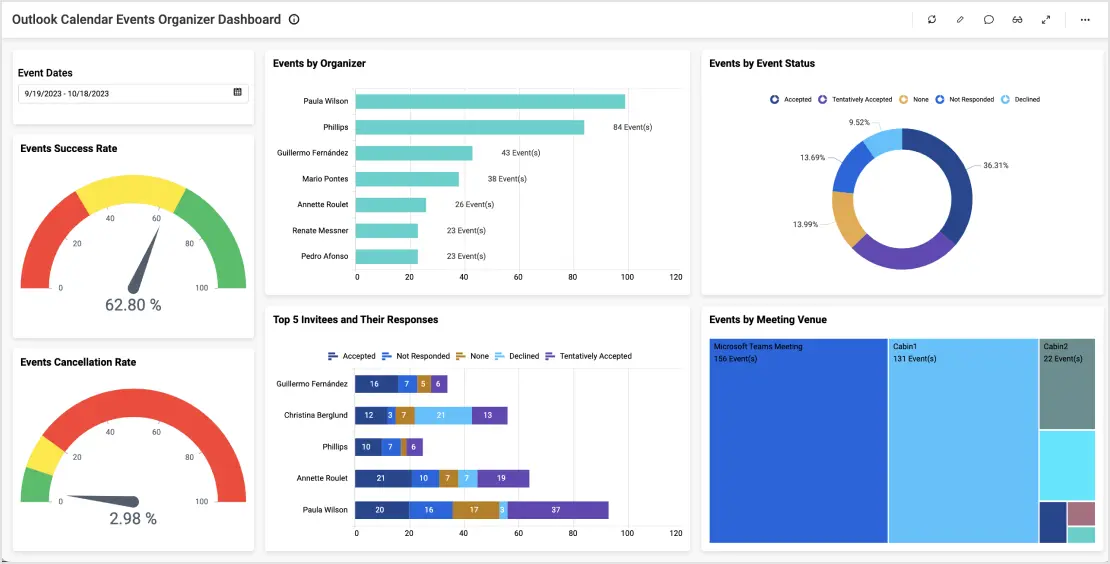
Learn More View DashboardThis Outlook calendar events dashboard helps team members optimize their daily activities. With this dashboard, we can answer...
Learn More View DashboardThis Outlook calendar organizer dashboard helps team members optimize their daily activities. With this dashboard, we can answer the following...
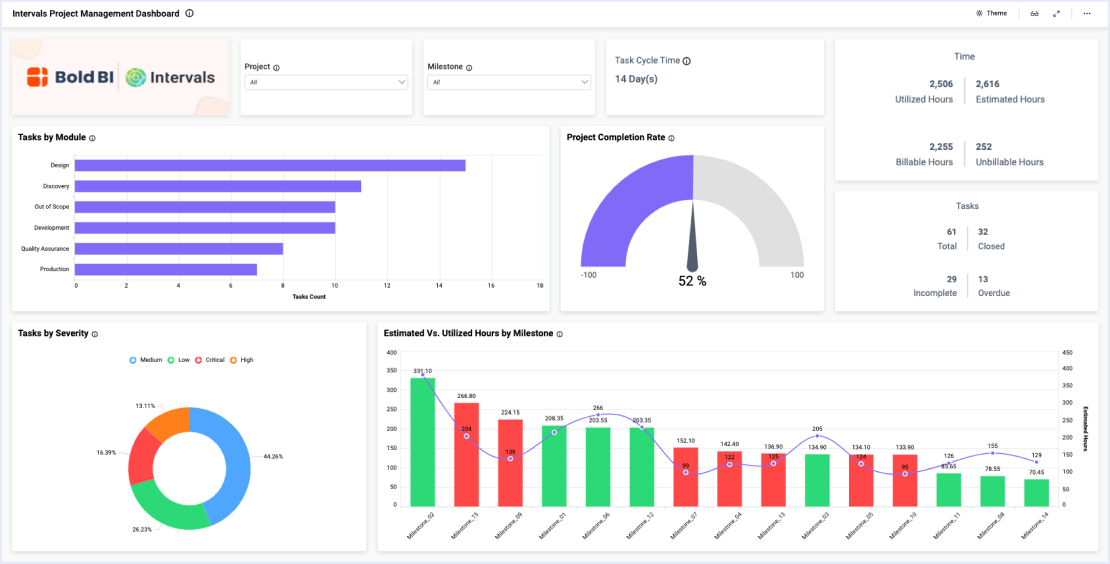
Learn More View DashboardThe Intervals Project Management dashboard helps team members and managers organize, track, and measure the success of team projects and tasks.
Learn More View DashboardThis IT Toggl Project Time Tracking Dashboard allows professionals to thoroughly track a wide range of project based metrics. With this dashboard...
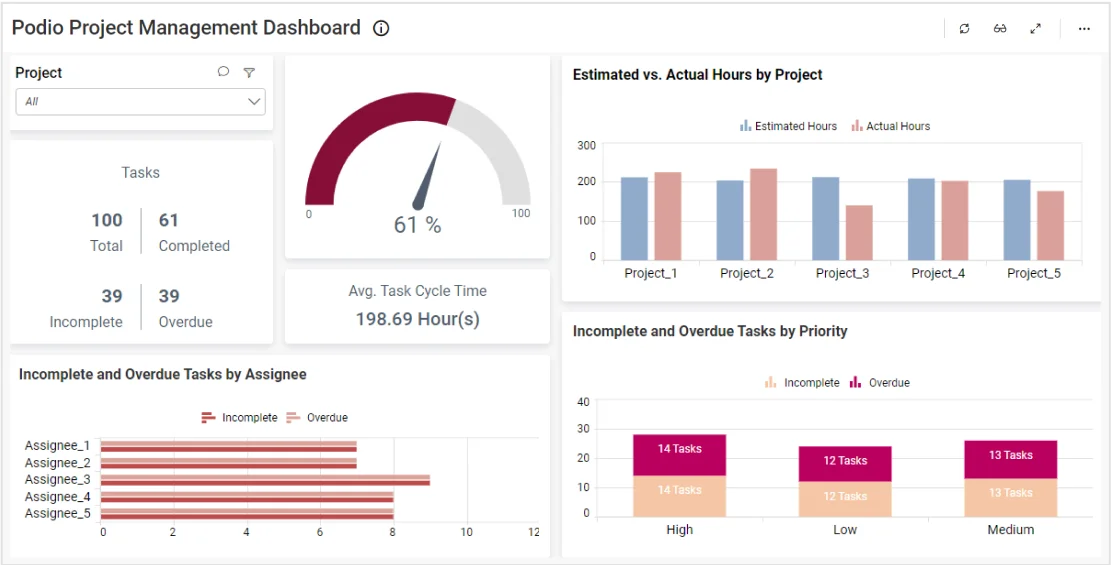
Learn More View DashboardThis Podio Project Tracking Dashboard allows professionals to thoroughly track a wide range of tasks based metrics. With this dashboard...
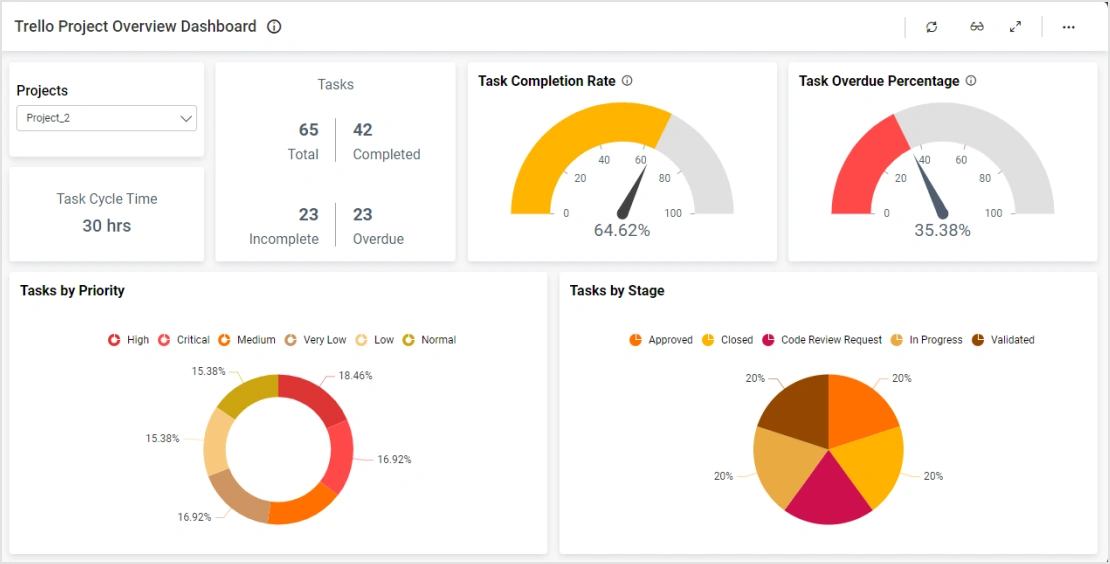
Learn More View DashboardThis Trello Project Overview Dashboard allows professionals to thoroughly track a wide range of tasks and project based metrics. With this dashboard...
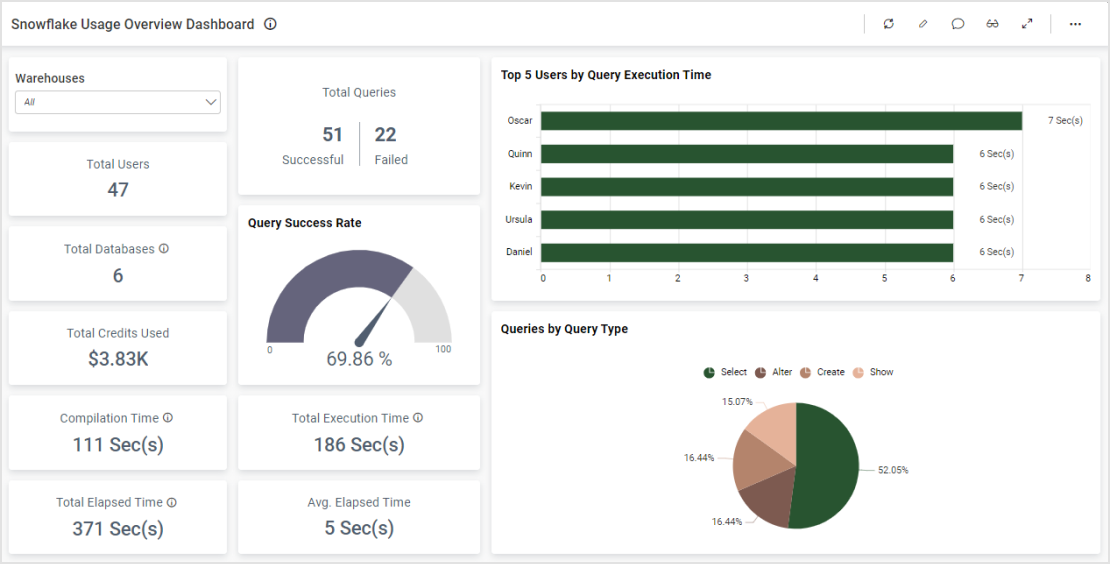
Learn More View DashboardThis Snowflake usage overview dashboard provides a detailed breakdown of their operational workflow. With this dashboard, we can answer…
Learn More View DashboardFrom evaluating equipment downtime to analyzing labor and production costs...
Learn MoreTry out all the features of Bold BI® with 30-day free trial and get to know how it suit to your needs of embedded analytics.
Platform