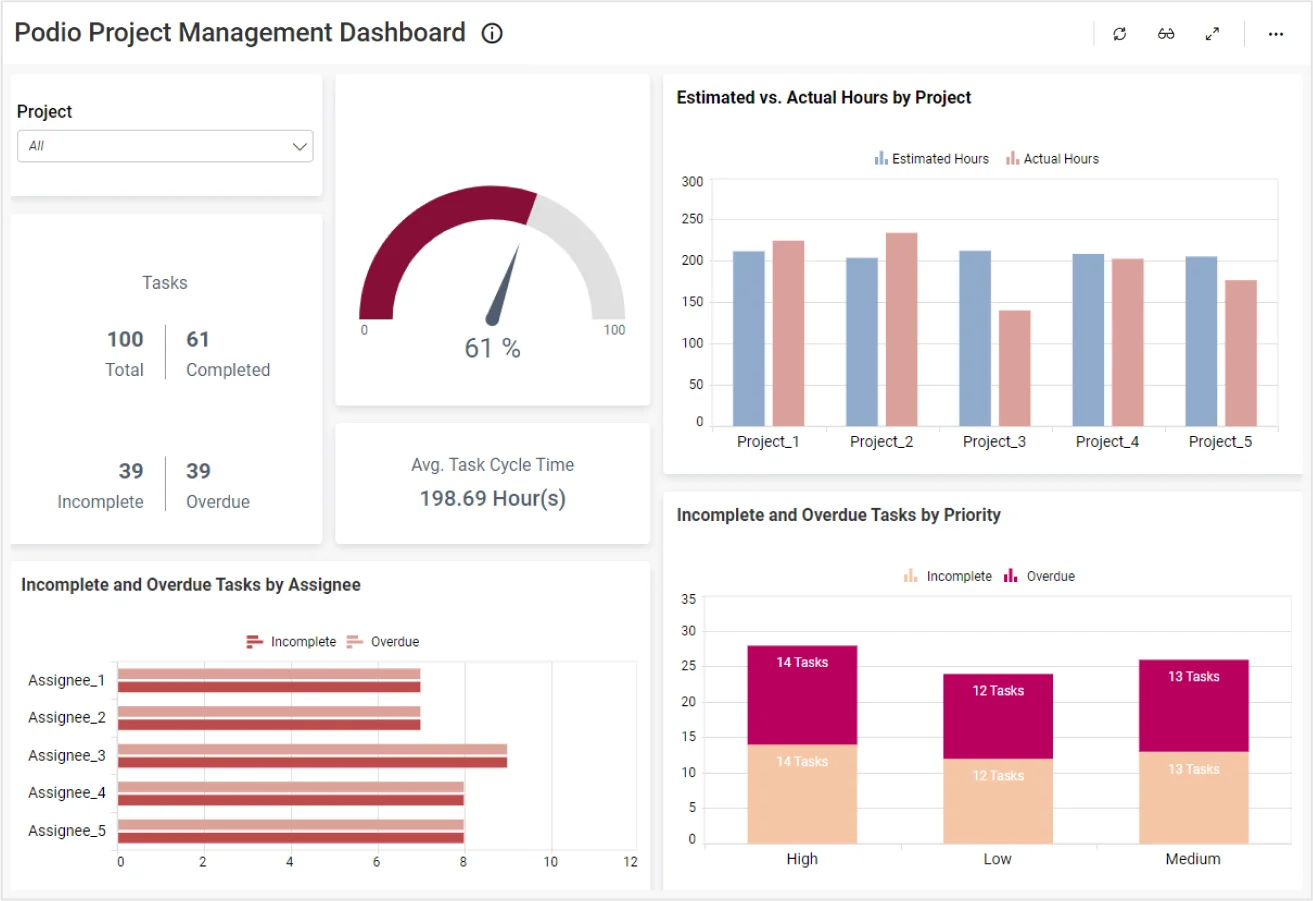
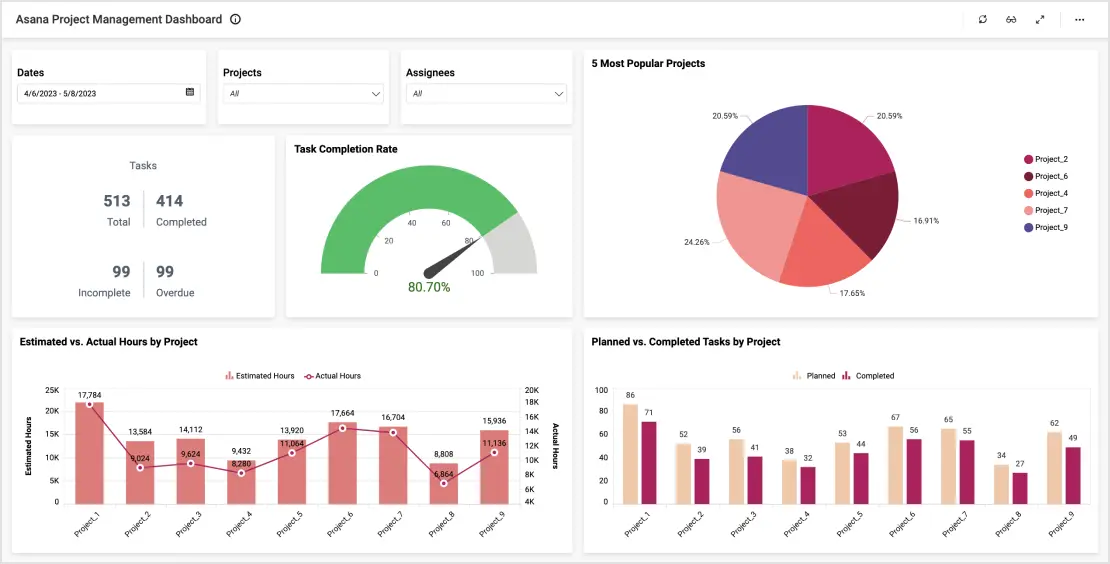
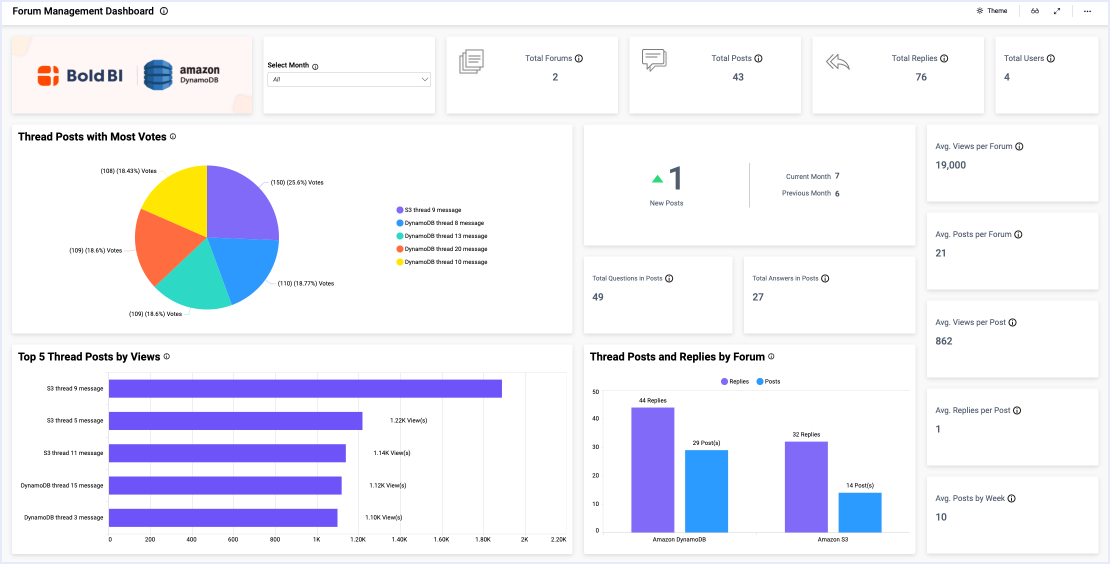
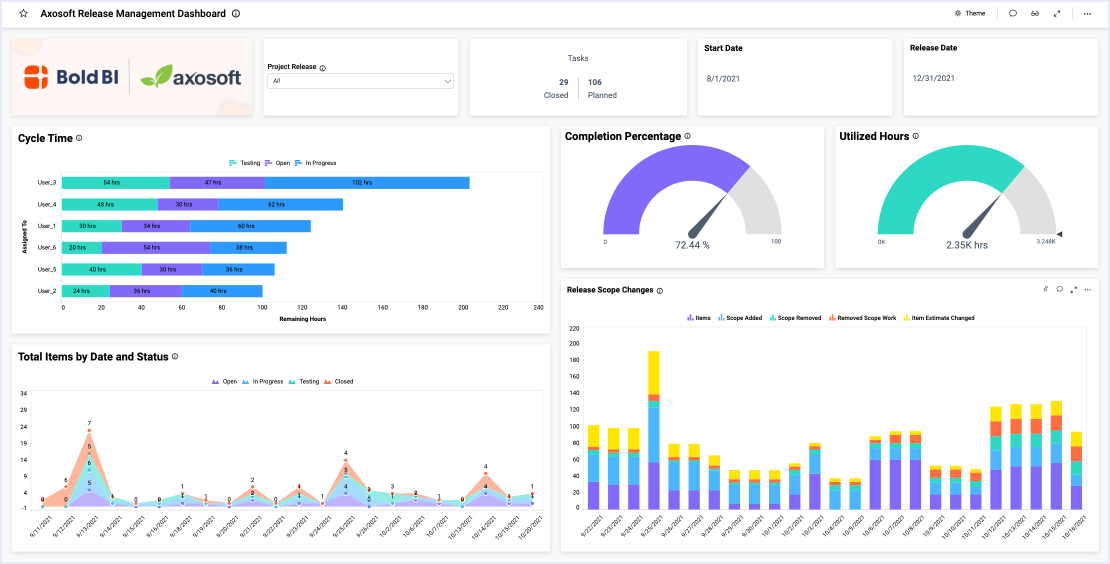
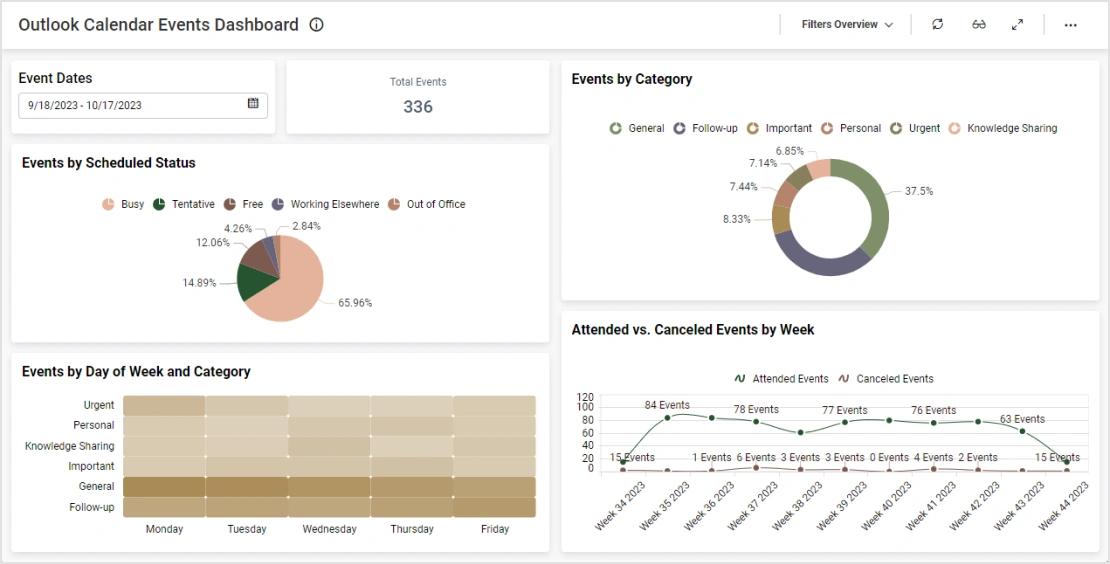
This Podio Project Tracking Dashboard allows professionals to thoroughly track a wide range of tasks based metrics. With this embedded dashboard, professionals can answer the following questions:
Firstly, how many hours did it take to complete a project?
Secondly, what is the total number of completed tasks versus incomplete tasks?
Thirdly, which project is producing the highest completion rate?
Finally, what is the total number of tasks by assignee?
First, this Podio Project Management dashboard places data into engaging graphs, from pie charts to radial gauges. As a result, professionals can see a project's strengths and weaknesses, and they can build processes to better improve systems. In addition, our dashboard captures data sets around incomplete and overdue tasks. Consequently, team leaders can quickly identify problems surrounding a project.
Next, this dynamic project tracking dashboard offers easy to access data points. For example, leaders can look at real-time stats surrounding the number of active projects, average task cycle time, percentage of tasks completed by deadline, and actual versus estimated hours. Therefore, leaders can make necessary decisions to improve project productivity.
Finally, project tracking dashboards like this one give a colorful heat map and easy to read grid. For instance, the heat map shows a distribution of workload, such as total number of tasks by assignee and tasks priority, and the grid map returns tasks summary details. In summary, access to this data helps leaders see high level stats by project and key completion dates.
Further, our robust dashboard gives a filter option to help sort through the wealth of data. By selecting a project from the drop-down box, leaders can track metrics by project. In short, check out this embedded dashboard for project tracking example concerning your metrics to learn how Bold BI's solutions can help your team.
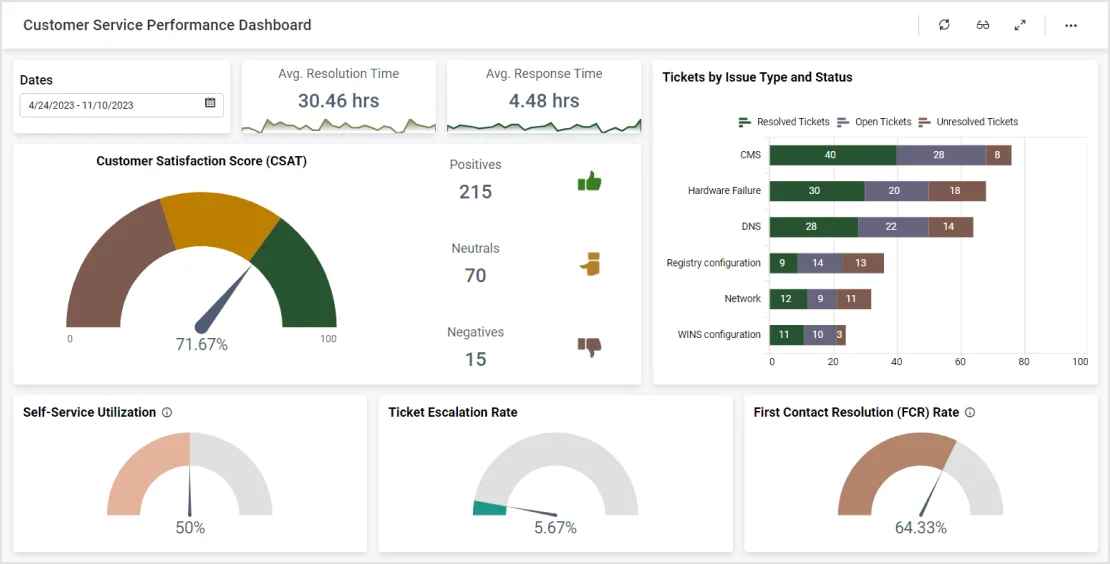
This customer service performance dashboard provides a detailed breakdown of an IT team's operations. With this ...
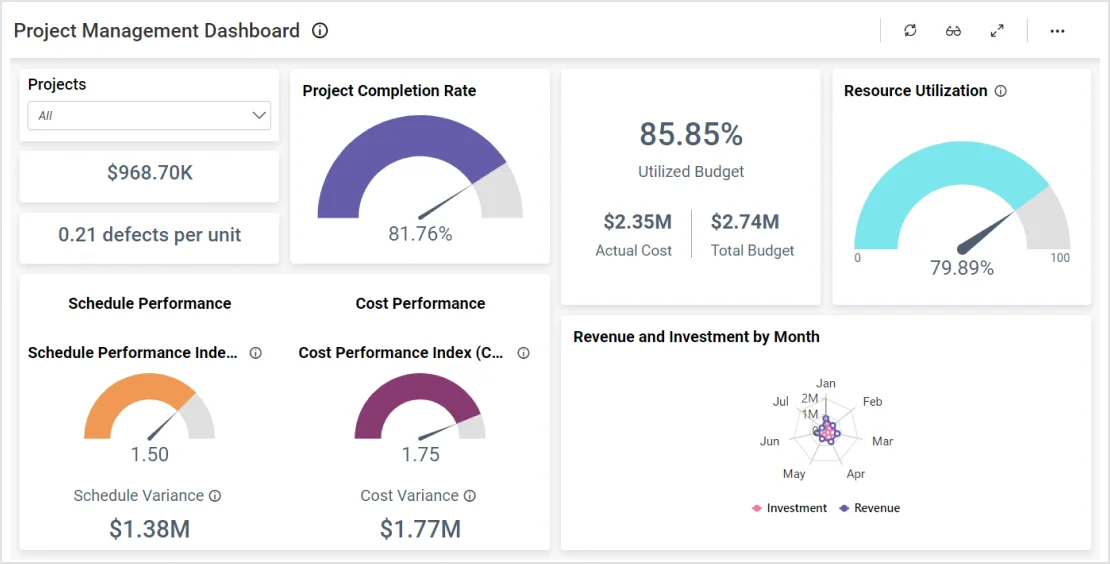
Learn More View DashboardBold BI’s project management dashboard outlines the financial health of an IT company. Further, it displays detailed....
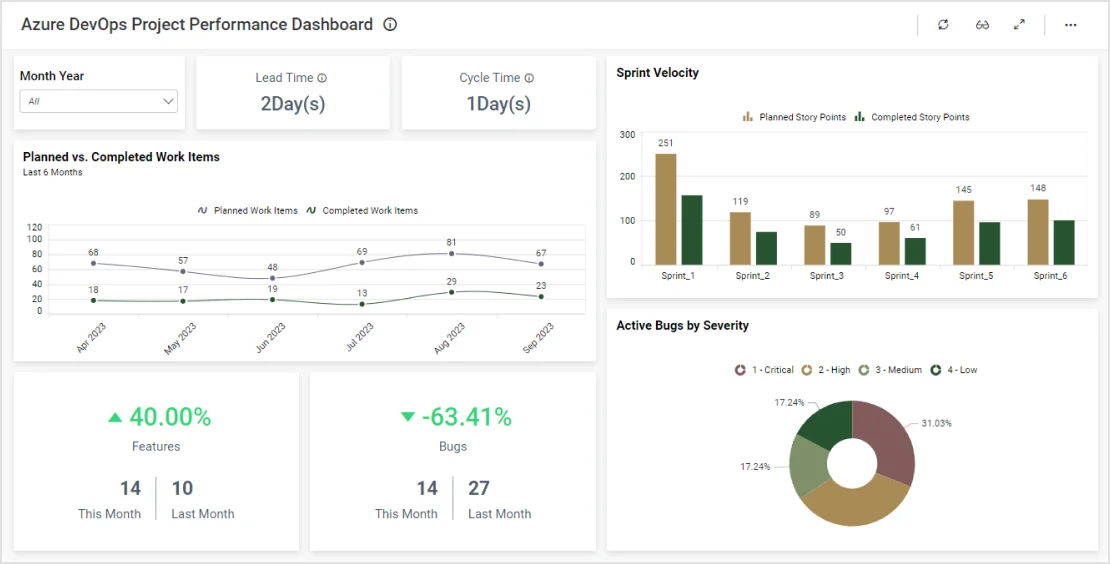
Learn More View DashboardThis project performance dashboard provides an overview of an IT team's sprint tasks. With this Azure DevOps dashboard...
Learn More View DashboardThis Asana project dashboard provides an overview of a team's projects and tasks. With this IT operations dashboard, we can ...
Learn More View DashboardThis issue tracker dashboard provides a detailed overview of a team’s created and closed issues. With this dashboard, we can answer...
Learn More View DashboardThis forum management dashboard allows moderators to track key metrics relating to threads and forums. With this dashboard, we can answer...
Learn More View DashboardThis Axosoft release management dashboard allows product managers to track key product release metrics.
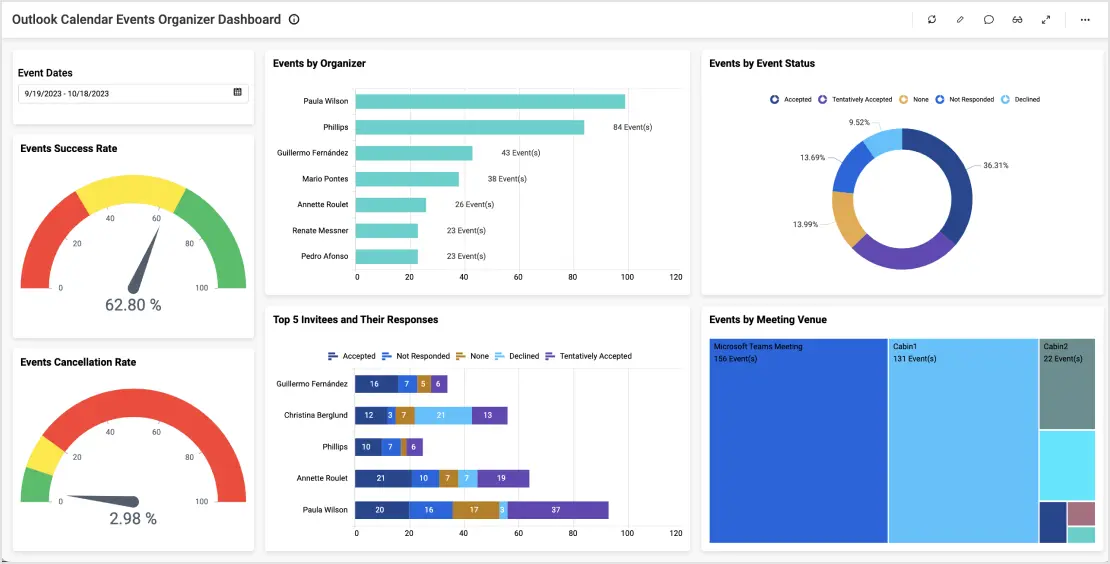
Learn More View DashboardThis Outlook calendar events dashboard helps team members optimize their daily activities. With this dashboard, we can ...
Learn More View DashboardThis Outlook calendar organizer dashboard helps team members optimize their daily activities. With this dashboard, we can answer the following...
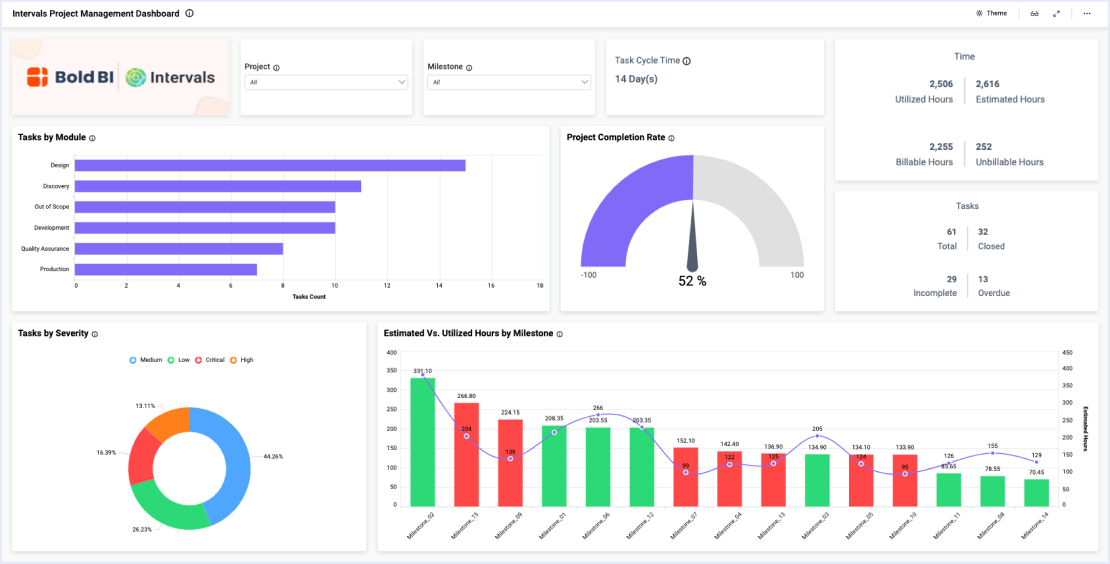
Learn More View DashboardThe Intervals Project Management dashboard helps team members and managers organize, track, and measure the success of team projects and tasks.
Learn More View DashboardThis IT Toggl Project Time Tracking Dashboard allows professionals to thoroughly track a wide range of project based metrics. With this dashboard...
Learn More View DashboardThis Harvest Project Time Tracking Dashboard allows professionals to thoroughly track a wide range of tasks based metrics. With this dashboard...
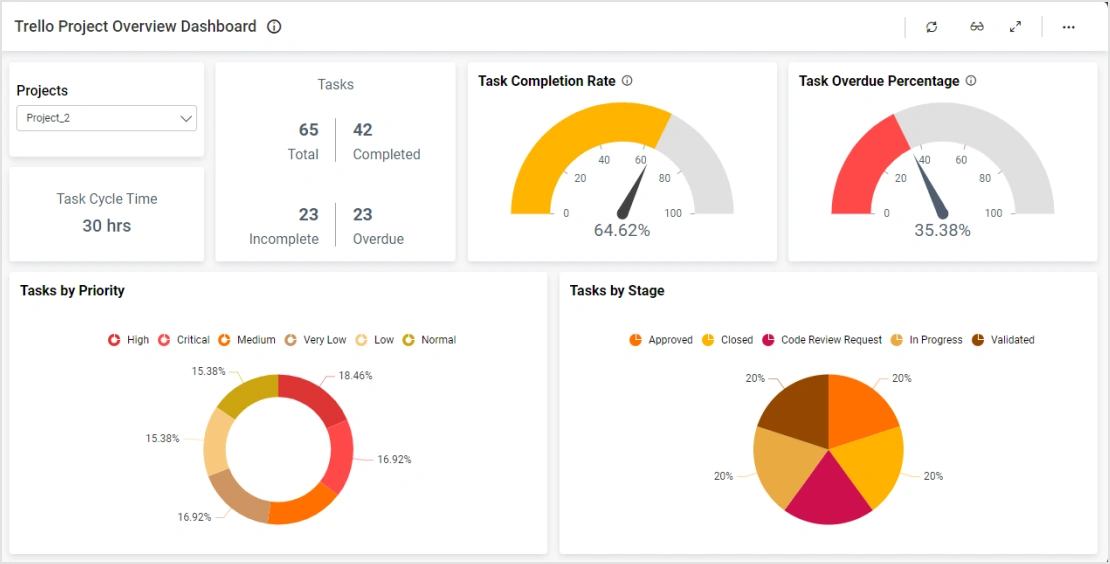
Learn More View DashboardThis Trello Project Overview Dashboard allows professionals to thoroughly track a wide range of tasks and project based metrics. With this dashboard...
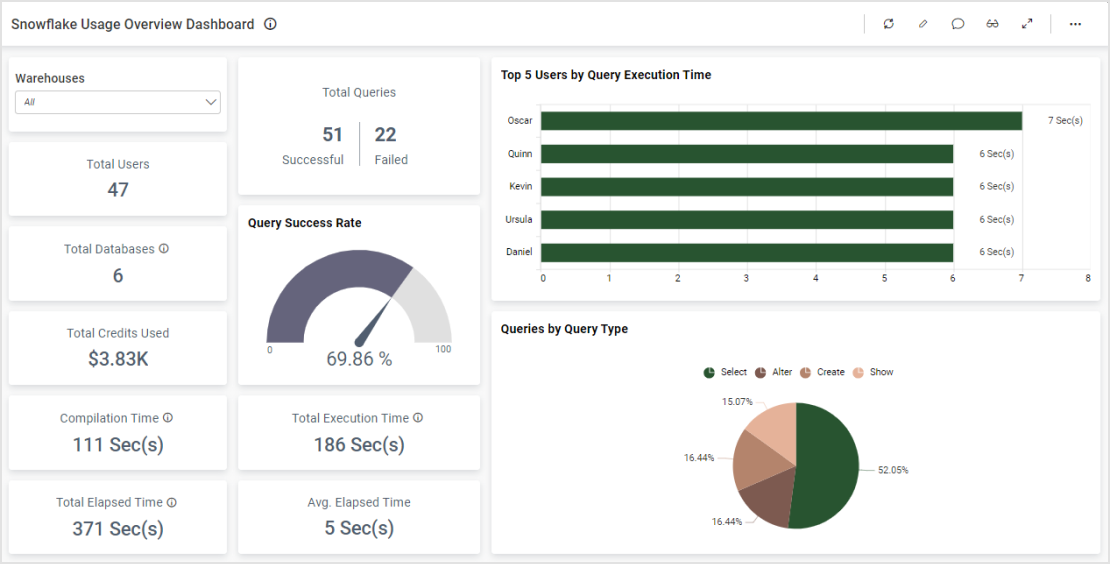
Learn More View DashboardThis Snowflake usage overview dashboard provides a detailed breakdown of their operational workflow. With this dashboard, we can answer…
Learn More View DashboardFrom evaluating equipment downtime to analyzing labor and production costs...
Learn MoreTry out all the features of Bold BI® with 30-day free trial and get to know how it suit to your needs of embedded analytics.
Platform