This LiveAgent Customer Support Dashboard displays various support ticket metrics. With it, you can answer the following questions:
What is your average first response time?
What is your average resolution time?
How many tickets are in progress, waiting for customer feedback, or complete?
How are your agents and departments performing overall?
The LiveAgent Customer Support Dashboard makes it easy to measure and track how responsive you are to customer needs through various KPIs. It's structured to give you a quick view of your major KPIs, such as total customers, average response time, and average resolution time. This helps you understand your support team's overall performance before digging into more targeted KPIs and metrics that provide additional insight.
As an example of the high-level and detailed information accessible in this dashboard, clicking on the Response Time and Resolution Time widgets opens a report of each with fully customizable columns. You can add columns such as owner email, department ID, date created, last activity, and more for an in-depth look at which factors are contributing more or less to your major KPIs.
Tooltips are a great way to make dashboards accessible to more everyone. The primary tooltip at the top explains the overall goals and stats shown in the support monitoring dashboard, while tooltips on individual widgets like Hours Worked by Agents can clarify a metric or KPI that is harder to understand for someone not familiar with either the dashboard or individual processes.
You can view the total number of tickets resolved compared to how many were opened in a selected time period, as well as how fast agents are providing a first response. The Resolved Tickets by Date line chart shows how consistently tickets are processed over time. Tracking how many tickets are opened in a given time period and how quickly agents can respond to them is a good measure of upcoming staffing needs for different periods throughout the year, for higher or lower ticket days such as a weekday or a weekend, or for gradual increases in ticket volume.
Viewing tickets by tag and status on the support monitoring dashboard shows strengths and opportunities in each category and stage of processing. A doughnut chart displays issues by ticket status, visualizes overall ticket progress for the selected time period. A helpful feature of this doughnut chart is that you can toggle statuses on and off to make it easier to compare two or more. For example, deselecting the Deleted and Resolved tags shows the distribution of all open ticket statuses.
A bar chart breaking down tickets by tags of Issue, Support, Pre-Sale, and Status enables managers to better allocate resources to each ticket tag or type depending on which tag has more tickets that aren't resolved. This module can be expanded to full screen as additional data points are added. Clicking on individual bars opens a report view to show a list of tickets with that tag and status.
Three widgets on the support monitoring dashboard provide details about the employees processing tickets. The Tickets by Department widget shows how each team or department is performing against their KPIs to give better insight into different types of issues being worked on.
You can get a deeper view with the Tickets by Agent and Hours Worked by Agents widgets to understand how productive individual agents are in resolving customer issues. The latter is broken down into horizontal bar charts to identify at a quick glance both the number of hours worked and how many hours agents are working in relation to each other.
Clicking on one of the bars in the Tickets by Agent widget shows a report of all current tickets for that agent. You can also customize what shows up on this report to better understand why an agent or status is more or less active by selecting different data points.
Several metrics allow you to better understand who is opening tickets and where they are coming from. You can break down ticket origins by country, age, and more to best address customer needs and allocate resources where needed.
Further, you can use the Tickets by Channel widget to understand where people are opening tickets, such as via email, forums, or phone calls. This information helps you better understand your customers' preferences.
Leaders can filter the support monitoring dashboard’s data using the date filter. Filtering is a key way to understand how each metric is impacting your KPIs. This dashboard allows for global filtering by the date a ticket was opened. Shorter or longer time periods and help pinpoint specific problems or show you when broad trends appear.
You can also add filters like department so that managers and directors can better understand individual and group performance. It's important to make sure filters are as high level as possible so they don't conflict with each other.
Filtering information can reveal trends and opportunities for improvement over time. Check out Bold BI’s other embedded dashboards for support agent activities to learn more.
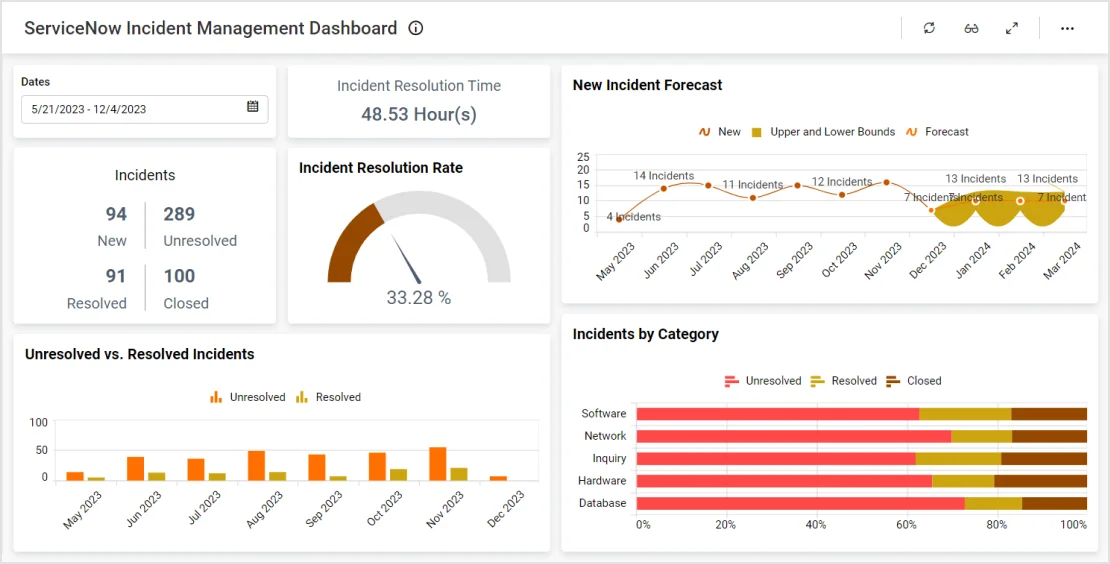
This ServiceNow dashboard provides an overview of key support metrics. With this dashboard…
Learn More View DashboardThis call tracking dashboard provides an overview of key call and message details. With this dashboard…
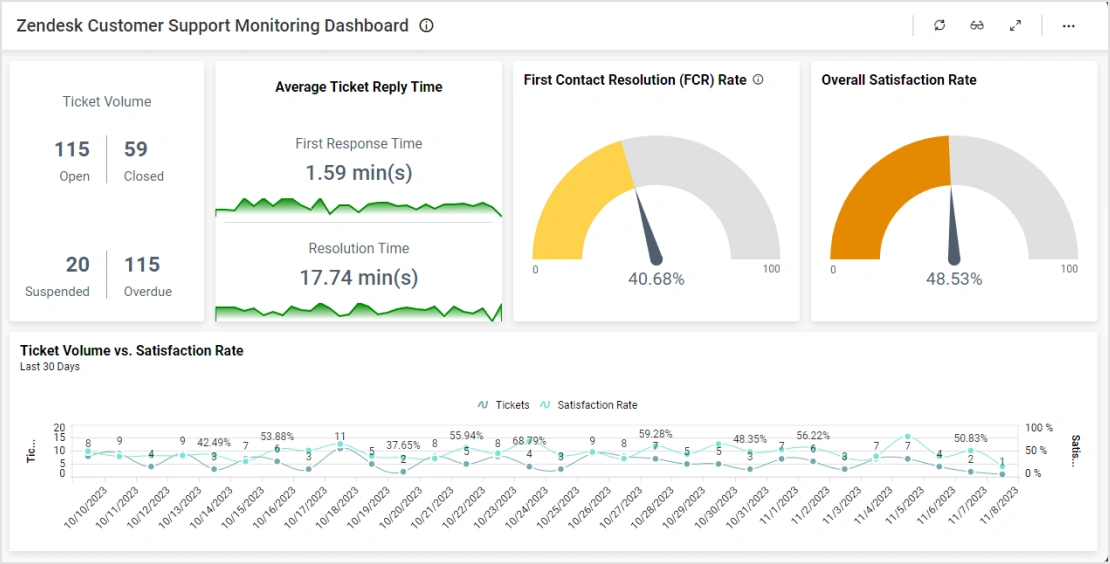
Learn More View DashboardThis Zendesk support monitoring dashboard displays key support ticket metrics. With this dashboard…
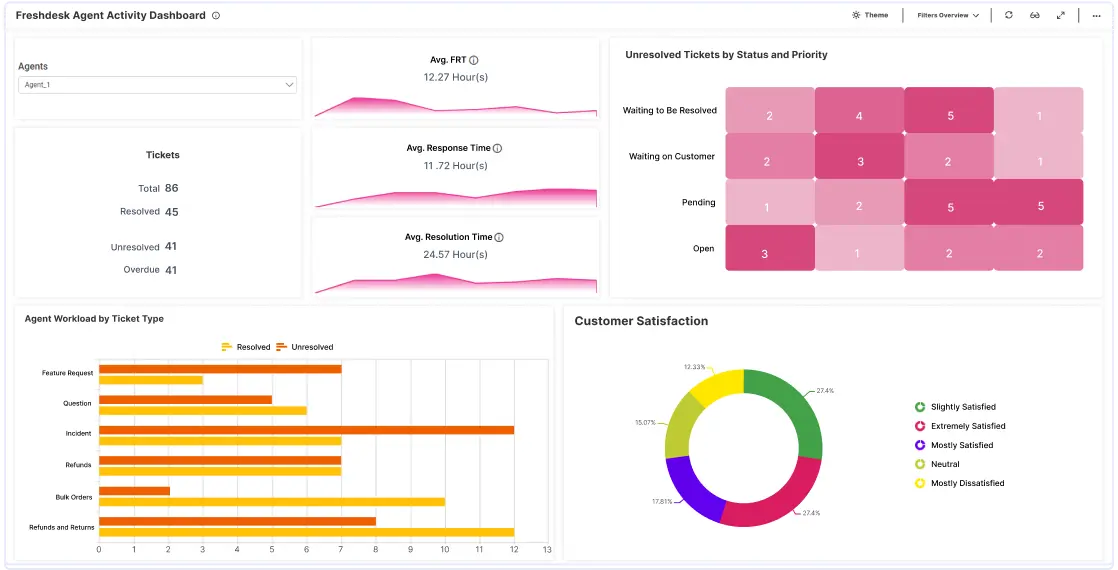
Learn More View DashboardThis agent activity dashboard displays various support ticket metrics. With this dashboard…
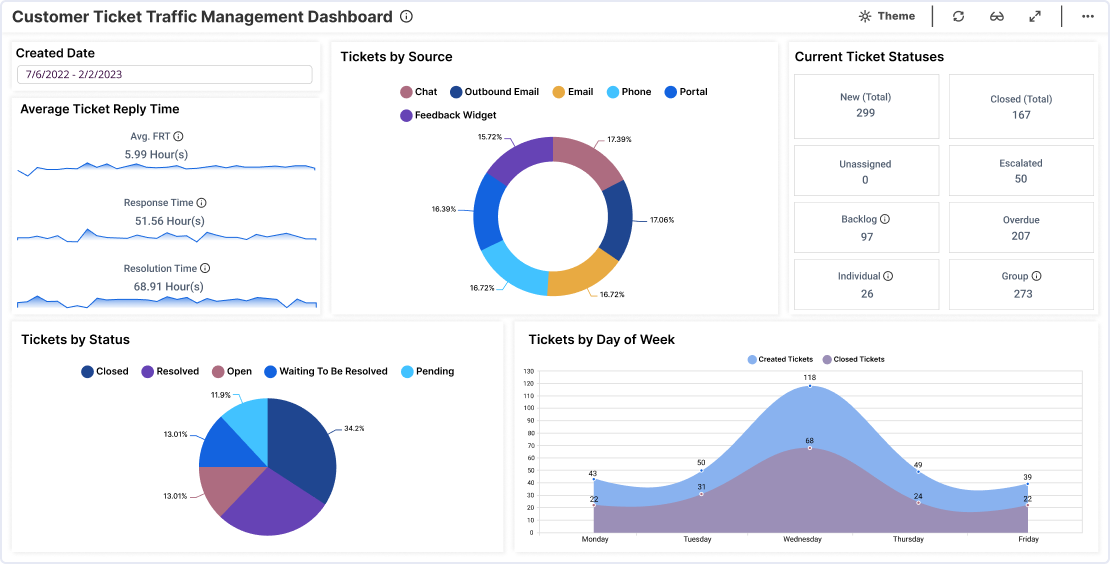
Learn More View DashboardThis ticket traffic management dashboard displays various support ticket and customer satisfaction KPIs. With this dashboard…
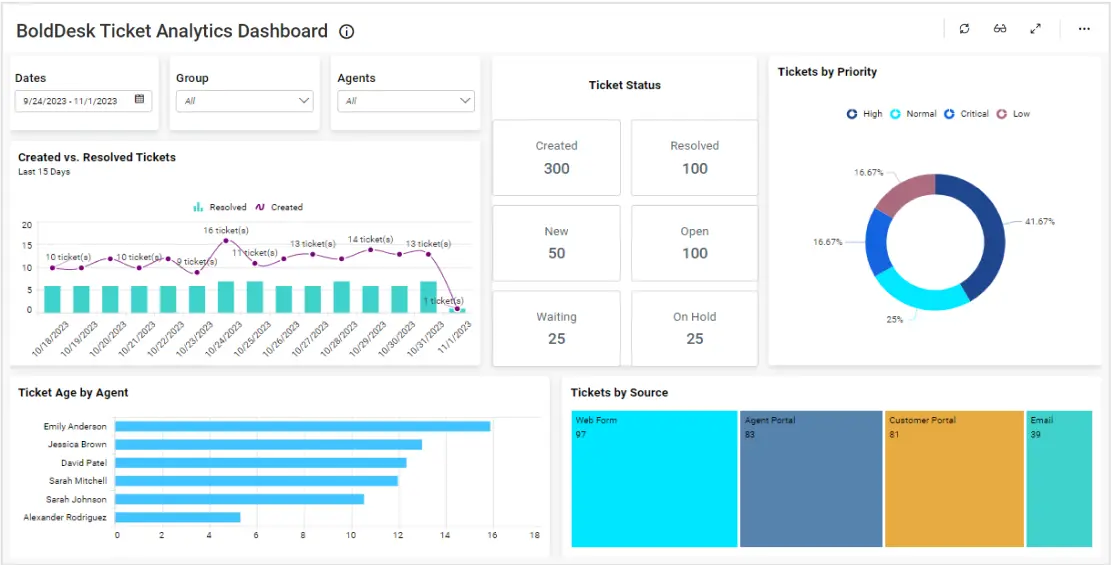
Learn More View DashboardThis BoldDesk dashboard provides an overview of a company’s support team performance. With this dashboard, we can answer…
Learn More View DashboardThis Nicereply customer satisfaction dashboard provides a detailed breakdown of customer support efforts. With this dashboard, we can answer…
Learn More View DashboardTry out all the features of Bold BI® with 30-day free trial and see how it suits your embedded analytics needs.
Platform