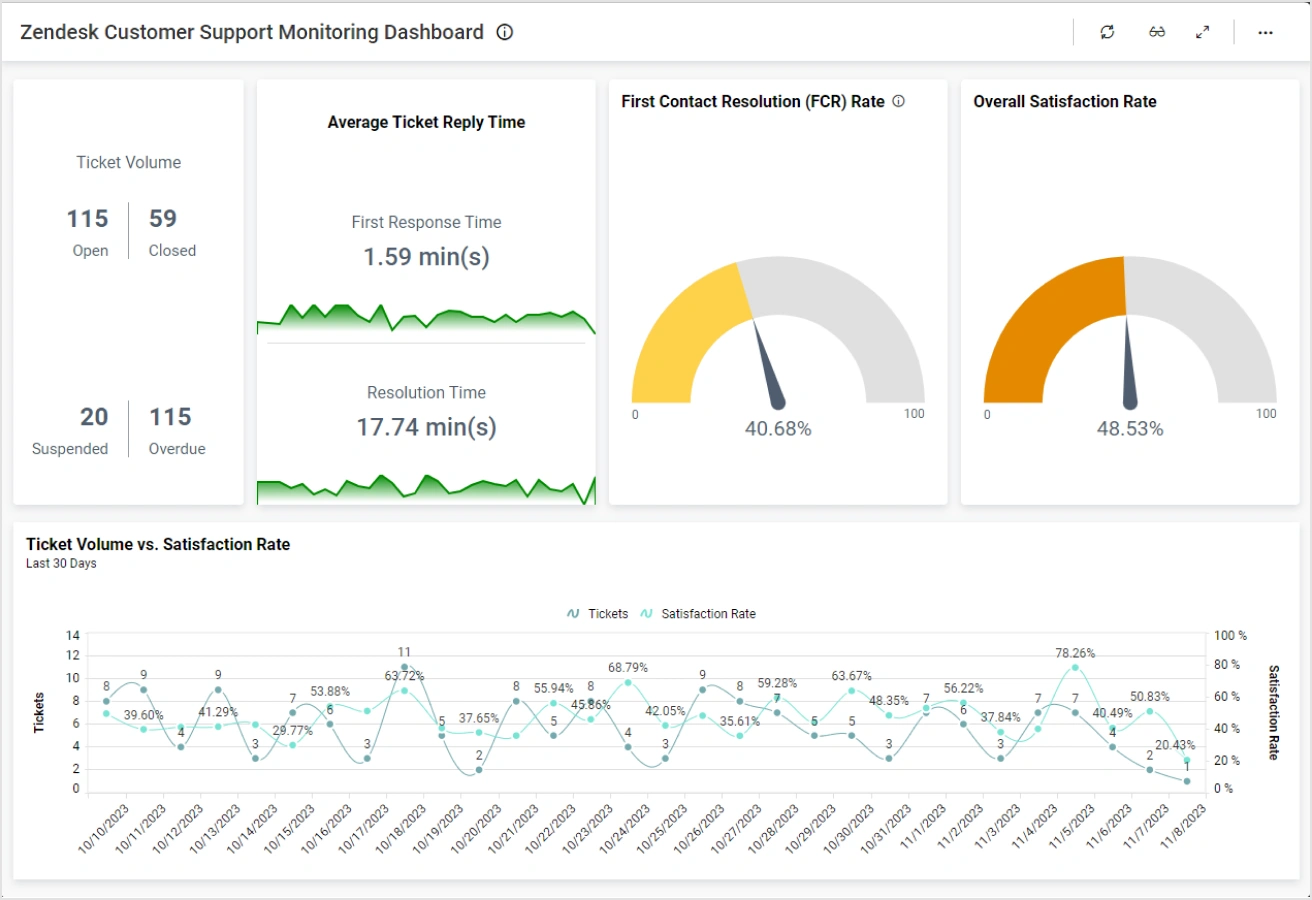
This Zendesk support monitoring dashboard displays key support ticket metrics. With this dashboard, we can answer the following questions:
Firstly, how many tickets are created, opened, and closed?
Secondly, what is our satisfaction rate?
Thirdly, how do our tickets break down by type?
Finally, how do our tickets break down by channel and priority?
With this support monitoring dashboard, leaders can track the team’s number of created, open, and closed tickets over the past 7 days and over the past 30 days. A card widget also displays the team’s customer satisfaction rate. Similarly, the Ticket Count vs Satisfaction Rate widget displays the number of tickets and the team’s customer satisfaction rate for the current month.
Then, the Tickets by Type bar chart shows how many tickets are feature requests, bugs, and sales enquiries. Finally, the Tickets by Channel and Tickets by Priority doughnut charts provide additional details regarding the tickets submitted.
This data can help support teams successfully address customers’ concerns to ensure their satisfaction with the company.
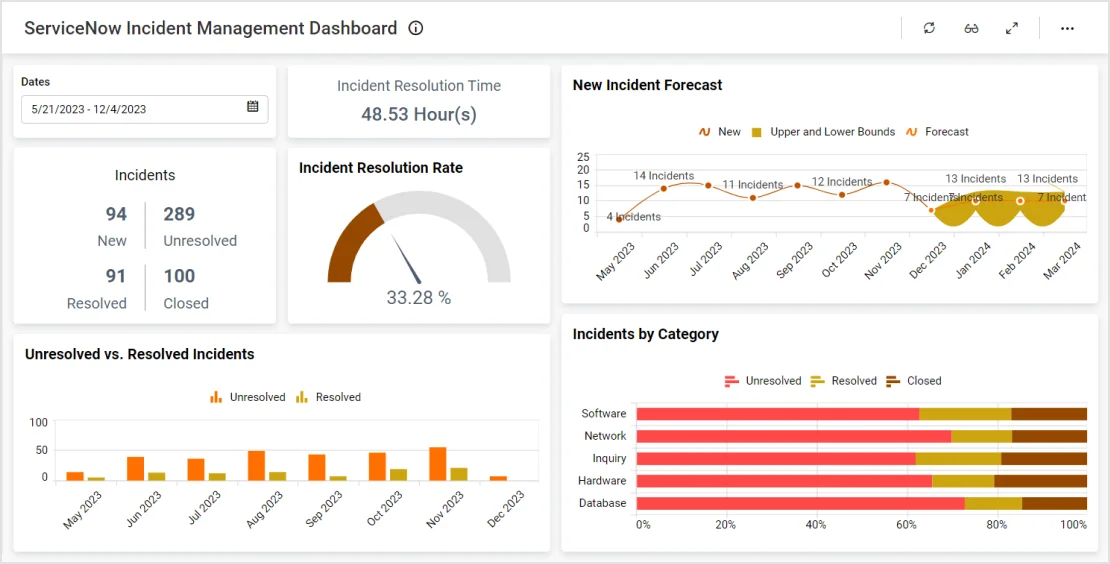
This ServiceNow dashboard provides an overview of key support metrics. With this dashboard…
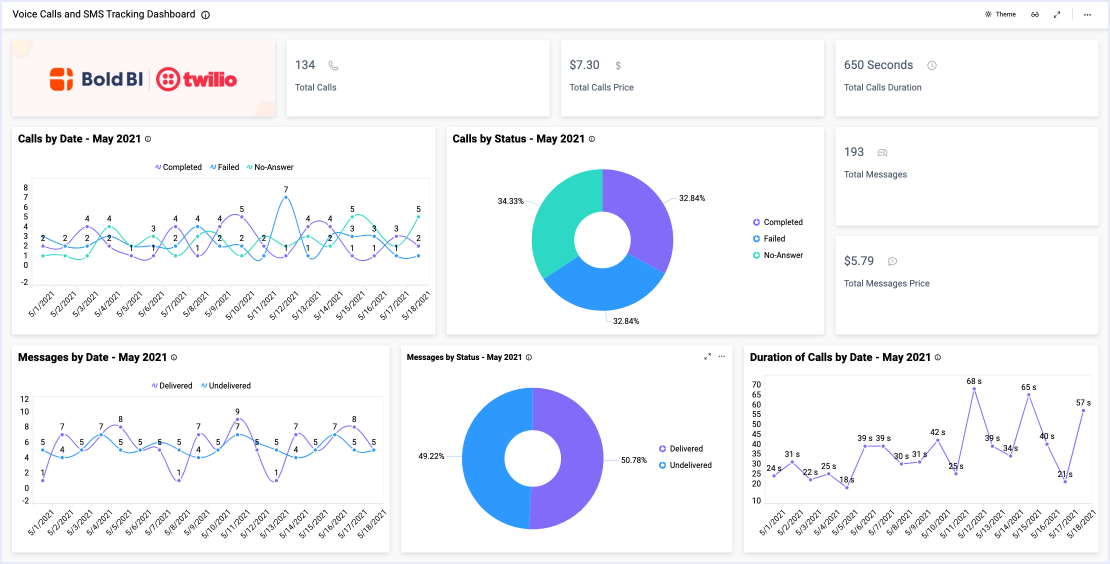
Learn More View DashboardThis call tracking dashboard provides an overview of key call and message details. With this dashboard…
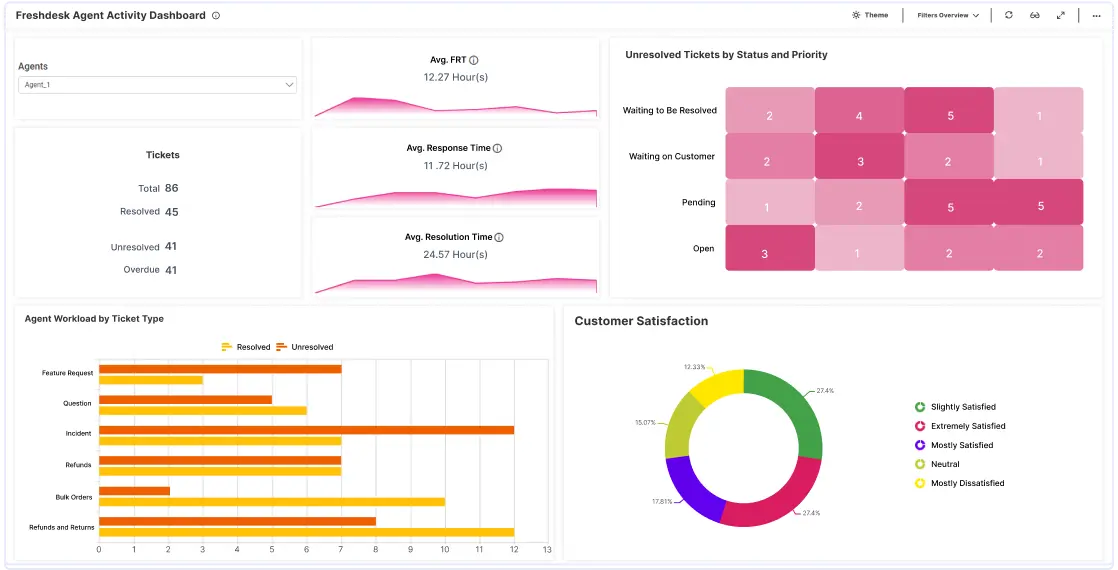
Learn More View DashboardThis agent activity dashboard displays various support ticket metrics. With this dashboard…
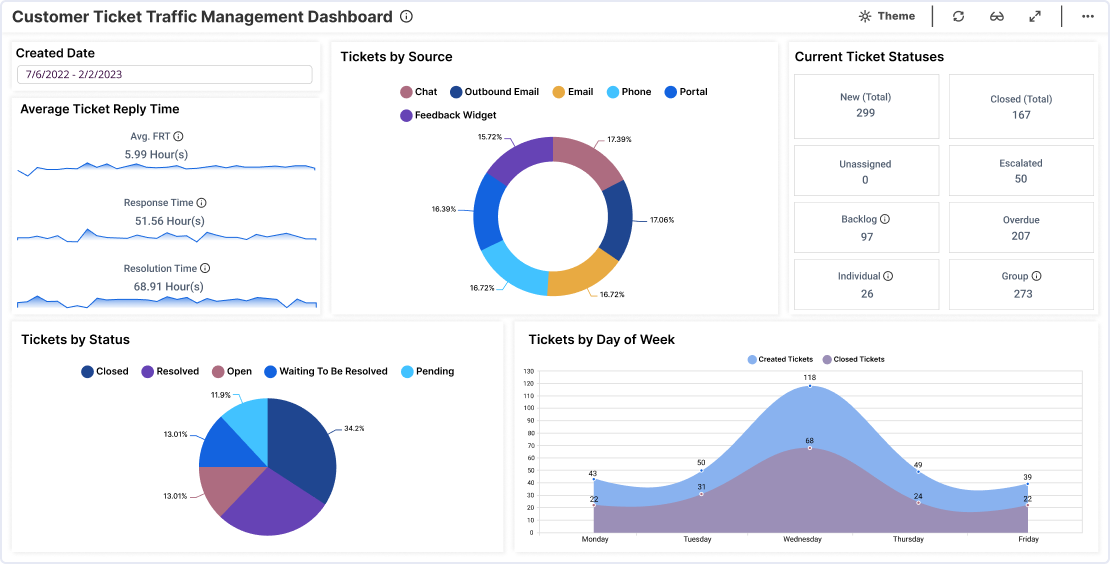
Learn More View DashboardThis tickets traffic management dashboard displays various support ticket and customer satisfaction KPIs. With this dashboard…
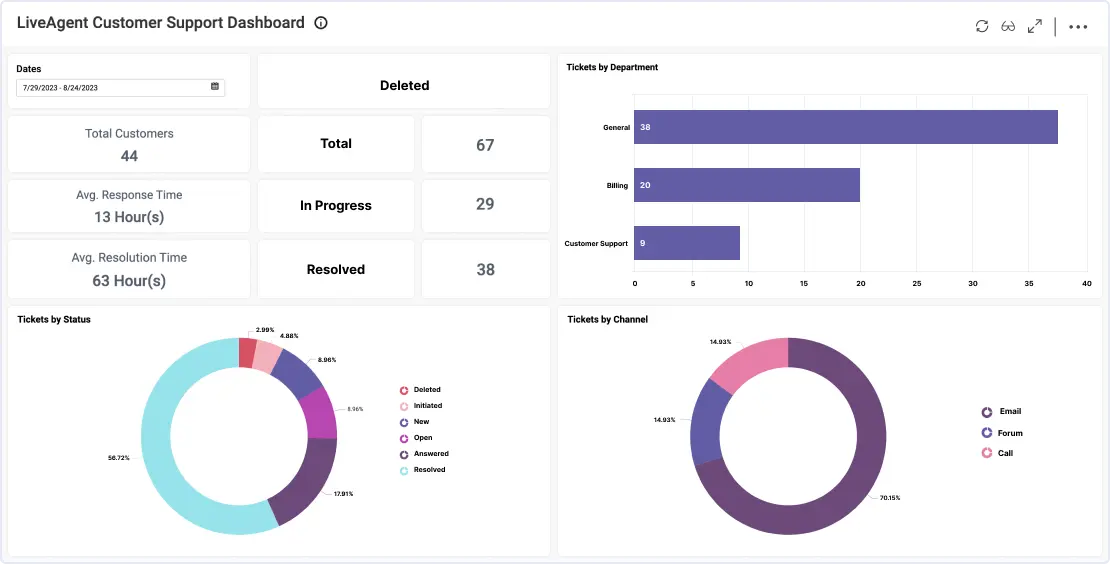
Learn More View DashboardThis LiveAgent Customer Support Dashboard displays various support ticket metrics. With it, you can answer the following ...
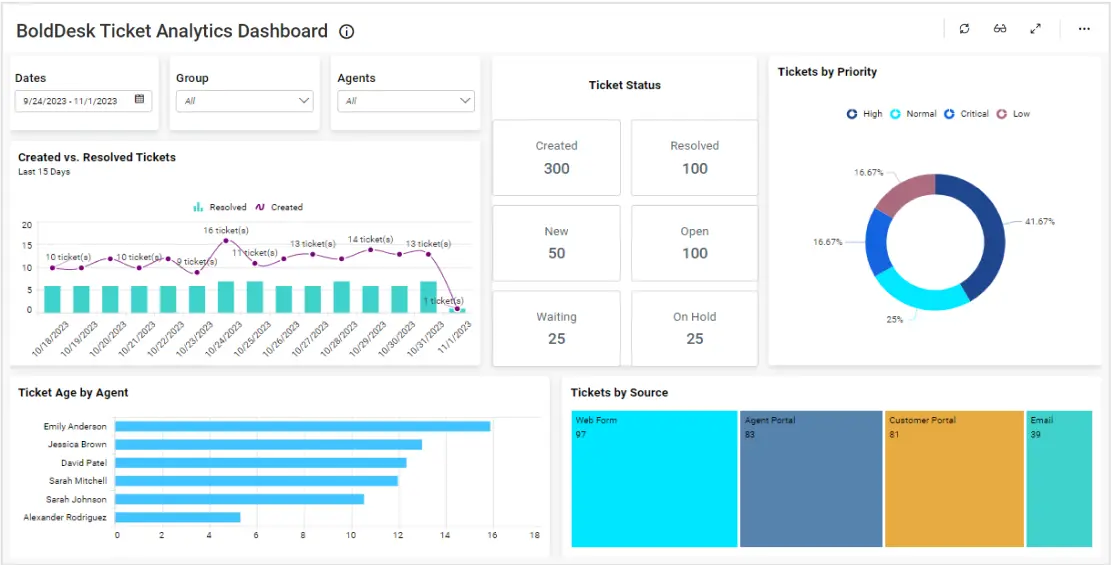
Learn More View DashboardThis BoldDesk dashboard provides an overview of a company’s support team performance. With this dashboard, we can answer…
Learn More View DashboardThis Nicereply customer satisfaction dashboard provides a detailed breakdown of customer support efforts. With this dashboard, we can answer…
Learn More View DashboardTry out all the features of Bold BI® with 30-day free trial and get to know how it suit to your needs of embedded analytics.
Platform