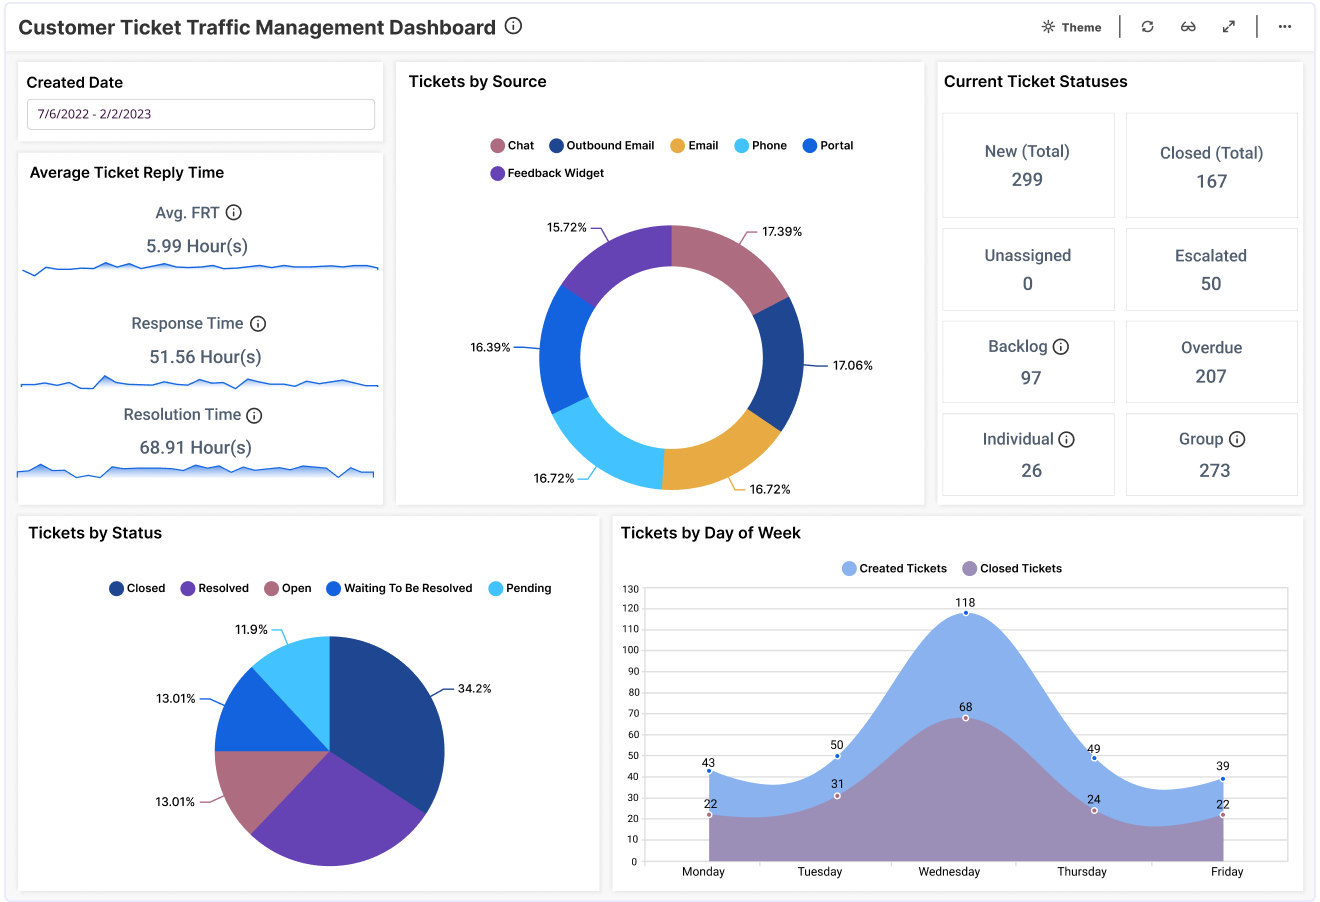
This tickets traffic management dashboard displays various support ticket and customer satisfaction KPIs. With this dashboard, we can answer the following questions:
Firstly, what is our customer satisfaction rate?
Secondly, what is our customer retention rate?
Thirdly, what is our average resolution time?
Finally, what is our first contact resolution rate?
With this embedded dashboard example for Freshdesk customer support, you can track key customer satisfaction metrics. For example, at the top of the dashboard, viewers can see the team’s customer satisfaction rate and net promoter score. They can also see their first contact resolution rate and customer retention rate. Then, leaders can see the company’s churn rate and customer satisfaction ratings (positive, negative, or neutral). This data is critical for leaders who need to ensure that customers are happy with the team’s service and that support tickets are quickly addressed.
Firstly, with the card widgets at the top of the dashboard, leaders can see the team’s first response time, along with the number of tickets received in the past month. Other widgets display tickets by source, priority, and type and status, offering detailed breakdowns of the team’s workload.
Then, with the Tickets Logged by Month spline chart, leaders can track the number of logged and resolved tickets for the past six months. The Resolved Ticket by Group chart offers additional insight into which groups have solved the most tickets, along with their total numbers of tickets. Similarly, the Average Resolution Time by Type chart outlines the typical resolution time for each type of ticket, allowing the team to plan accordingly for their workload.
This data can help support teams ensure they are quickly addressing customers’ concerns and prioritizing their tasks effectively. Check out Bold BI’s embedded dashboard example for Freshdesk customer support to learn more about how dashboards can help your team.
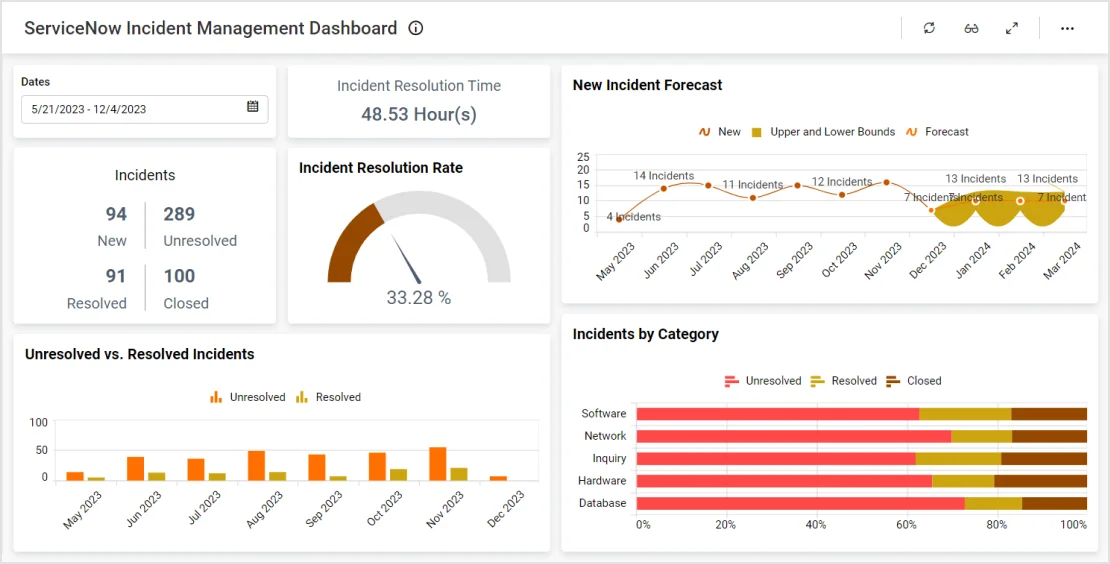
This ServiceNow dashboard provides an overview of key support metrics. With this dashboard…
Learn More View DashboardThis call tracking dashboard provides an overview of key call and message details. With this dashboard…
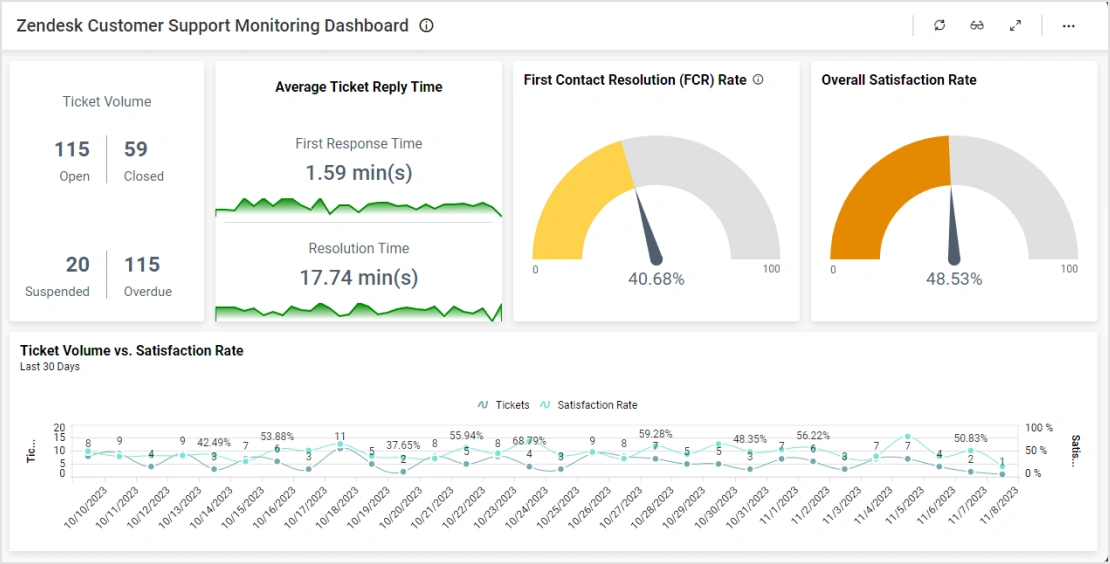
Learn More View DashboardThis Zendesk support monitoring dashboard displays key support ticket metrics. With this dashboard…
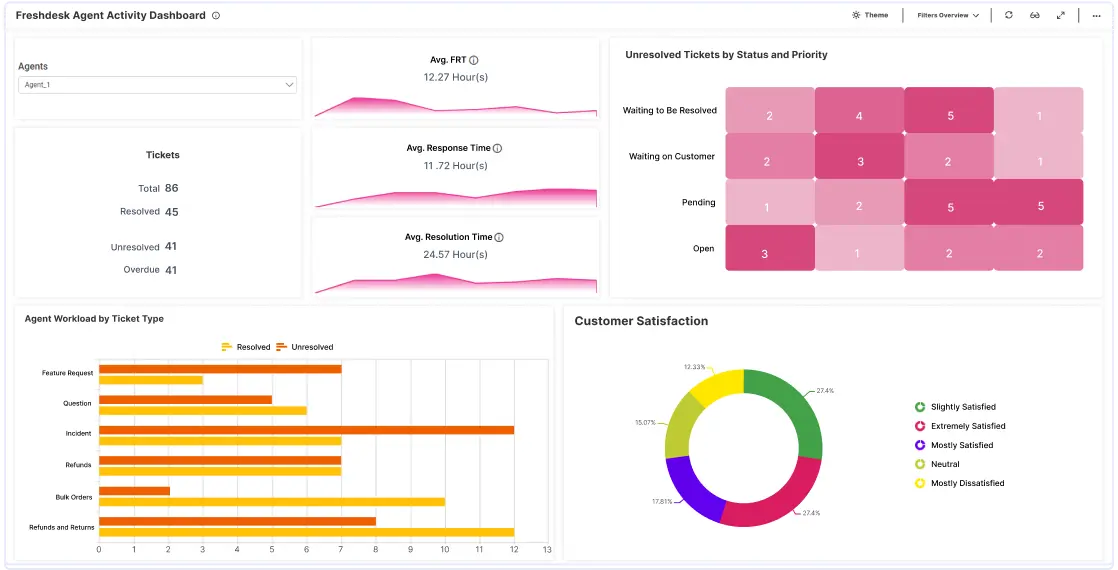
Learn More View DashboardThis agent activity dashboard displays various support ticket metrics. With this dashboard…
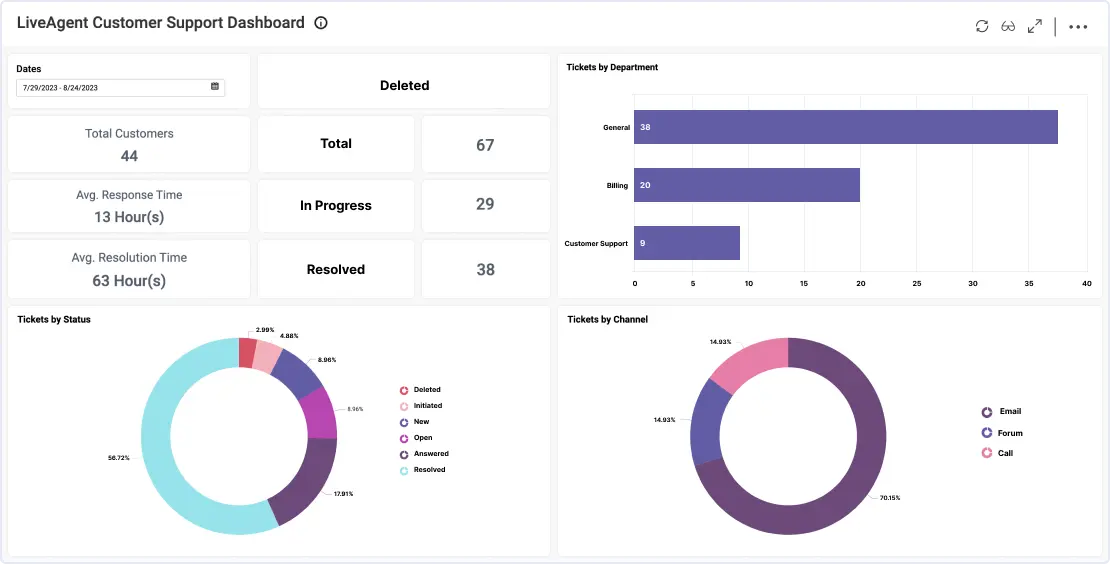
Learn More View DashboardThis LiveAgent Customer Support Dashboard displays various support ticket metrics. With it, you can answer the following ...
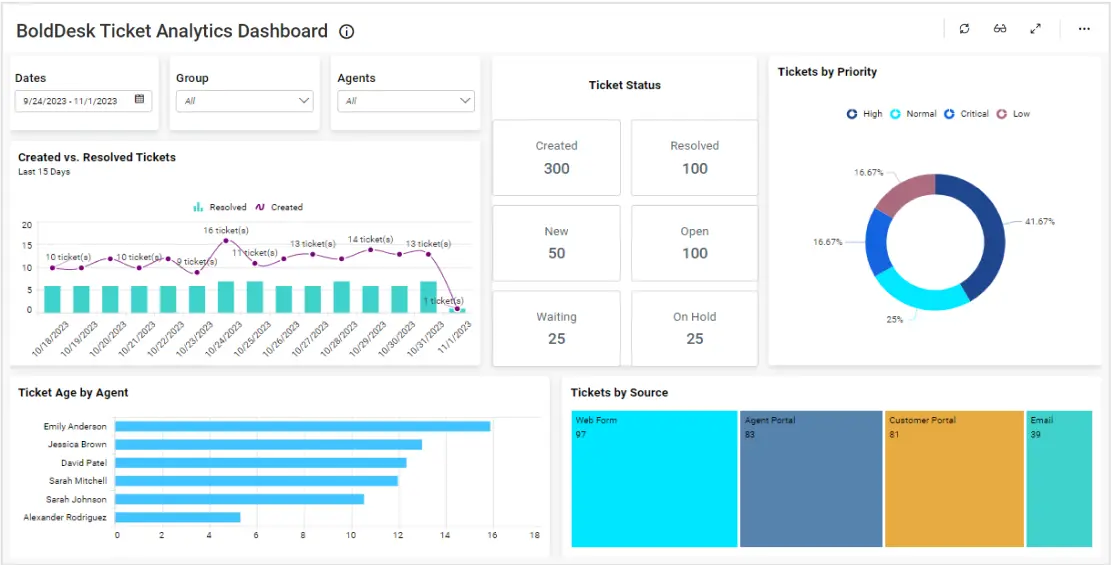
Learn More View DashboardThis BoldDesk dashboard provides an overview of a company’s support team performance. With this dashboard, we can answer…
Learn More View DashboardThis Nicereply customer satisfaction dashboard provides a detailed breakdown of customer support efforts. With this dashboard, we can answer…
Learn More View DashboardTry out all the features of Bold BI® with 30-day free trial and get to know how it suit to your needs of embedded analytics.
Platform