
Introduction
Enriching the presentation of your data is key to conveying information clearly. Rich text is one such tool for this purpose in a dashboard. In this blog, we’ll explore how to use rich text in dashboards to enhance your data presentation, ensuring your dashboards not only inform but also captivate your audience.
What is rich text?
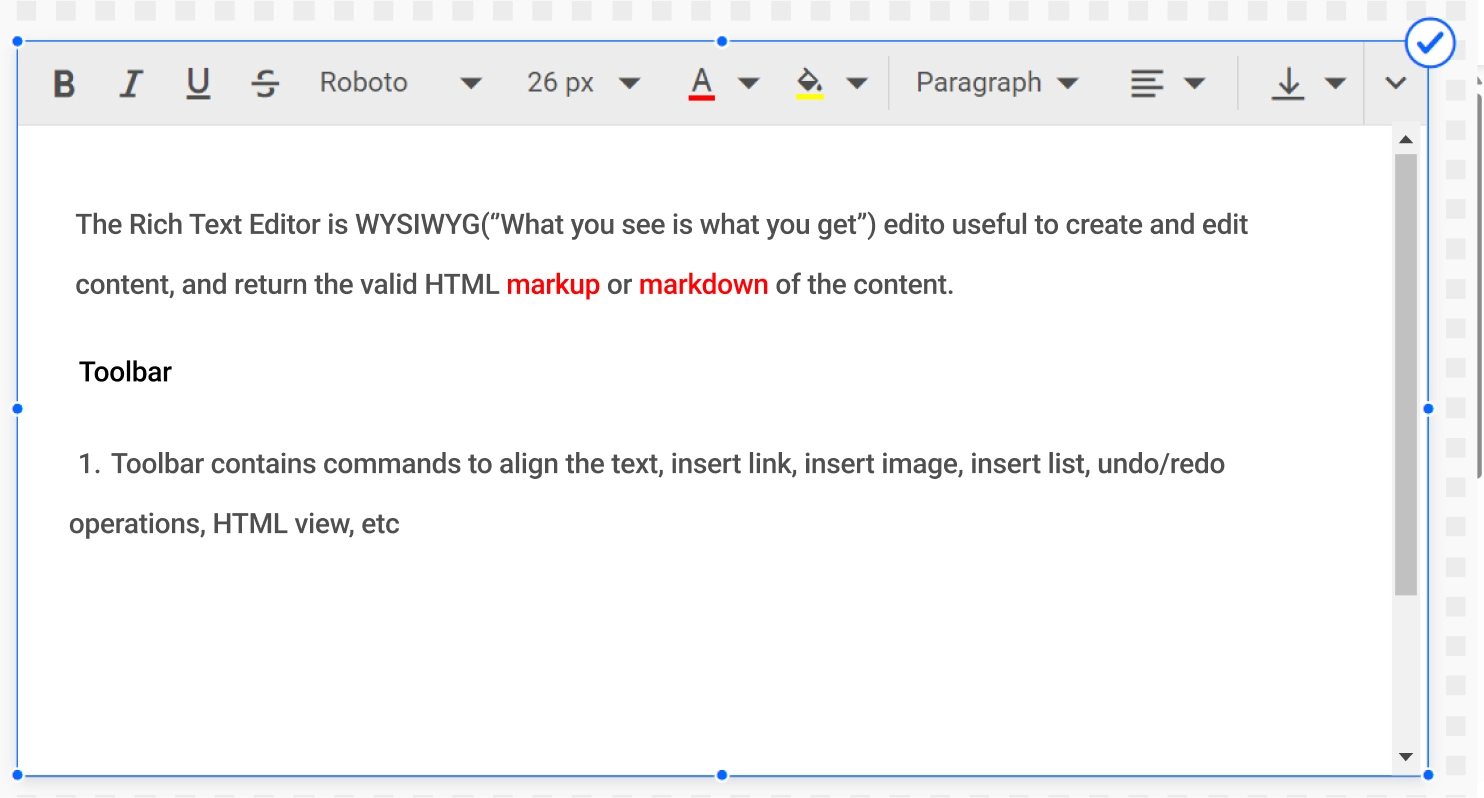
Rich text is text that is modified with style and formatting customizations like bold, underline, and italics. Depending on the software behind it, rich text may also support text colors, different font sizes, hyperlinks, and code blocks.
What is a text widget?
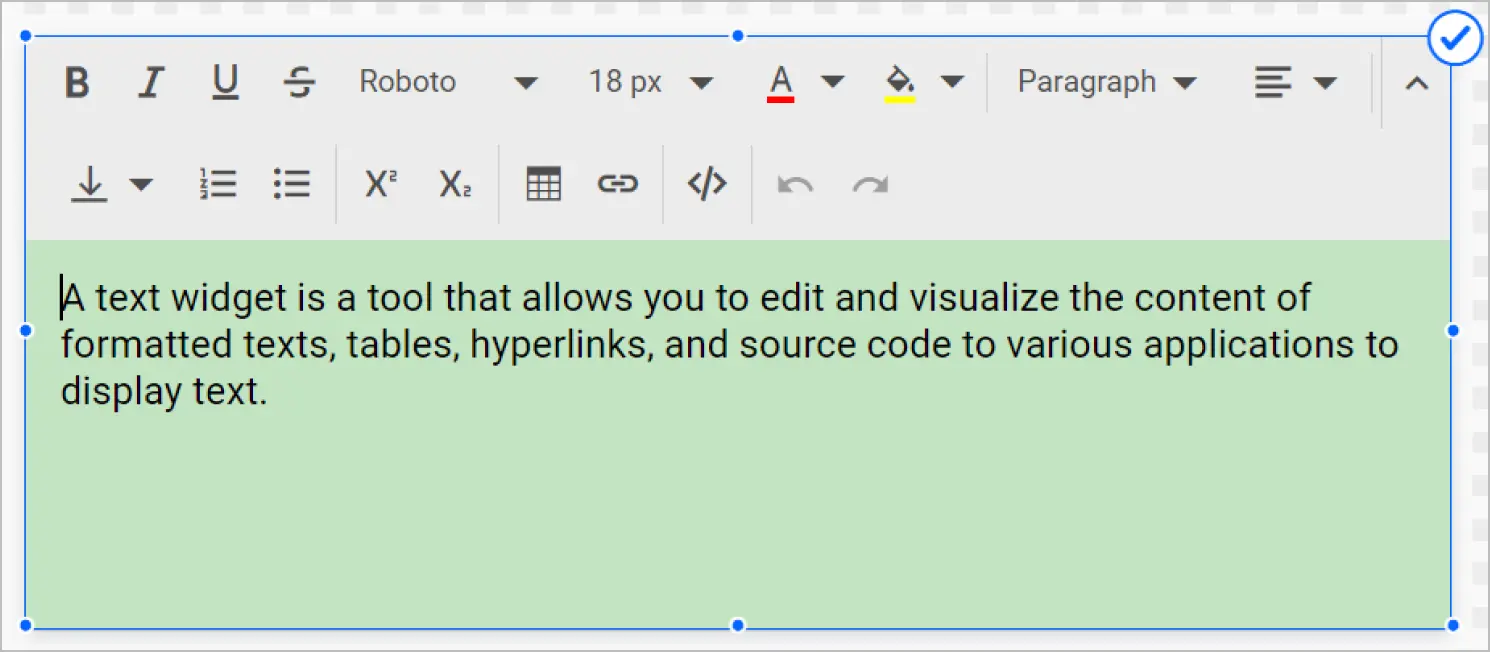
A text widget is an interactive editor that allows you to create and display rich text formatted with tables, hyperlinks, code, and more. Text widgets in dashboards facilitate easy data entry and presentation.
Features of the text widget in Bold BI
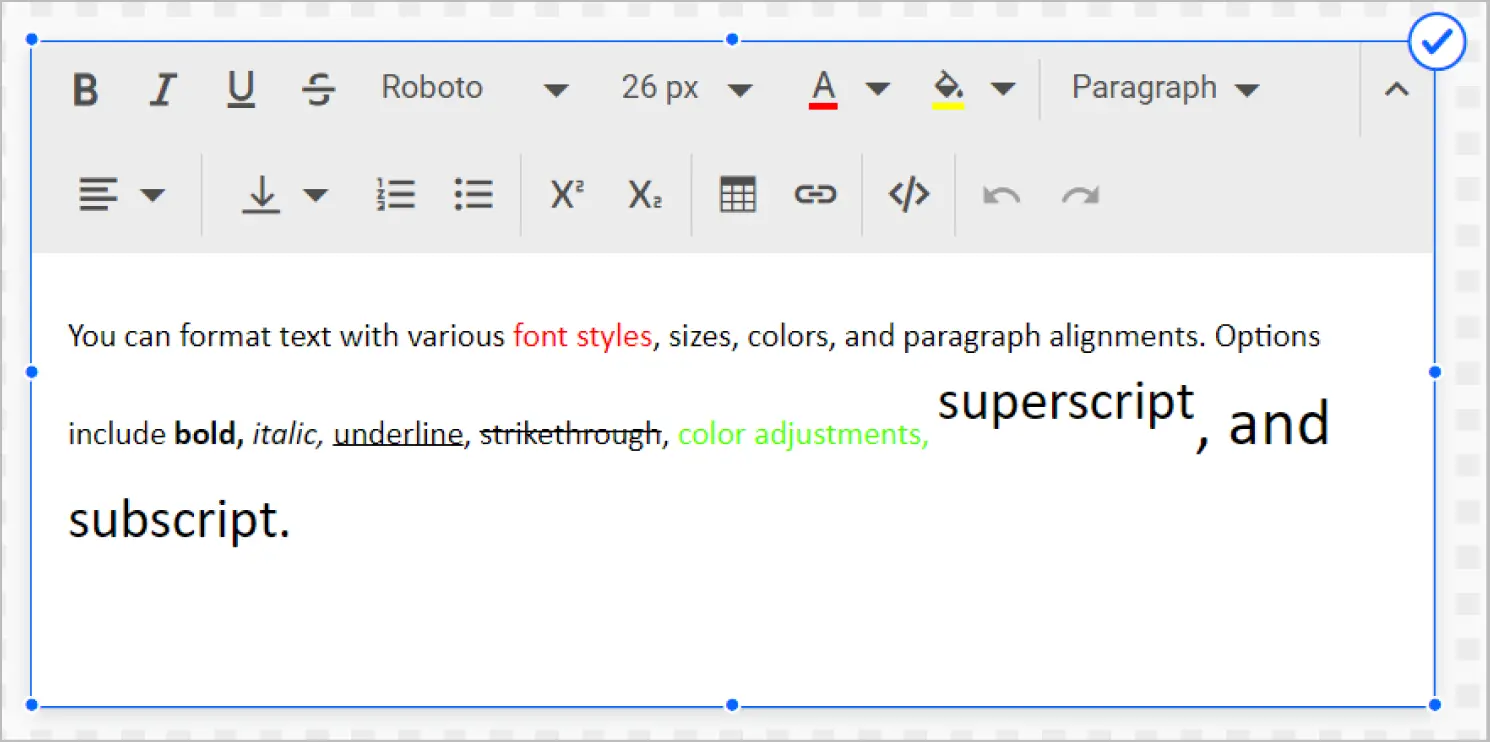
Font formatting: You can format text with various font styles, sizes, colors, and alignments, including bold, italic, underline, strikethrough, superscript, and subscript.
Background customization: You can customize the text’s background with images or colors and modify the background’s transparency settings.
Toolbar modes: The Bold BI® text widget’s toolbar can be displayed inline to reduce the amount of space it occupies or floating to display the entire toolbar.
Hyperlinks and tables: You can create and edit tables and insert hyperlinks while utilizing various customization options in the Bold BI text widget.
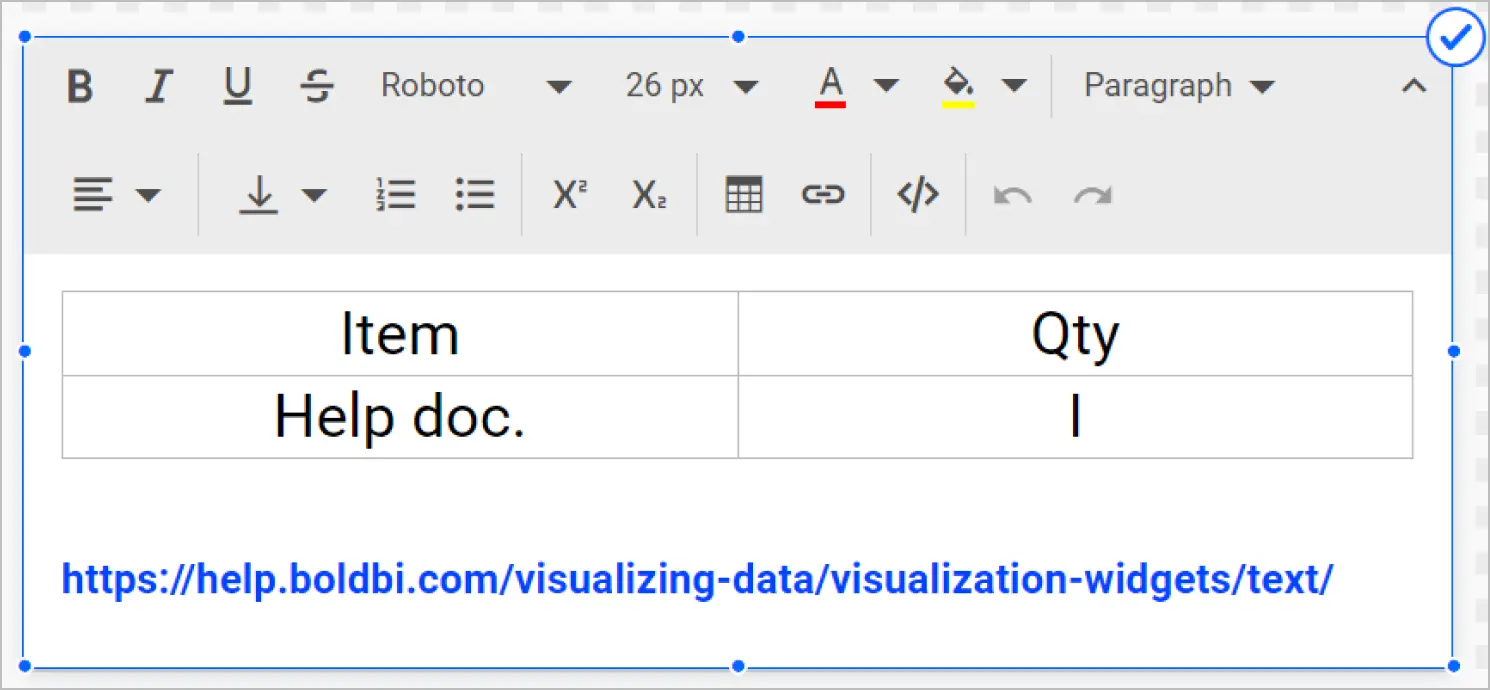
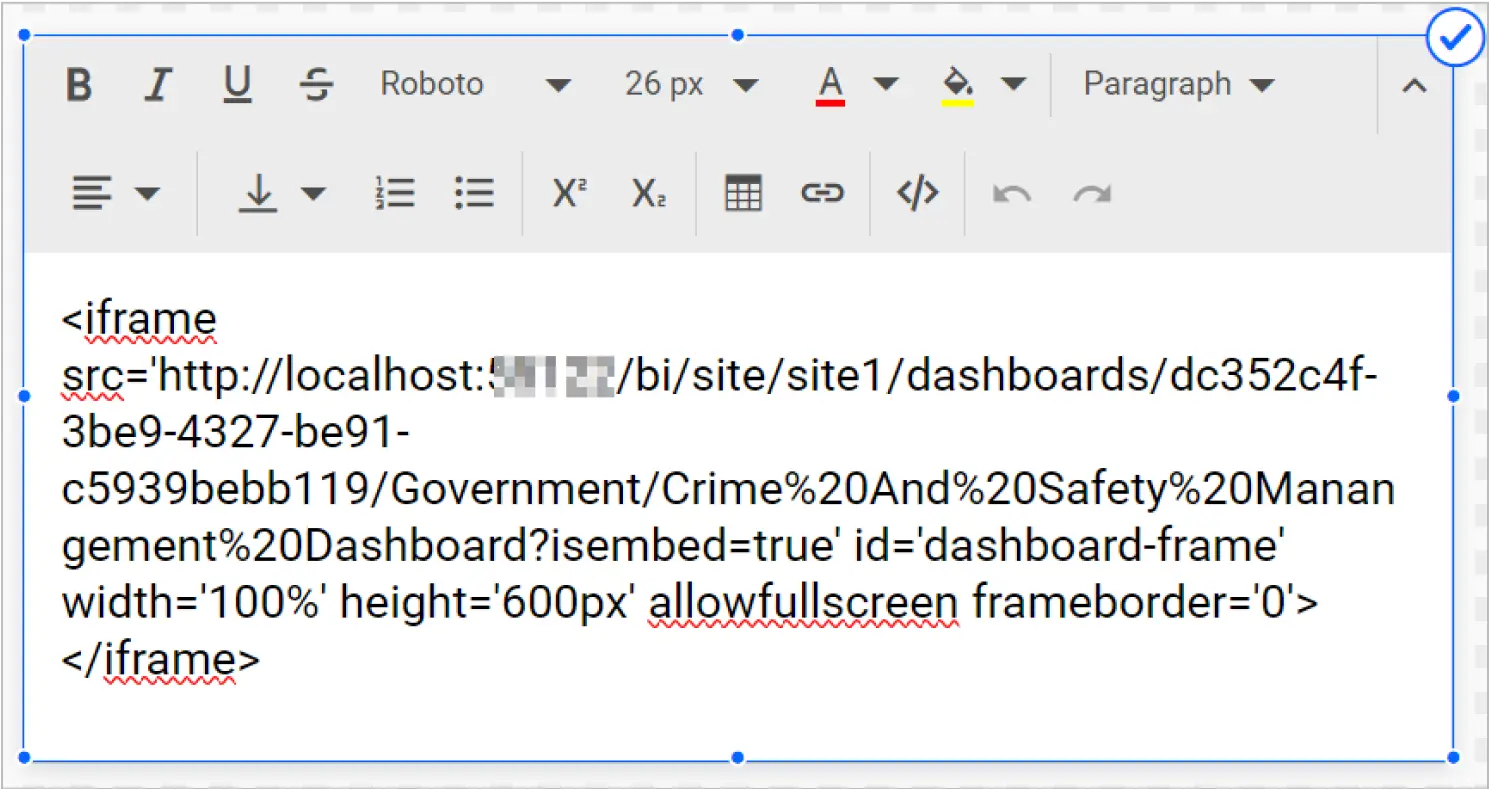
HTML editing: The Bold BI text widget lets users edit HTML markup and view the output.
How to configure a text widget in Bold BI
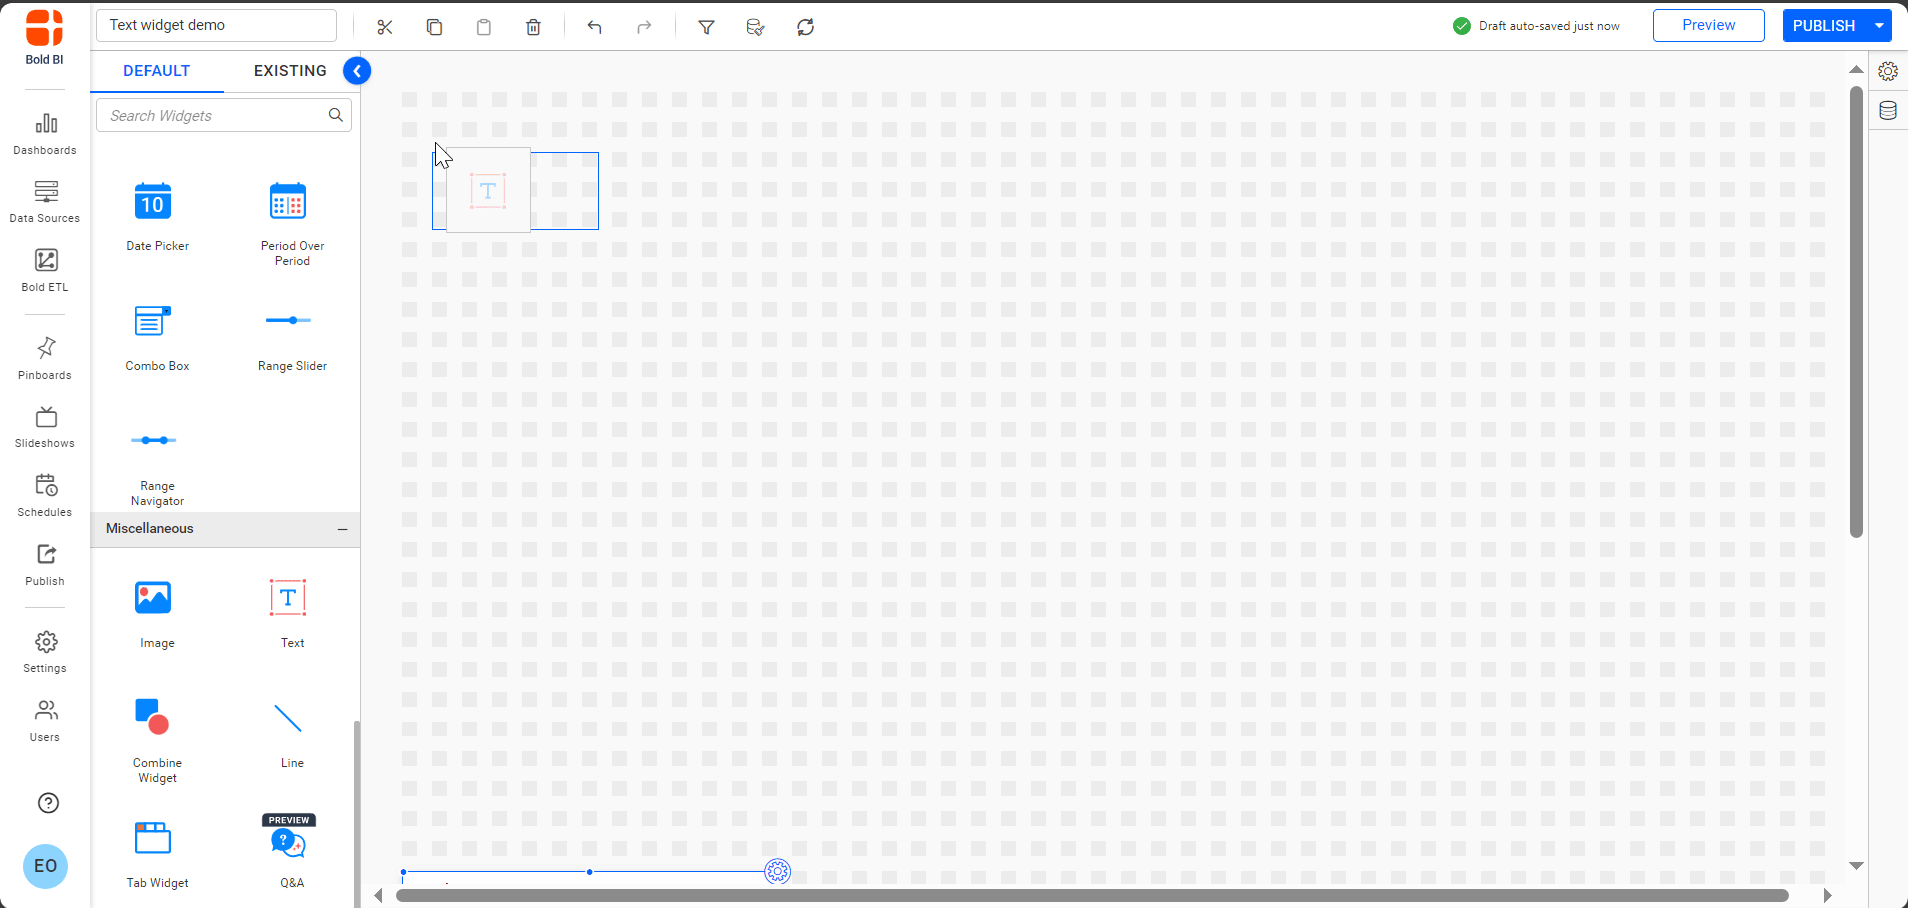
- In the Dashboard Designer, drag and drop the Text widget from the visualization panel into the design canvas.
- Click the Pencil button on the widget to access its editing functionality.
- Type text and use the toolbar to format it, add tables, insert hyperlinks, and more.
- Customize the widget’s appearance using the Properties panel on the right.
- Click Preview to view the dashboard and determine whether further changes need to be made to the widget’s content or appearance.
The following GIF shows the configuration process.

Use cases of text widgets in dashboards
Customer service
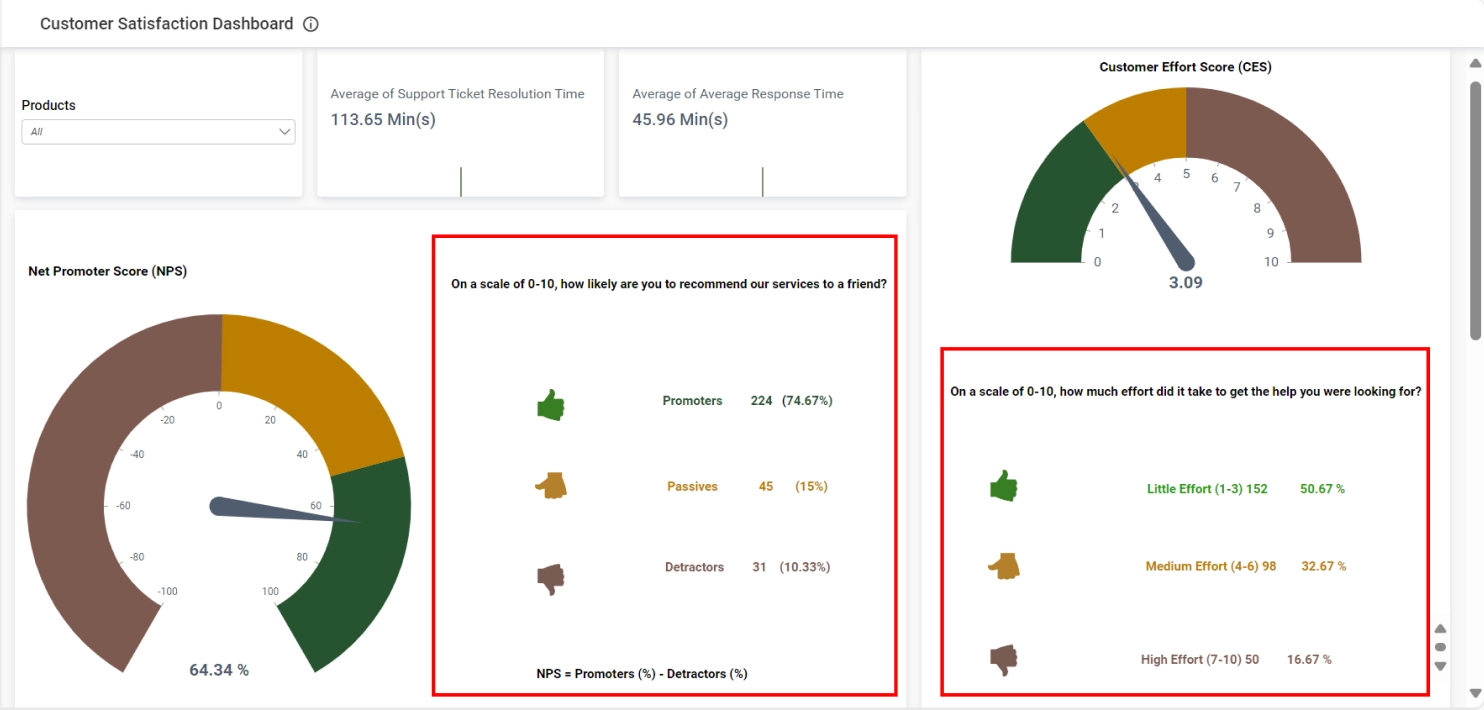
The Customer Satisfaction Dashboard, shown in the following figure, uses text widgets to provide key takeaways from gauges charting the customer effort score and net promoter score, enabling users to quickly understand these metrics. This helps the customer support team effectively present their performance data in the dashboard.
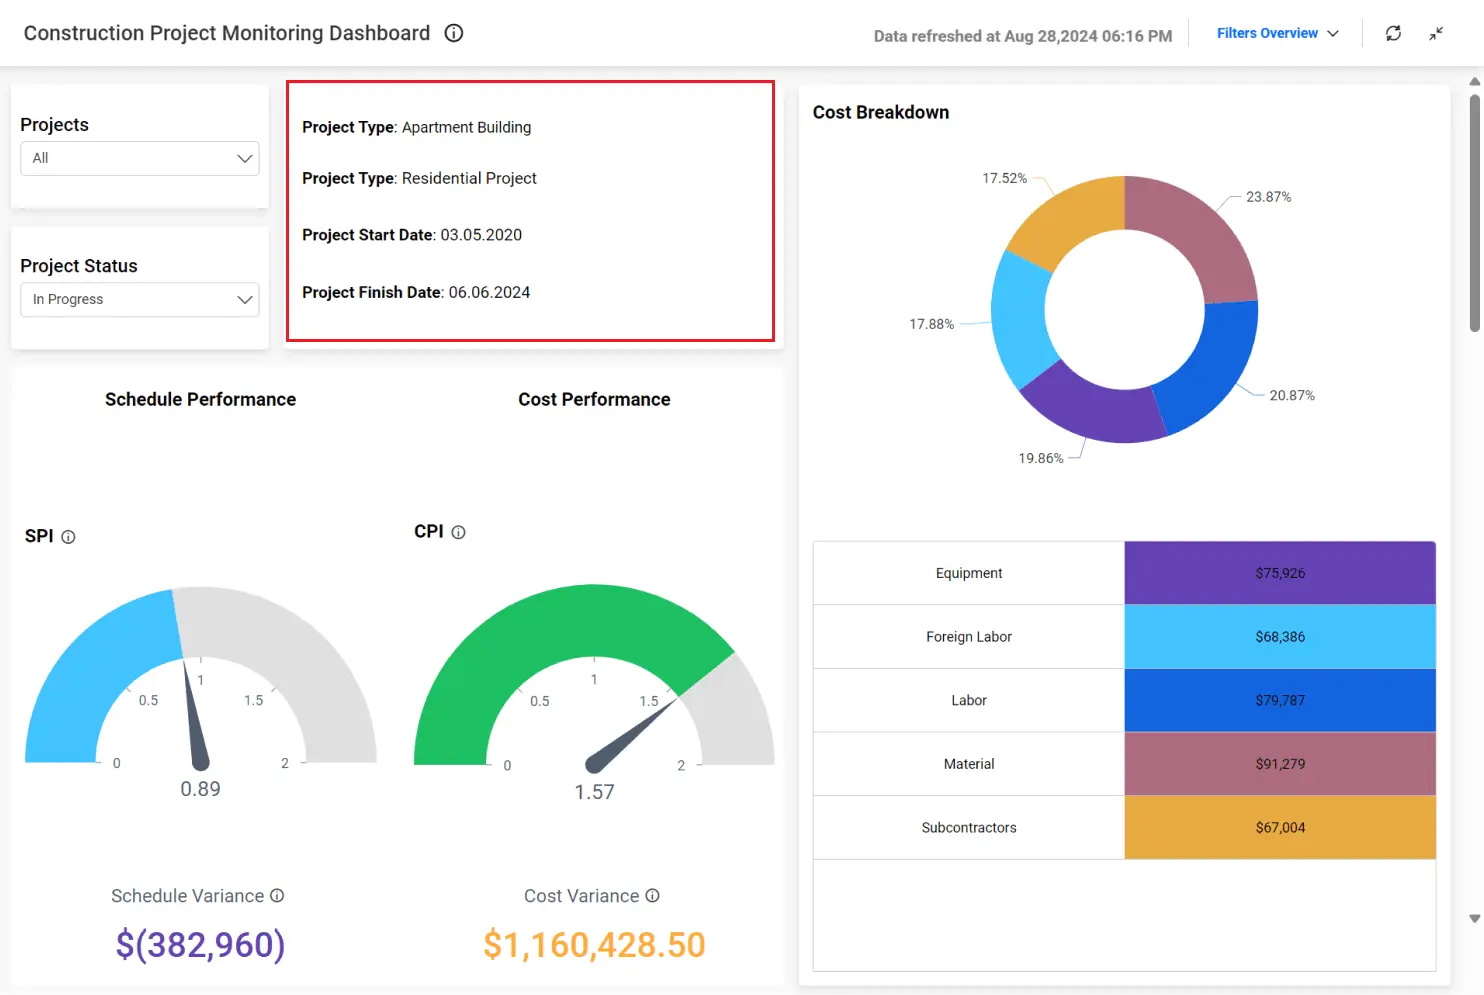
Construction
The text widget within the Construction Project Monitoring Dashboard displays , thereby facilitating efficient tracking and management. This functionality provides users with comprehensive project details for any selected category, aiding in meticulous project planning.
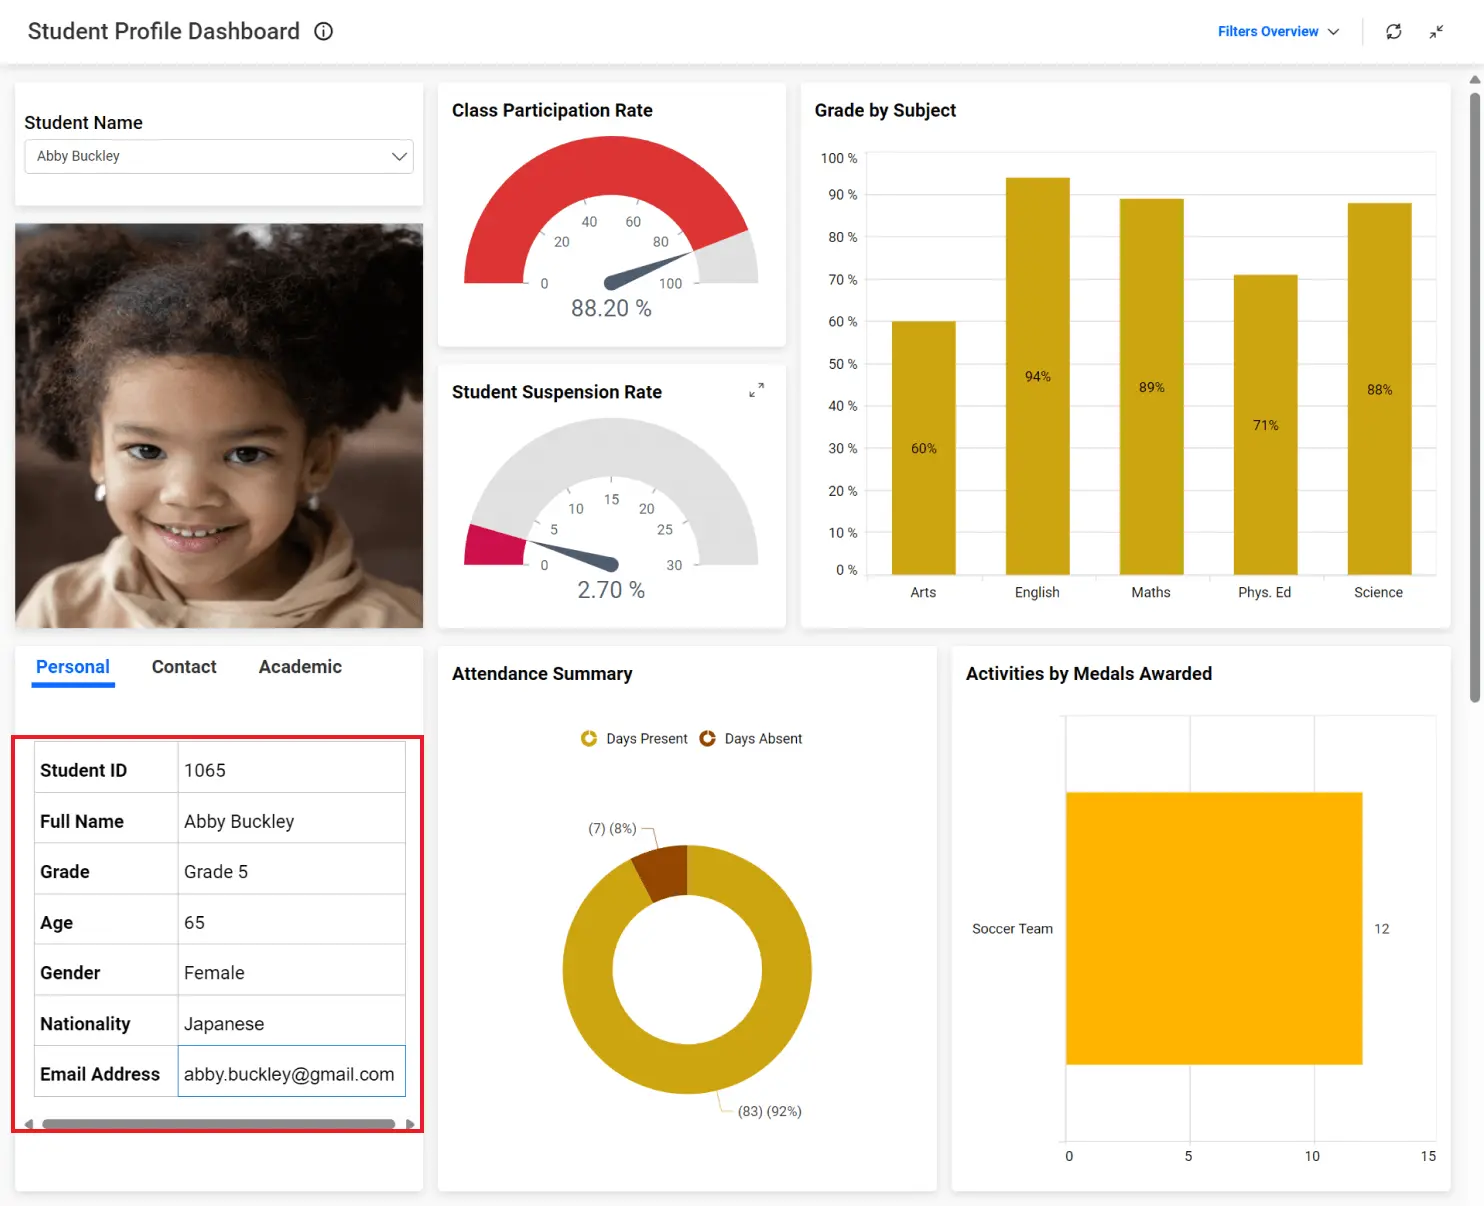
Education
The Student Profile Dashboard’s text widget displays students’ personal details, contact information, and select academic data in tables for convenient, quick access. Note that rich-text formatting is used to produce both tables and bold text, and the multitab functionality is built into the text widget.
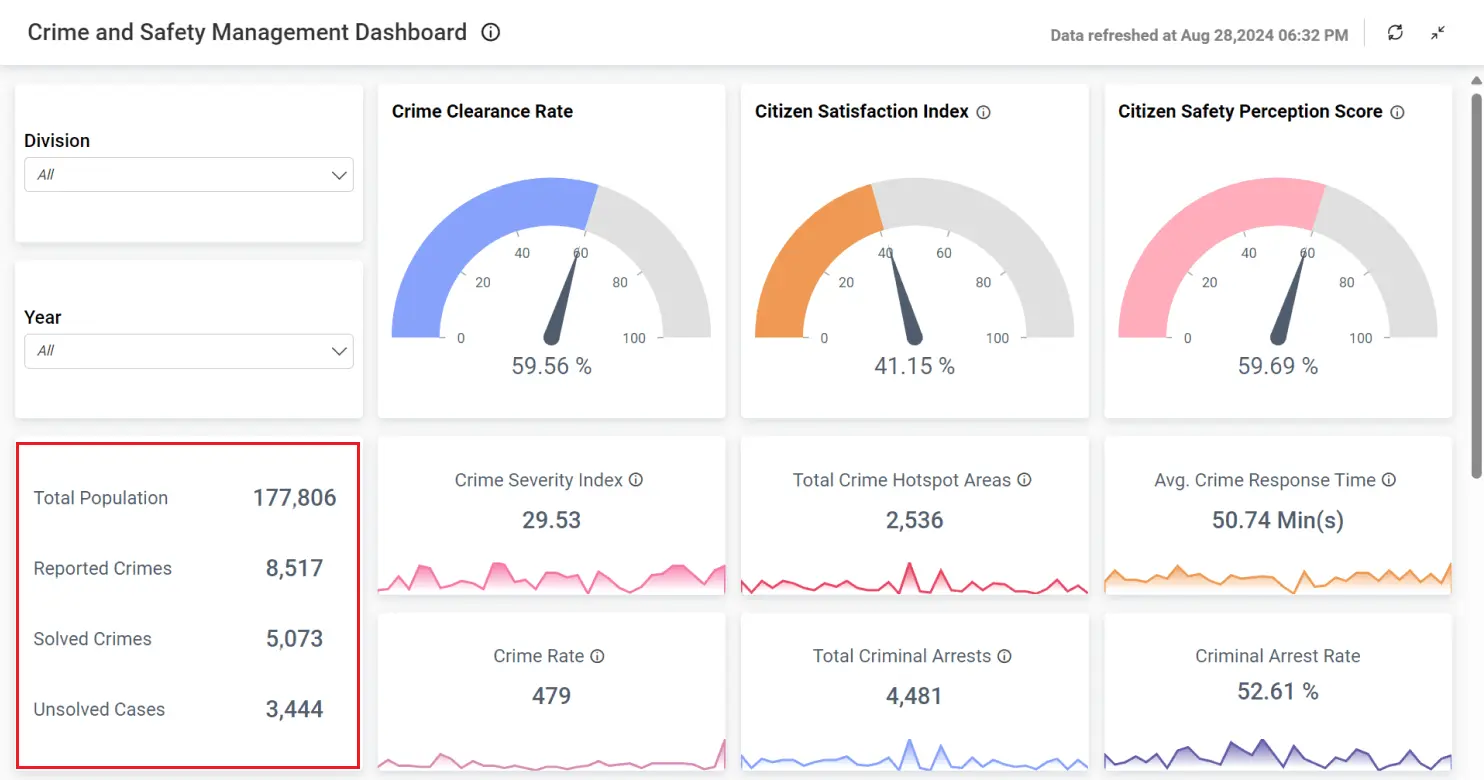
Government
The text widget in the Crime and Safety Management Dashboard displays data pertaining to crime statistics, such as total population, reported crimes, solved crimes, and the unresolved crisis. This information gives government a high-level overview of crimes and their proportion to their constituent population.
To learn more about these dashboard texts, refer to our Bold BI dashboard examples.
Best practices for using rich text in dashboards
To maximize the impact of rich text in dashboards, consider these best practices:
- Clarity and brevity: Keep your text concise and to the point.
- Formatting: Use formatting options like bold, italics, and bullet points to highlight or emphasize key information. Don’t apply formatting just because you can.
- Consistency: Maintain a consistent style, including font type, size, and color, to ensure a cohesive look.
- Contextual information: Use rich text to provide context or explanations for the data displayed. This helps users understand the significance of the data.
- Placement: Position rich text strategically. Place it near the relevant data visualizations to provide immediate context without cluttering the dashboard.
Conclusion
Rich text in dashboards enriches the user experience by delivering carefully formatted and designed text that enhances data comprehension. Enhance your dashboards’ effectiveness by leveraging rich text and text widgets to present key insights clearly and engagingly. You can add text widgets to dashboards in Bold BI® by following the configuration process outlined in this blog post. If you’re not a Bold BI user, start with a free trial. For more information, visit our website or contact our support team.