

Managing and analyzing large datasets, like those containing billions of records, can be a daunting task. Bold Data Hub is specifically designed to simplify this process, making it easier to handle vast datasets without compromising dashboard performance. Let’s explore how Bold Data Hub empowers you with seamless migration and optimization for large datasets.
What is Bold Data Hub?
Bold Data Hub provides powerful extract, transform, and load (ETL) capabilities, allowing you to integrate multiple sources into a single, efficient pipeline for your data warehouse. It simplifies the process of extracting, processing, cleaning, and transforming data from various sources into PostgreSQL, Microsoft SQL Server, MySQL, Oracle, Google BigQuery, Snowflake, Apache Doris, and Bold BI® data stores.
The challenge of managing billion-row datasets
Managing large datasets can be complex, primarily due to three key challenges:
- Data size and complexity: Large datasets often come from multiple sources, each with different structures, making it difficult to consolidate and process the data effectively.
- Performance bottlenecks: Without proper optimization, dashboards handling vast amounts of data can become slow or unresponsive.
- Schema variability: Inconsistent column names and data types make maintaining data integrity a challenge during migration.
These challenges require a sophisticated solution to ensure smooth data management and performance. So, let’s explore how Bold Data Hub addresses these challenges through structured migration and optimization strategies.
Bold Data Hub streamlines data migration and optimization
Bold Data Hub offers robust ETL capabilities to simplify data management for large datasets. The migration process with Bold Data Hub follows these steps:
- Data splitting: The immense dataset is divided into two large CSV files to facilitate batch processing and manage loading complexity.
- Schema harmonization: Using Bold Data Hub’s transformation capabilities, column names and data types are synchronized to ensure consistency across datasets.
- Loading into databases: The transformed data is loaded into Apache Doris or PostgreSQL to leverage their high-performance query capabilities for big data analytics.
Migrating over 1 billion NYC taxi rides into a data warehouse with Bold Data Hub
To show off the impressive capabilities of the Bold Data Hub, we’ll demonstrate how you can migrate a dataset to a database and optimize its performance.
We take a sample data set of over 1 billion records. For this example, we are using the NYC Yellow Taxi dataset, which is a repository of detailed records of taxi trips within New York City. Key attributes of the dataset include:
- Trip details: Pickup and drop-off timestamps, trip distance, and passenger count.
- Fare components: Base fare, extra charges, taxes, tips, tolls, and total fare.
- Geospatial data: Latitude and longitude of pickup and drop-off locations.
- Operational metrics: Payment type, vendor ID, and rate codes.
You can download the sample datasets we used: nyctripstaxi.csv and nyctripstaxi2.csv.
Steps to migrate data with Bold Data Hub
- Access the Data Hub site
On the Bold BI application home page, click Data Hub to access the Bold Data Hub site. The home page will open.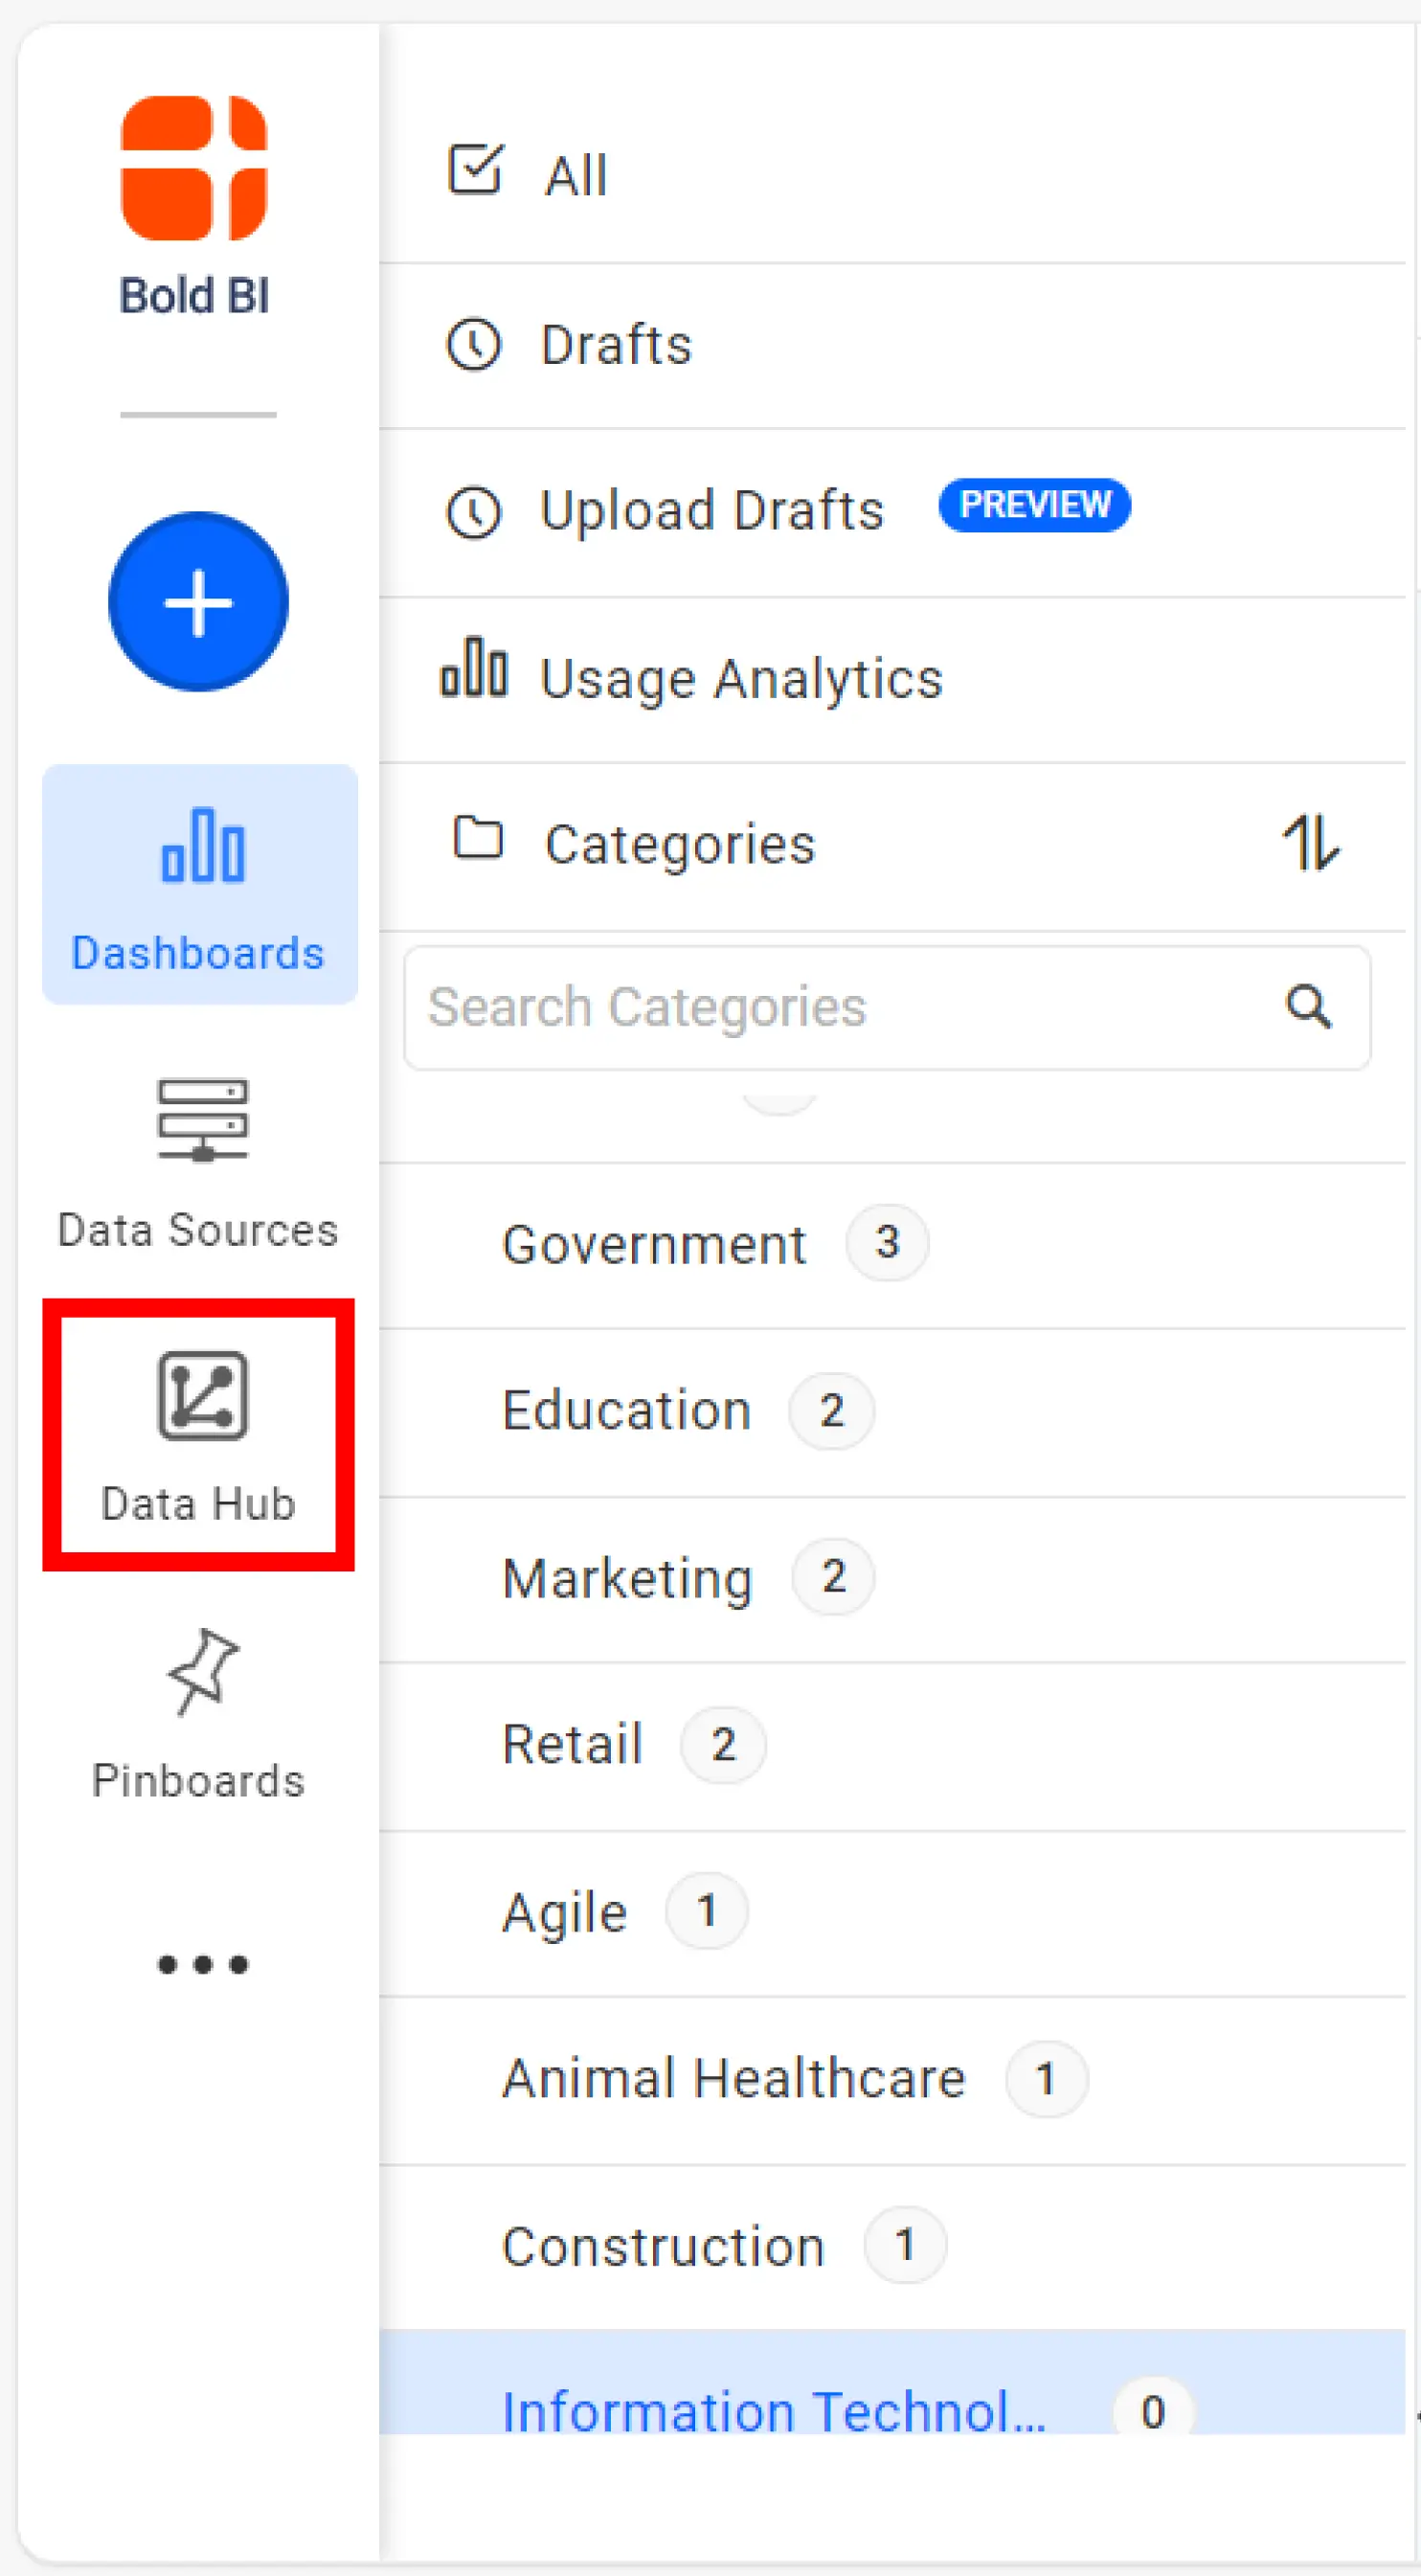
Bold BI Application Home Page - Prepare your data for migration
Before proceeding, large datasets, such as the NYC Yellow Taxi dataset, may need to be divided into smaller CSV files for efficient loading and batch processing. This step reduces complexity and enhances migration speed. - Create a new migration project
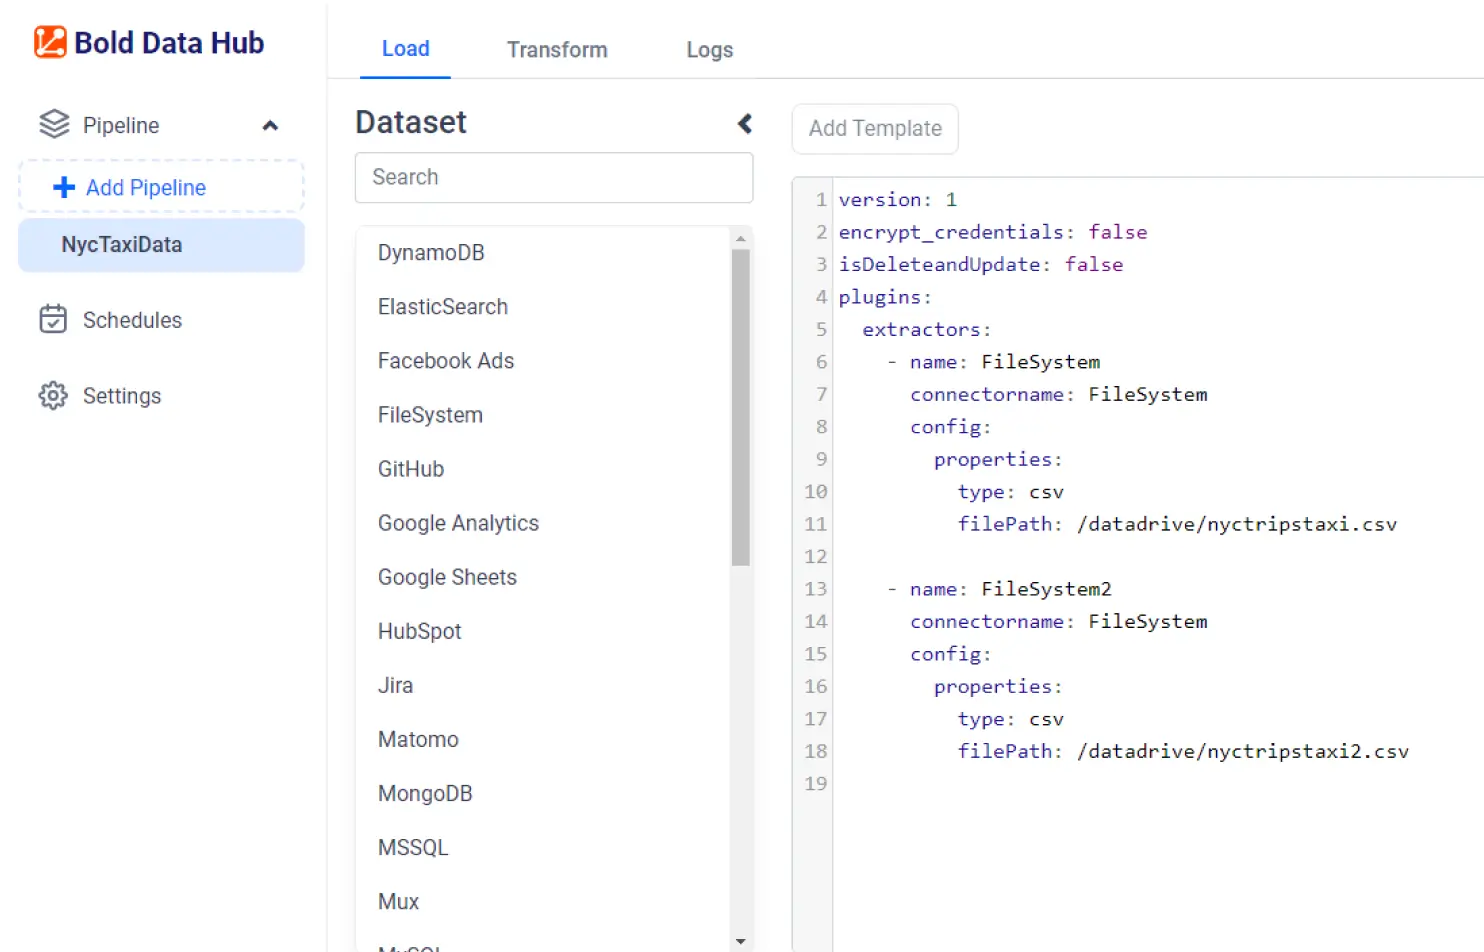
- On the Bold Data Hub site, select Add Pipeline, upload the CSV files, and begin the data migration process.
- Select Apache Doris or PostgreSQL as your target database in the Bold Data Hub interface.
- Load the CSV files through a configuration template and then save the project. Once saved, you can schedule ETL jobs on demand or at custom intervals.
- Access the Data Hub site
- Handle schema changes
Use Bold Data Hub’s transformation tools to ensure that column names and data types remain consistent across your files. This step is crucial to prevent any errors during migration.
For a detailed explanation of how to create a Bold Data Hub project to transform and load data into your desired database, follow the steps listed in “Working with Bold Data Hub” in the Bold BI documentation.
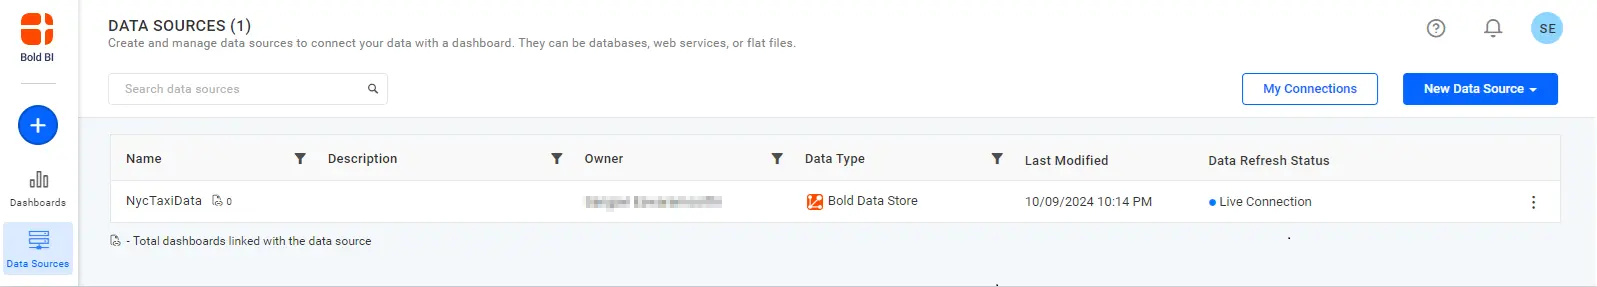
After creating the project for the NYC Yellow Taxi dataset, it will be generated as a data source within the Bold BI platform. We can now create a dashboard that visualizes this data.
Creating a dashboard from the Bold Data Hub data source
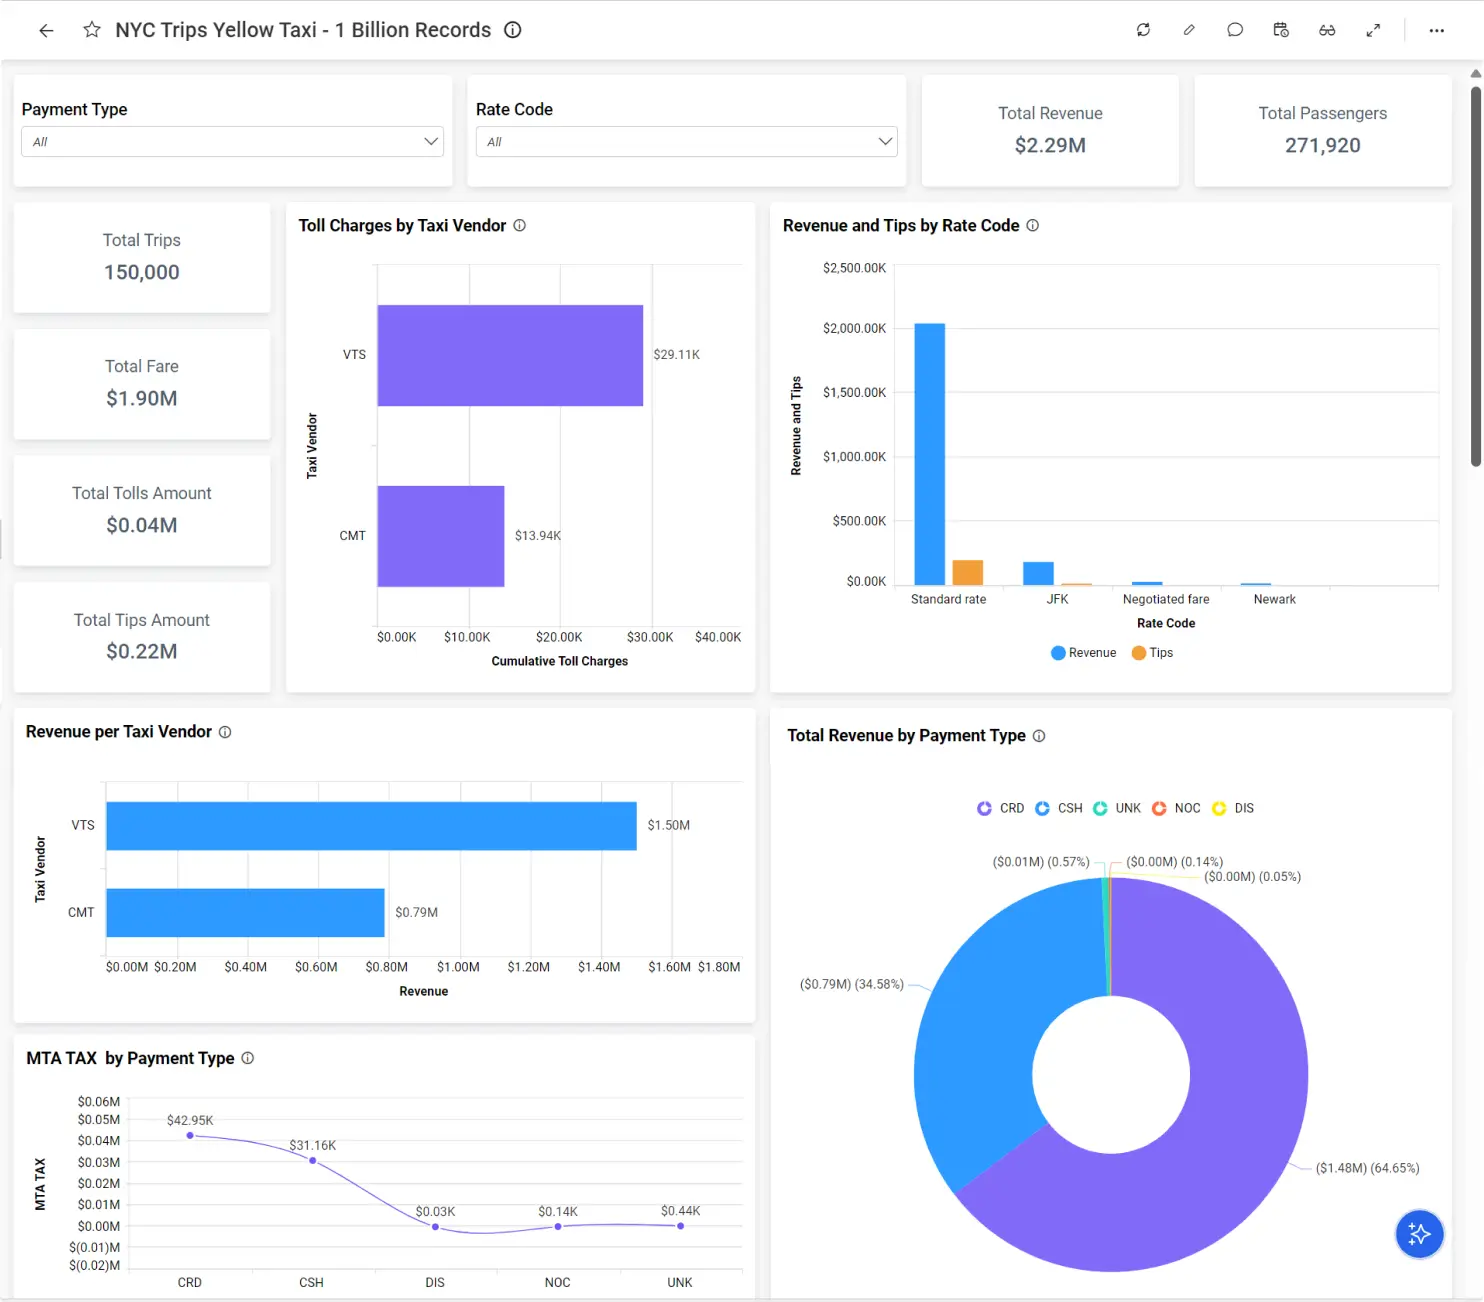
Using Bold BI’s intuitive dashboard designer, we built the NYC Yellow Taxi Trips dashboard to provide in-depth analysis of the taxi trip dataset that is composed of over 1 billion rows. In this dashboard, users can explore essential financial metrics, including total fare amounts, MTA tax collected, and tip amounts, to gain valuable insight into taxi operations.
Let’s now look at a powerful optimization technique implemented in Bold Data Hub that boosts performance further:
Performance optimization with materialized views
Materialized views are precomputed tables that store aggregated results. These views significantly reduce query times by enabling rapid data retrieval, especially when handling repetitive queries. By using materialized views, Bold Data Hub ensures your dashboards render faster and more efficiently.
Refer to these articles for more information about implementing materialized views in Bold Data Hub:
Finally, let’s compare dashboard performance metrics between the Apache Doris and PostgreSQL data warehouses.
Performance metrics for migrating billions of rows of data into a data warehouse
To illustrate the effectiveness of Bold Data Hub, we can examine performance metrics when migrating large datasets. The following table lists the metrics observed while migrating the 1 billion & 10 billion dataset to an Apache Doris data warehouse:
| Records | Machine Configuration | Data Moving Time (Apache Doris) |
| 1 billion | 128 GB of RAM 32 CPU cores 500 GB of Storage | 89 minutes |
| 10 billion | 128 GB of RAM 32 CPU cores 2 TB of Storage | 700 minutes |
Optimized dashboard performance metrics
We compared query performance for the NYC Yellow Taxi dataset on Apache Doris and PostgreSQL with and without materialized views. The migration was executed on a machine with the following configuration for both databases: 128 GB of RAM, 32 CPU cores, and 500 GB of storage.
| Database | Records | Dashboard widget rendering time without materialized views | Dashboard widget rendering time with materialized views |
| Apache Doris | 1 billion | 26 seconds | 8 seconds |
| PostgreSQL | 1 billion | The dashboard did not render and timed out. | 10 seconds |
Key insights
Apache Doris:
- Without materialized views: Rendering took 26 seconds.
- With materialized views: Rendering time reduced dramatically to just 8 seconds.
PostgreSQL:
- Without materialized views: The dashboard failed to render, resulting in a time-out.
- With materialized views: Rendering time improved to 10 seconds, although still slower than Doris with materialized views.
These metrics highlight the critical role of materialized views in optimizing query performance, especially when handling extensive datasets.
Conclusion
Bold Data Hub’s ability to efficiently migrate and optimize large datasets was demonstrated in this blog through its taming of the billion-record NYC Yellow Taxi data collection. Through strategies and techniques like data splitting, schema harmonization, and materialized views, Bold Data Hub ensures that even the largest datasets are managed effectively to deliver insightful dashboards without performance degradation. Begin your Bold BI® journey with a free trial!
To learn more about how Bold Data Hub can optimize your data management, contact us through the Bold BI website or, if you already have an account, you can log in to submit your questions.