
Introduction
Embedded analytics is changing how businesses use data by putting advanced analysis software directly into their current applications. This lets users get useful insights without changing tools, improving decision-making and making workflows smoother. This blog will explain what embedded analytics is, its advantages, its key features, and how to choose the right platform for your business.
What is embedded analytics?
Embedded analytics is the integration of data analysis tools directly into apps, websites, or other software. Rather than using separate analytics platforms, it gives users data visualizations as part of their usual tasks. This integration makes it easier and faster to access and use data.
How embedded analytics can benefit your business
Embedding analytics can benefit your business by enhancing:
- Efficiency: Keeps you focused by showing relevant data where you’re already working.
- Collaboration: Facilitates better teamwork through shared dashboards and notes on them, making it easier to align on goals and strategies.
- Cost savings: Cuts operational expenses by eliminating the need for extra analytics tools and training.
Key features of an embedded analytics platform
The key features of an embedded analytics platform ensure it integrates smoothly, delivers useful metrics, and meets diverse user needs. They include:
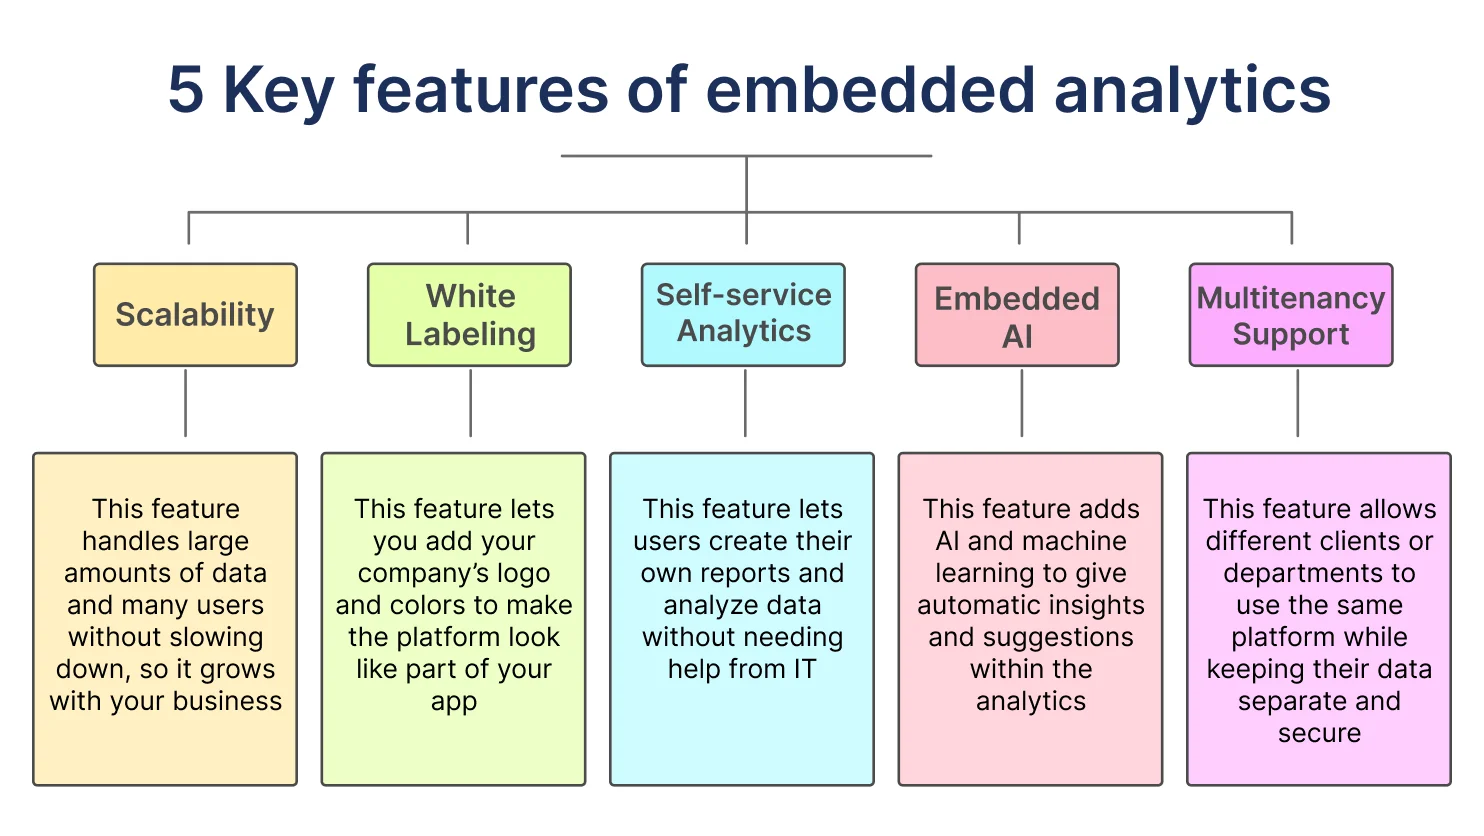
An embedded analytics tool or platform with these essential features can support your business goals and improve overall operations.
What makes embedded analytics different from business intelligence?
Embedded analytics and business intelligence (BI) both help turn data into useful insights, but they serve different purposes.
Most business intelligence involves tools and processes that collect and analyze data from different sources. Users usually must switch between their regular business apps and BI tools to find their metrics.
On the other hand, embedded analytics integrates business intelligence directly into a business application. This allows users to access reports, dashboards, and analytics within their primary app, letting them act quickly based on data.
How embedded analytics is used
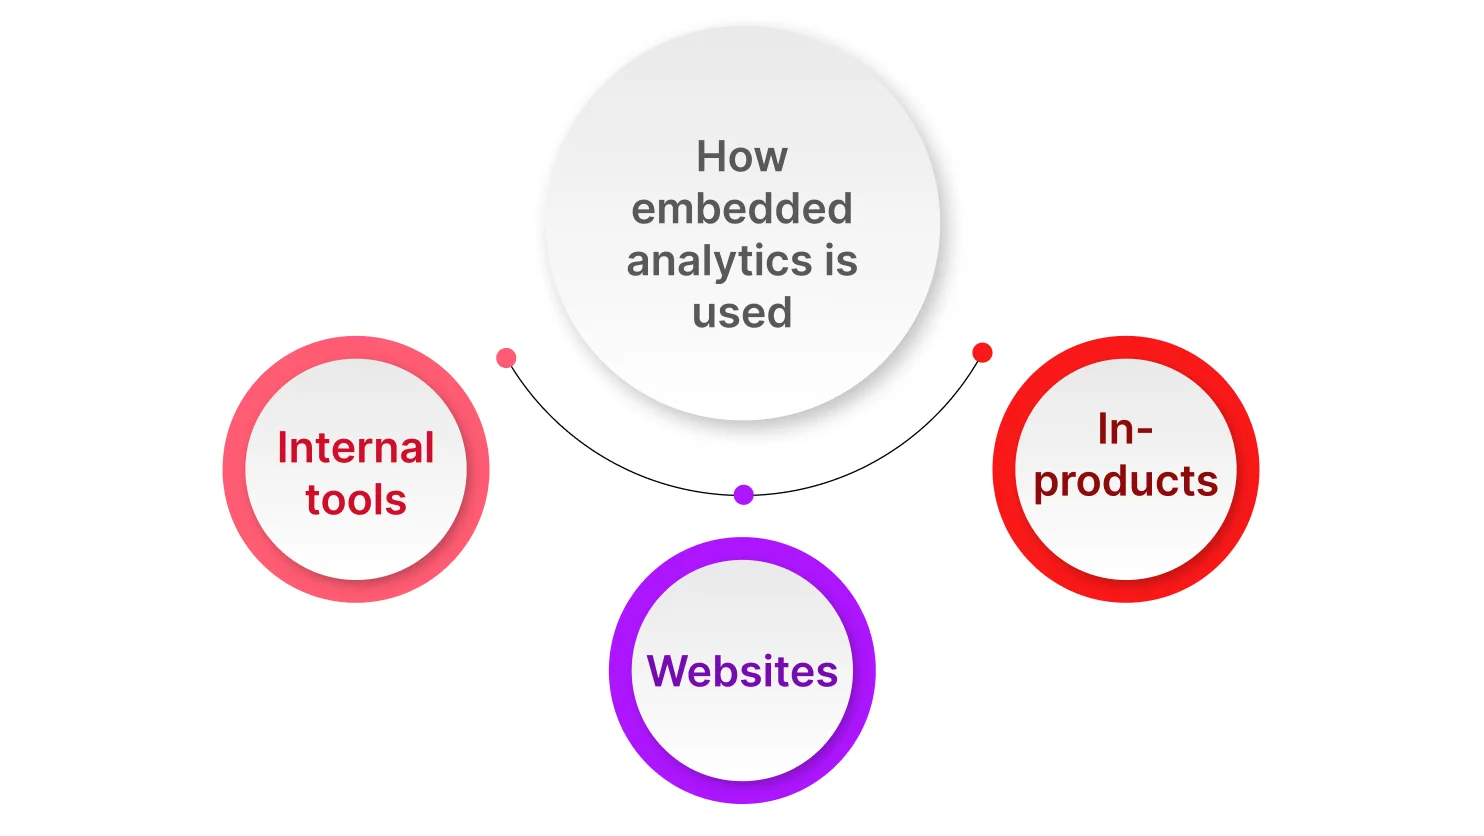
Embedded analytics presents a company’s key data and analysis through reports and dashboards for leaders to track business performance. Three ways in which it is often used are:
Internal tools: Embed analytics in internal tools like finance or sales software to analyze and track data directly within the software.
Websites: Integrate analytics into websites to track data such as visitors, customers, and leads. Understanding your customers’ journey helps optimize content and site elements for better engagement and conversions.
In-product: Place reports and dashboards within products or platforms to provide end users with the metrics they need to make well-informed choices and maximize their return on investment.
Bold BI® allows you to deploy dashboards anywhere—on your website, internal software, or customer-facing product. Our step-by-step guides explain how to deploy embedded analytics with Bold BI.
Examples of embedded analytics software by industry
In our dashboard examples, we demonstrate how embedded dashboards can benefit different industries. Check them out to see how analytics can help you visualize your critical business data in real-time dashboards.
Marketing
Embedded analytics in marketing helps analysts track campaign performance and sales trends with easy-to-use dashboards. This integration offers a clear view of key metrics, allowing marketers to spot top and lagging products and adjust strategies quickly. With these insights, teams can optimize their marketing efforts, enhance customer targeting, and drive better overall results.
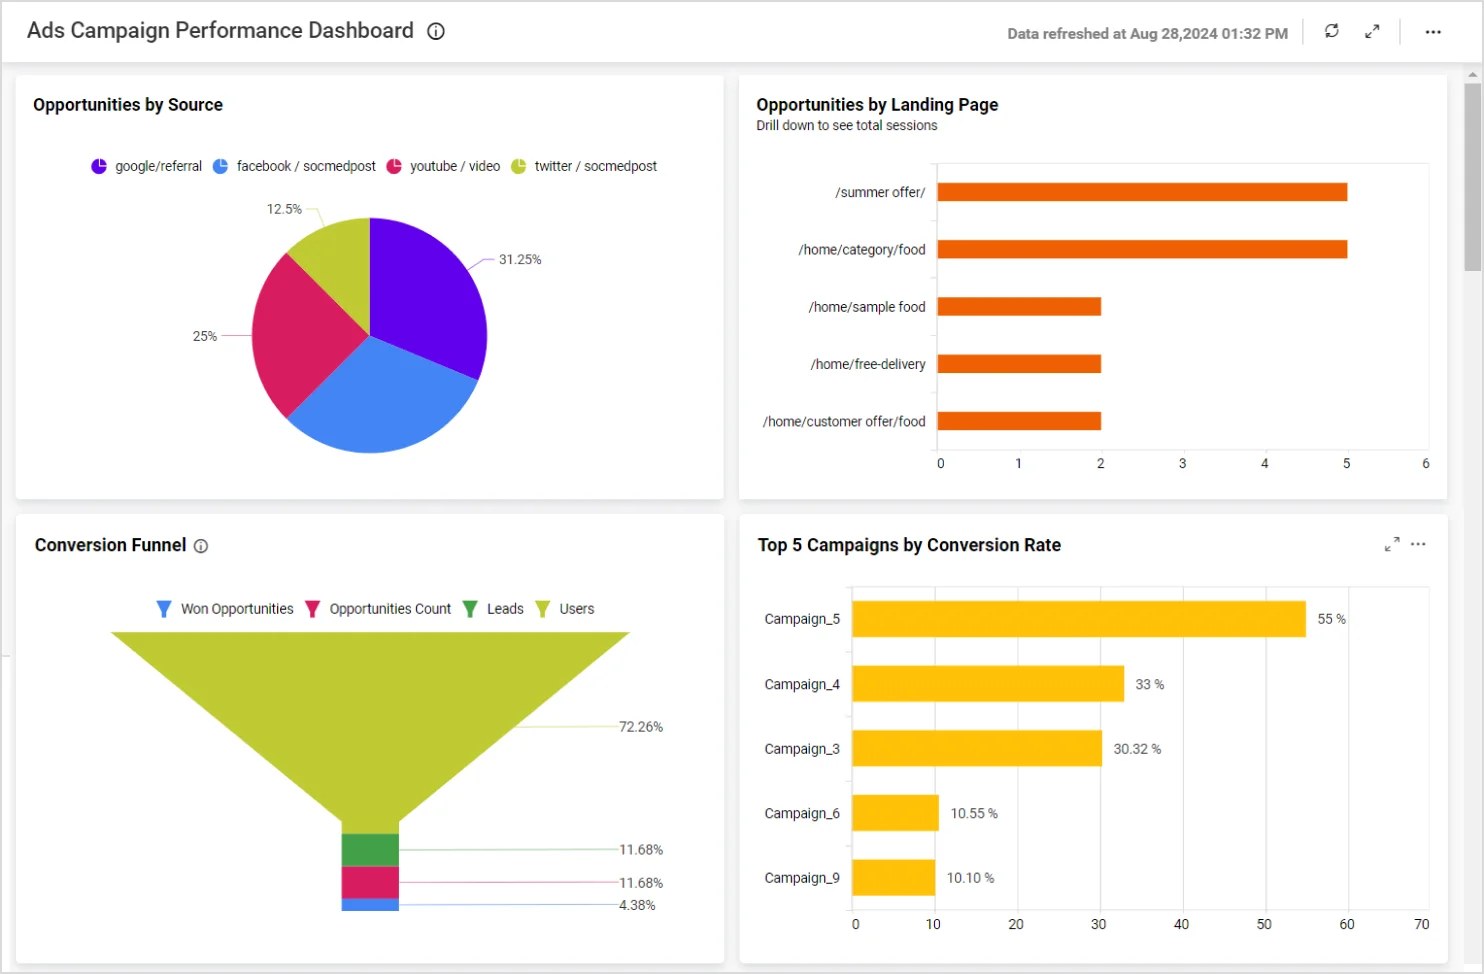
For more details on the key metrics used in this embedded dashboard, check our live demo.
Sales
Embedded analytics in sales provides teams with real-time insights into daily revenue performance through integrated dashboards. This helps managers see if sales targets are being met and allows for better monitoring of revenue and employee sales figures. The integration of analytics directly into sales apps simplifies tracking and reporting.
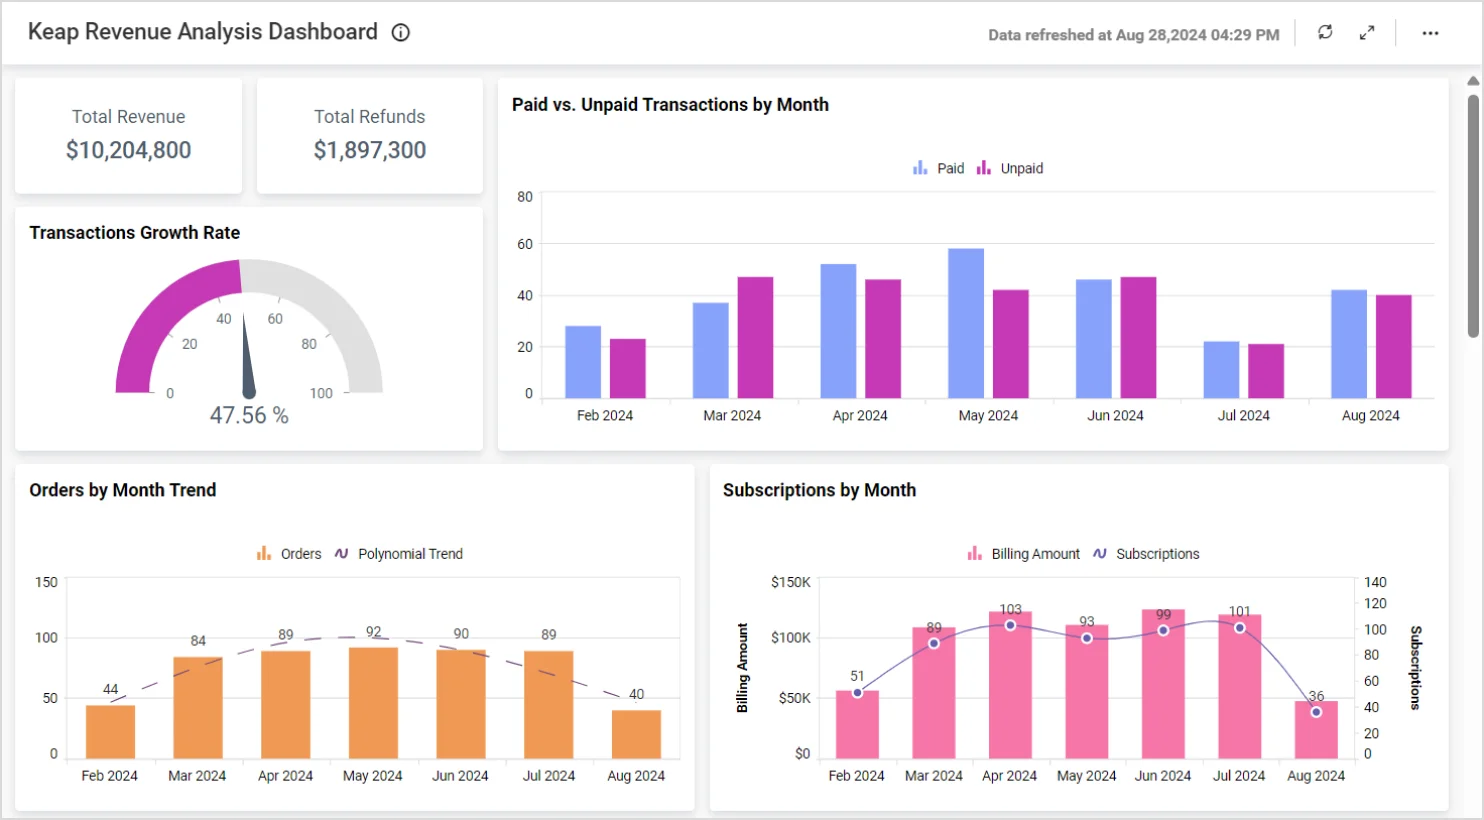
Check out our sample demo for more details on the KPIs featured in this dashboard.
Oil and Gas
Embedding dashboards in oil and gas industry software consolidates all key metrics related to well performance into one view. This integration provides leaders with real-time data on their wells, making it easier to monitor performance and status.
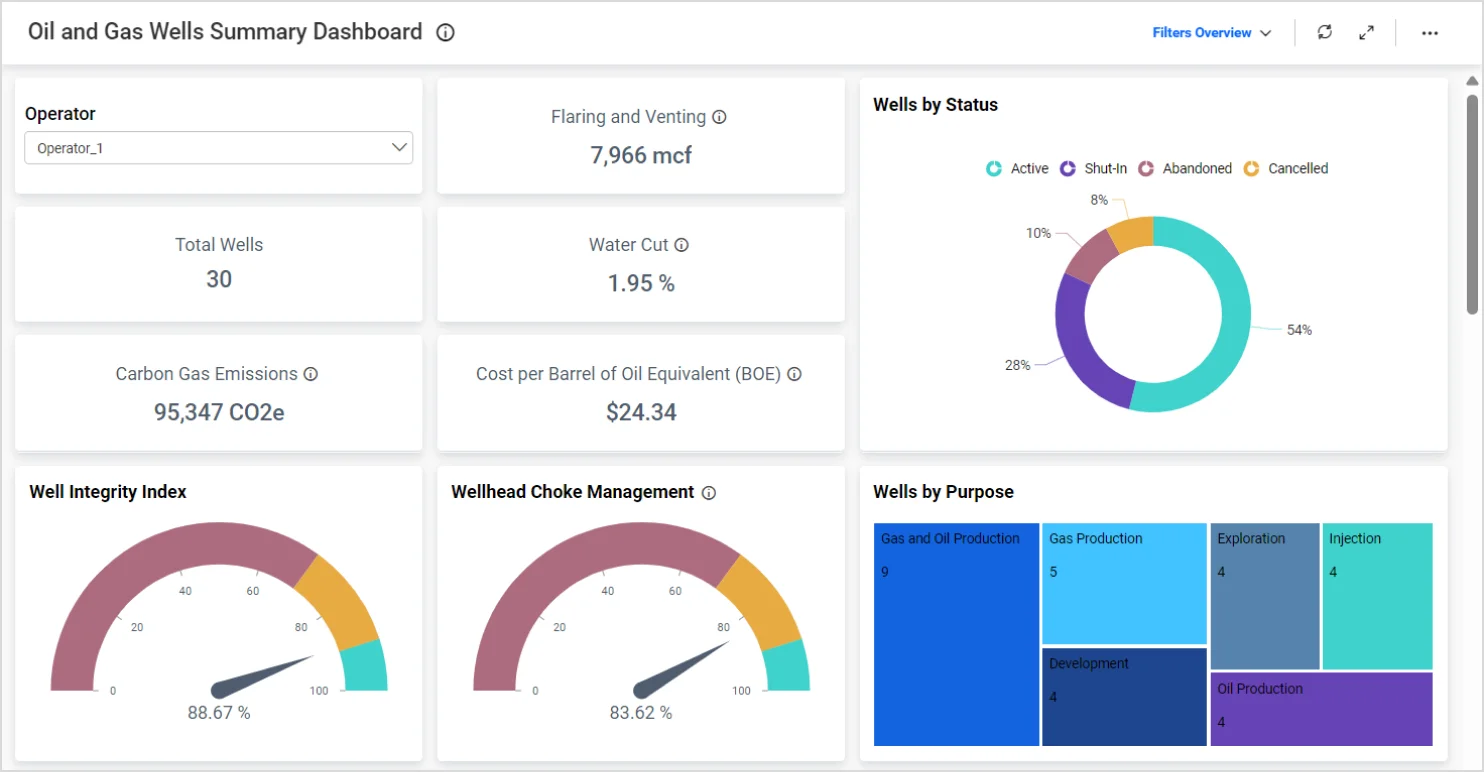
See the live dashboard for more information.
Education
Embedded analytics in education software helps teachers and administrators analyze important data, such as student performance, attendance, and test scores, through interactive dashboards. This visibility allows them to identify areas needing improvement. By embedding dashboards directly into their tools, they can easily monitor and enhance educational outcomes.
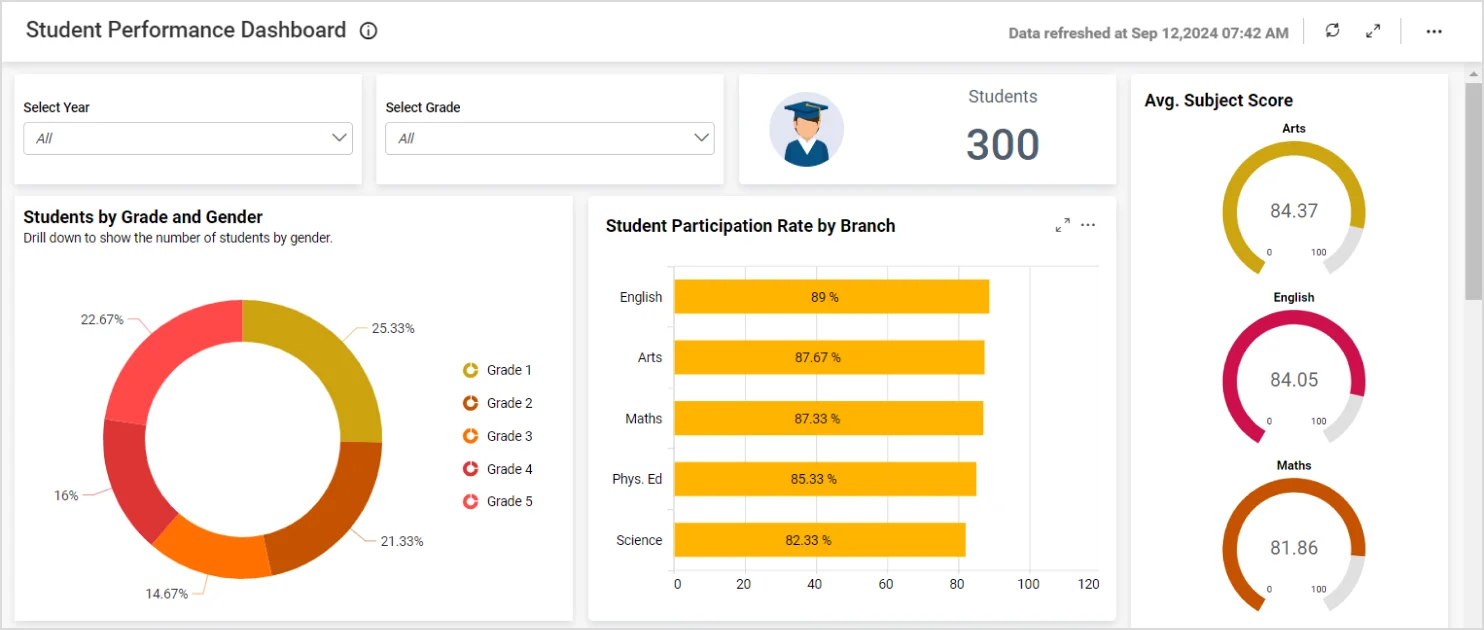
For more information, check out our sample dashboard.
How to choose the best embedded analytics platform
Choosing the best embedded analytics platform involves several key considerations. Here’s a guide to help you evaluate and select the right solution for your needs.
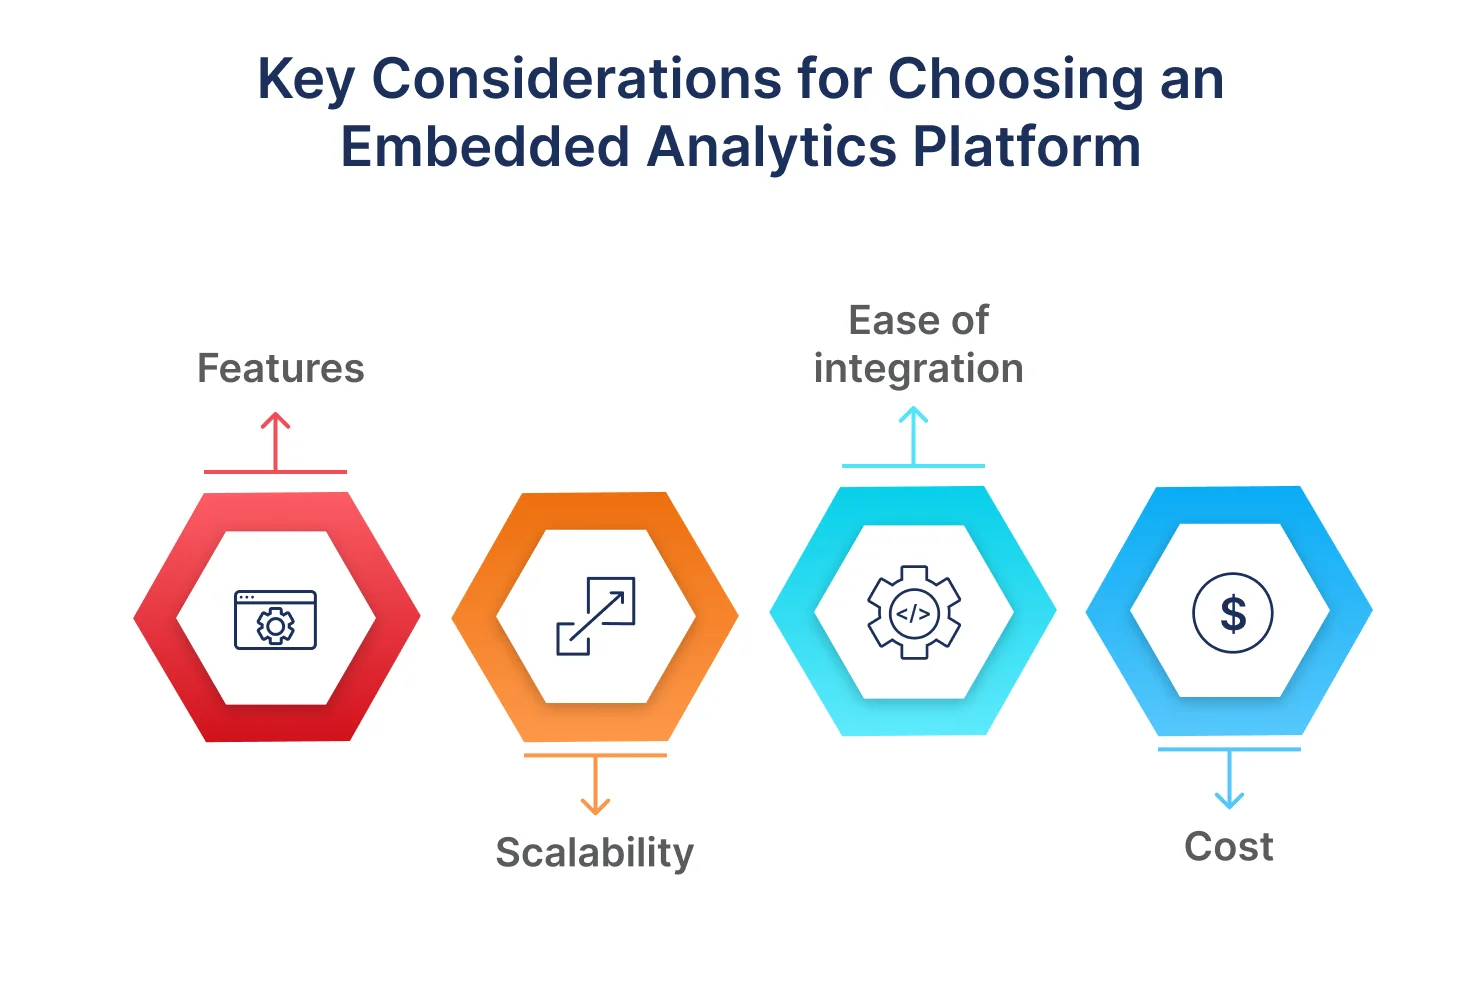
Features: Look at prospective platforms’ features to confirm it meets your requirements for functionality.
Scalability: Make sure the platform can manage large amounts of data and grow with your business to keep things running smoothly.
Ease of integration: Check that the platform can connect with your current systems and data sources.
Cost: Compare pricing options and understand the overall expenses to ensure you get good value within your budget.
When selecting an embedded analytics platform, you should look for one with features that match your company’s unique requirements. For more insights, refer to our embedded analytics evaluation guide.
What makes Bold BI’s embedded analytics platform a worthy investment?
Bold BI’s embedded analytics software is a standout option for advanced business intelligence and analytics. It enables you to visualize complex data through various widgets and connects to over 150 data sources.
Customization
This feature allows you to tailor dashboard and widget settings, including themes and indicators, using JavaScript member APIs.
Row-level filtering
This feature enables dynamic row-level filtering based on user roles and permissions, ensuring that each user views only their relevant data.
Data binding
This feature allows you to change the data connection of the embedded dashboard to a different one with the same database schema at runtime. It also allows the scheduling of auto refreshes for recent updates in the underlying data.
Event handling
This feature provides the ability to register and manage events during dashboard rendering, giving you full control over the dashboard experience.
Data security
Bold BI ensures your data remains secure by allowing you to manage user access and integrate your existing security infrastructure. Use various authentication protocols, such as single-sign-on and OAuth 2.0.
Easily embed an analytics solution
Integrate the analytics into your application.
Mobile app
Bold BI offers a customizable mobile app that can be branded and customized, delivering critical business information on the go.
Multiple development language support
This support encompasses a wide range of development platforms, enabling seamless integration with popular frameworks like React, Angular, and ASP.NET Core.
Theming
Apply custom visuals to the Bold BI interface, ensuring it integrates seamlessly with your application’s design.
Data source manipulation APIs
This feature provides APIs that give you fine-tuned control over which data is exposed, allowing for tailored data management.
Custom UI and granular permission model
This feature grants full API access to Bold BI elements, enabling you to integrate and display data within your application without relying on prebuilt components.
For more information on these embedded analytics features, visit the Bold BI features and embedded analytics features pages on our website.
Conclusion
Now that you have learned what embedded analytics is, its benefits, and the unique benefits of Bold BI® as an embedded analytics software, please feel free to post any questions you have in the comment section below. Get started with Bold BI today by signing up for a free trial and try creating interactive dashboards to see how your business can benefit from a seamless analytics solution right inside your enterprise apps.
You can contact us through the Bold BI website or, if you already have an account, you can log in if you have any support questions. Thanks for reading!