Stack Overflow Developer Survey 2022

Track employee job satisfaction, demographic data, and more.

Bold BI Stack Overflow Developer Survey 2022 Dashboard

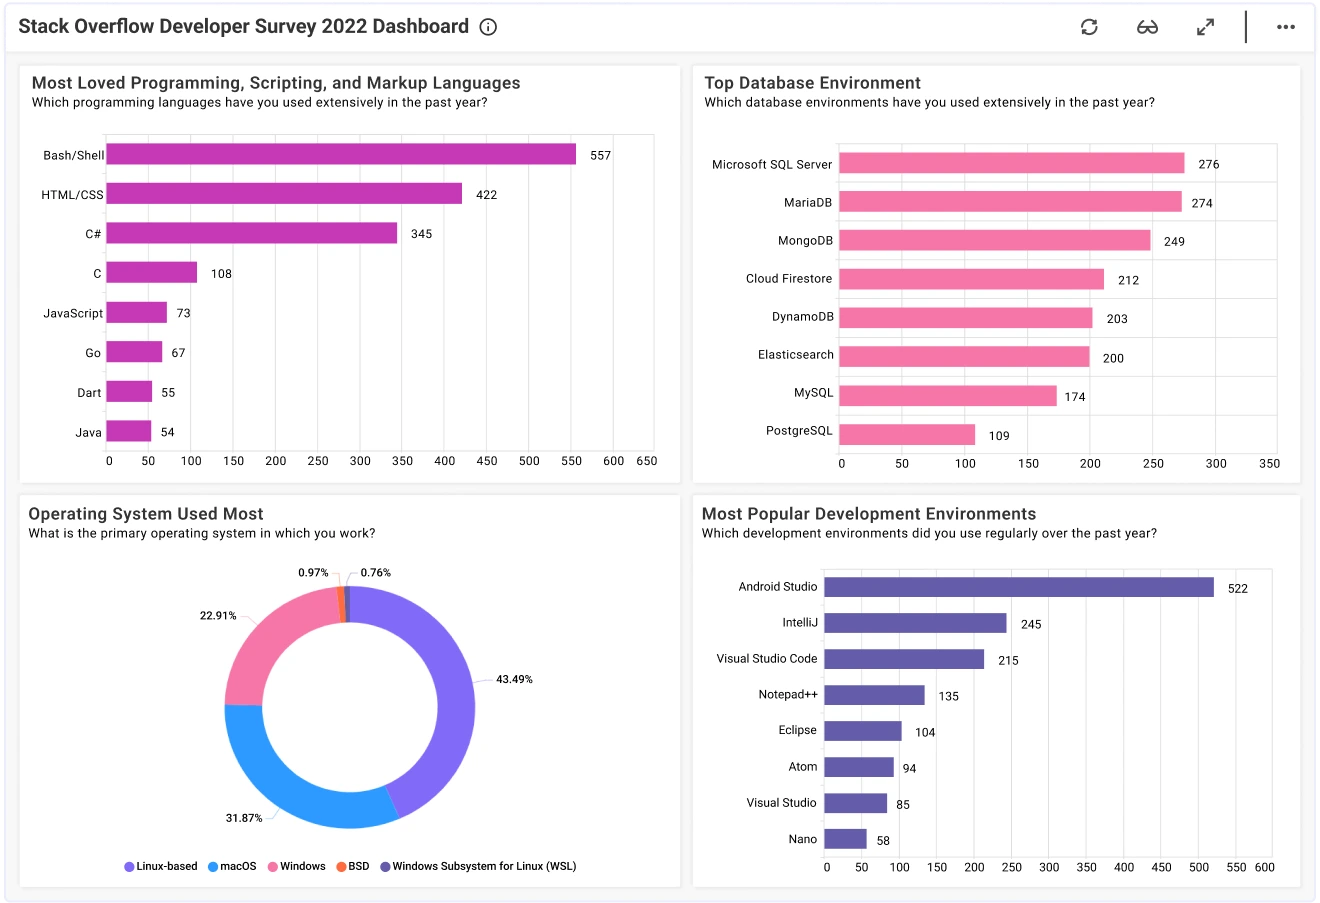
Bold BI’s survey data analysis dashboard provides insight into the developer community. For example, with this dashboard, we can answer the following questions:

Firstly, how many developers responded to the survey?/span>

Secondly, where are they located?

Thirdly, are these developers happy with their jobs?

Fourthly, how often do developers learn new skills?

Finally, what are respondents' education levels?

Analyze Survey Data to Gain Key Insights

This survey data analysis dashboard displays the results of a 2022 stack overflow developer survey. With this dashboard, viewers can gain insight into developers' demographic information, job satisfaction, and interest in learning new skills. This data can help leaders develop strategies to ensure their work environments are positive and productive, which in turn helps ensure customer satisfaction.

With the card widget at the top left corner of the dashboard, viewers can see the total number of survey responses received. The dashboard also shows respondents' locations, education levels, and job satisfaction ratings.

Then, with the bar chart at the bottom left corner of the dashboard, leaders can see how often developers are learning new languages or frameworks. Further, the DevOps Usage bar chart in the top row of the dashboard shows developers' opinions about the importance of DevOps for software development. Finally, with the Organization Size bar chart, viewers can see the total number of employees at respondents' companies.

Leaders can use this data to gain insight into their team members' preferences, interests, and job satisfaction. This, in turn, can help leaders build positive and productive work environments to attract and retain top talent and thus ensure customer satisfaction.

Survey Analysis Dashboard Examples

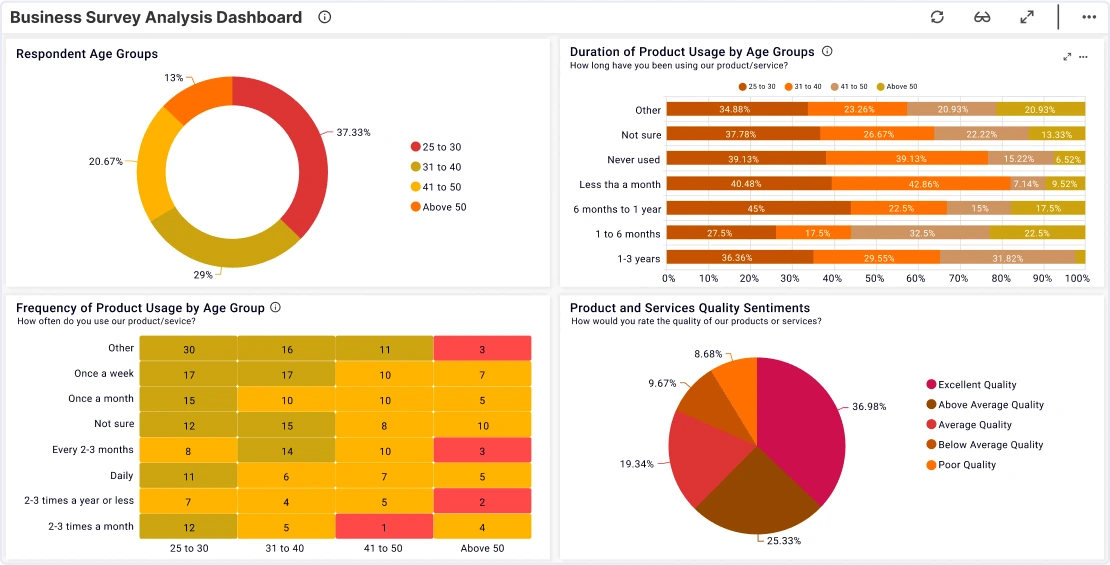
Business Survey Analysis Dashboard

Bold BI’s business survey analysis dashboard displays survey analysis metrics regarding customers' experiences with the company. For example, with this dashboard...

Learn More View Dashboard
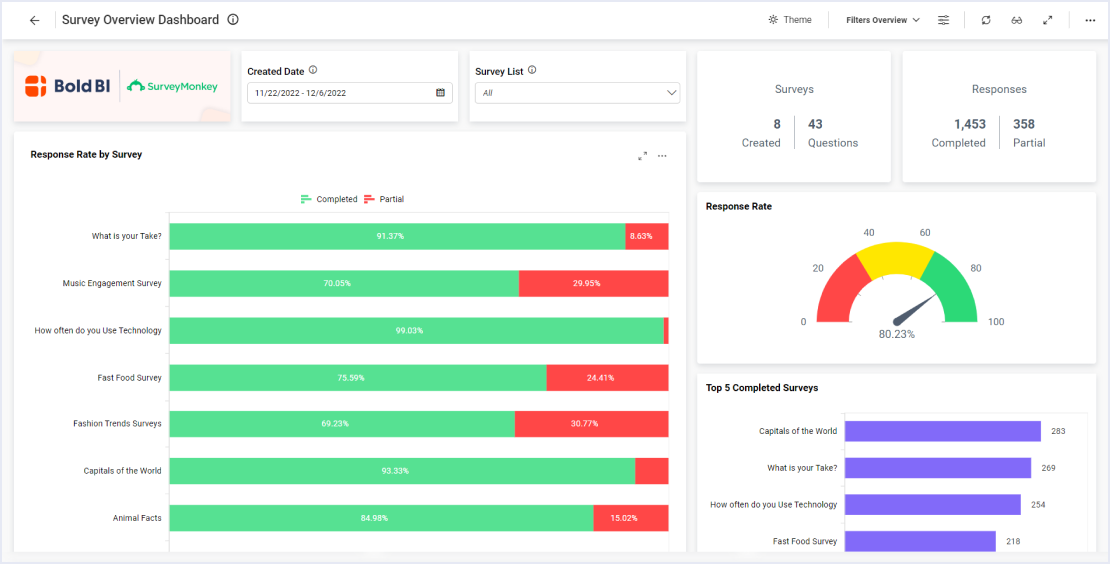
SurveyMonkey Survey Overview Dashboard

Bold BI’s survey overview dashboard displays metrics to monitor surveys by category, survey responses, and metrics related to survey responses. For example, with this dashboard...

Learn More View Dashboard

View Other Solutions

Government

All government agencies’ long-term success depends on analyzing key...

Learn More
Energy

In the energy industry, you need to be able to monitor everything from...

Learn More
Finance

From analyzing Accounts Receivable and Accounts Payable reports to...

Learn More

Start Embedding Powerful Analytics

Try out all the features of Bold BI® with 30-day free trial and get to know how it suit to your needs of embedded analytics.