
Asana is a leading work management platform that helps teams organize and plan workflows, projects, and more to keep their work on schedule. Team members can create a project, assign work to teammates, specify deadlines, and communicate about tasks within Asana.
You can now integrate your Asana account with Bold BI® to monitor your team’s work and the progress of projects over time. In this blog post, we’ll explore the following topics:
We’ll also track project task management metrics through a dashboard that gives you a clear view and understanding of your team’s performance to make every project a success.
Getting Asana data
Using REST APIs, developers can analyze and retrieve data stored in the Asana platform for tasks, projects, conversations, and more. Refer to the following table to connect Asana data and create a data source with appropriate APIs.
| Endpoints | Used for |
| GET https://app.asana.com/api/1.0/projects | Returns complete project records. |
| GET https://app.asana.com/api/1.0/tags | Returns compact tag records. |
| GET https://app.asana.com/api/1.0/workspaces | Returns compact records for all workspaces visible to the authorized user. |
| GET https://app.asana.com/api/1.0/users | Returns user records for all users in all workspaces and organizations accessible to the authenticated user. |
These basic endpoints retrieve only three fields, gid, name, and resource_type. Append “?opt_expand=.,” to the end of your endpoint URL to fetch all the fields. Reference the following URL to fetch task records for all tasks within a specific project with all fields.
Connecting Asana data with Bold BI
To create an Asana data source from the dashboard designer, follow the steps described here. Also, use the steps described here to authenticate with Asana.
After successful authentication, the NEW DATA SOURCE configuration panel opens.
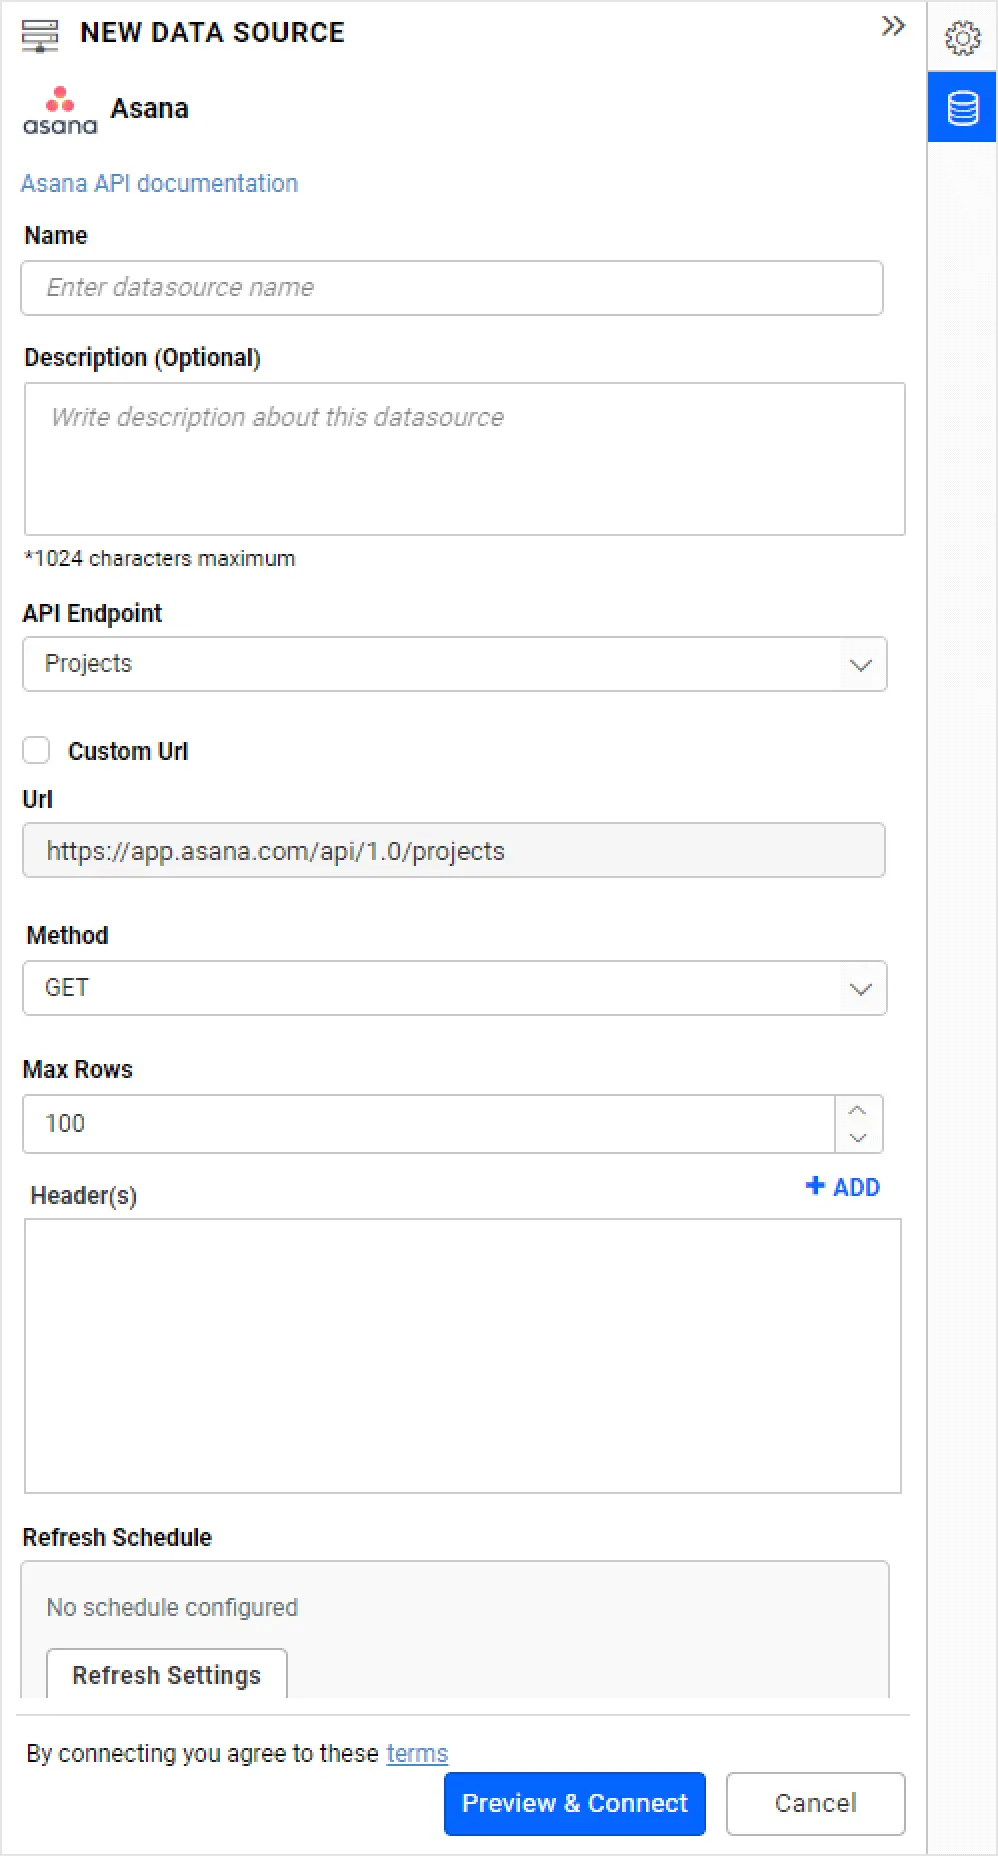
Creating an Asana data source
Specify a unique name for the Asana data source. Choose one of the Asana API Endpoints from the drop-down list: Projects, Workspaces, Users, Tags. Let me choose the Projects endpoint, so that the corresponding URL will be displayed in the URL text box. If you want to connect with other endpoints, you can enable the Custom URL check box and provide the URL in the text box manually.
Leave the default value GET for the REST API under the Method section. In Max Rows, enter the maximum number of rows to be fetched from the Asana data source. This value is used to fetch the data from the Asana data source via pagination. Set the time interval for Refresh Settings so that the dashboard can refresh itself with the latest data updates.
Let the Data Format be JSON since the Projects, Workspaces, Users, and Tags API endpoints return results in JSON format. Asana will be set automatically in the Authentication Type section since OAuth is used to authenticate with the Asana account.
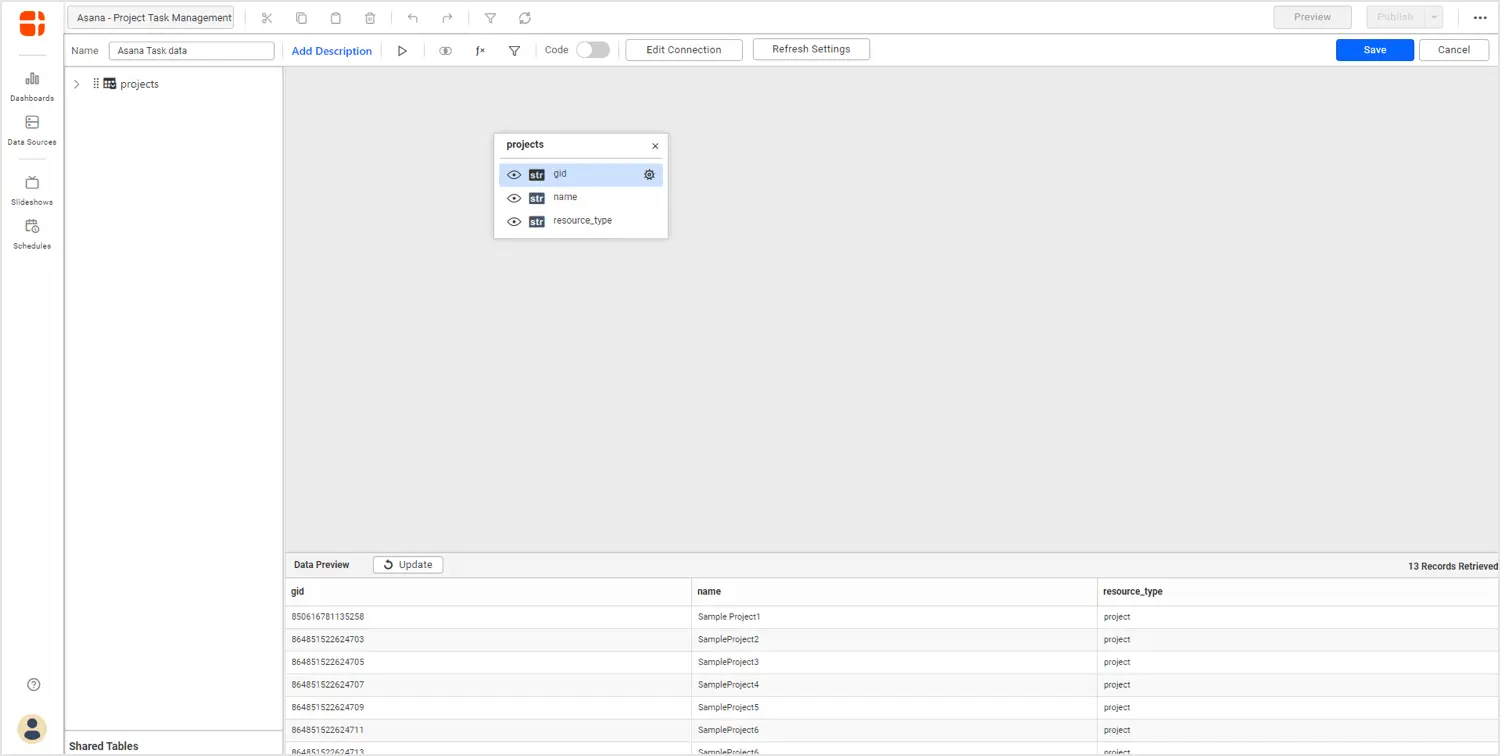
Click Preview & Connect. A window opens listing the data results as seen in the following image.
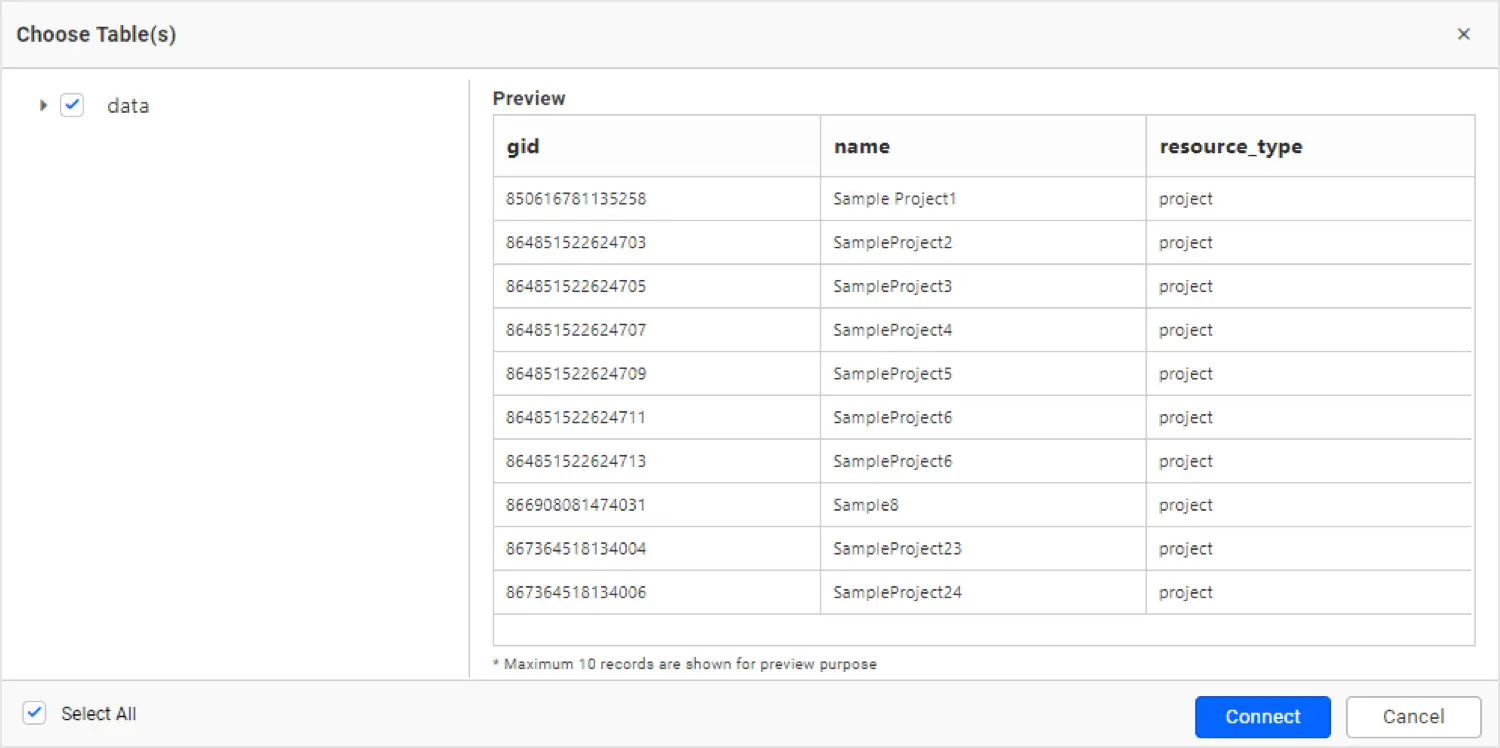
Choose the desired columns and click Connect. Drag and drop the table you created.
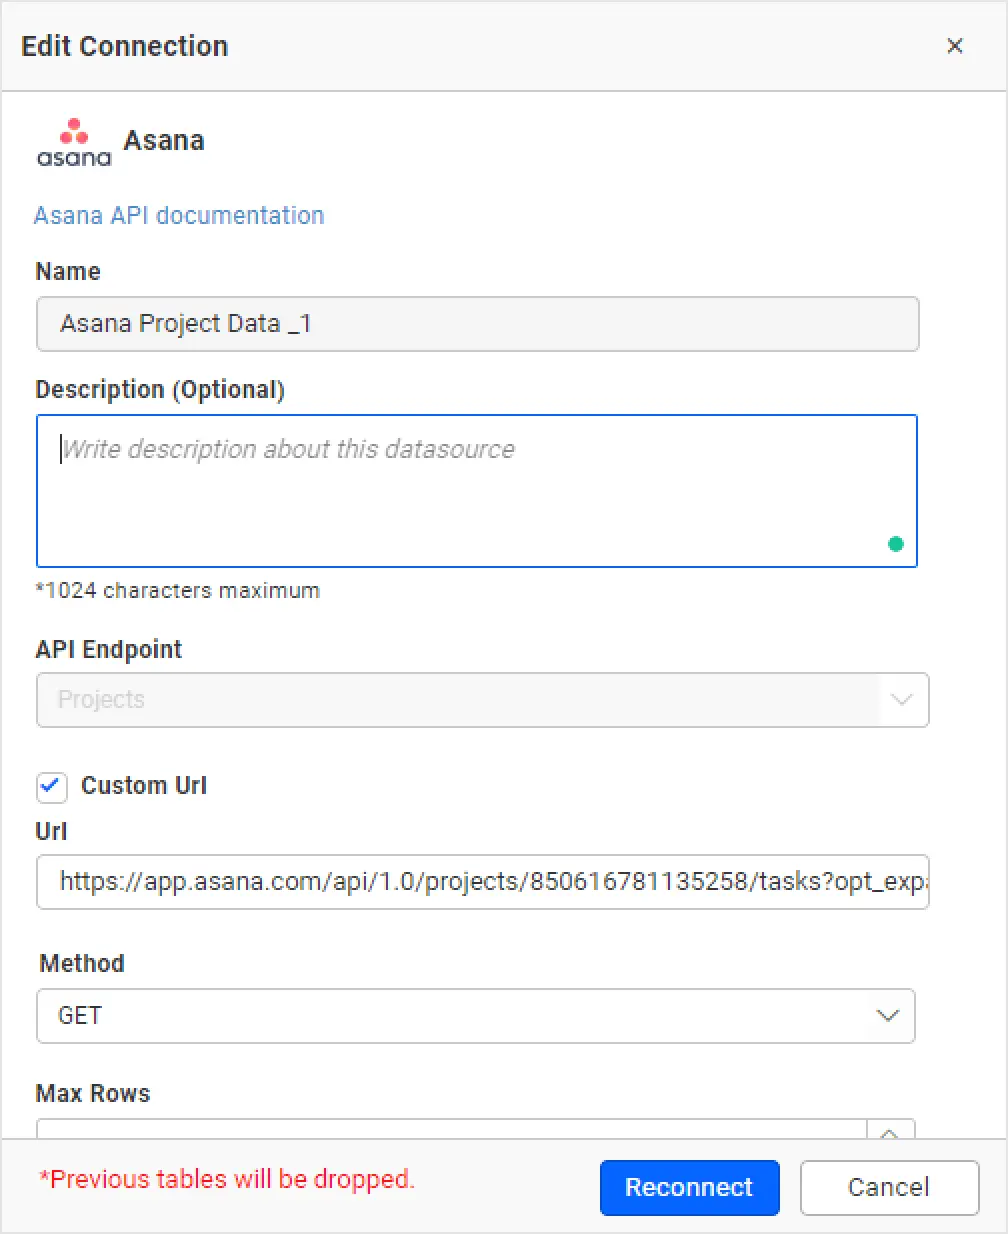
To create a dashboard, I would like to add more fields here by updating my endpoint URL. To do this, click Edit Connection, provide a custom URL, and click Reconnect.
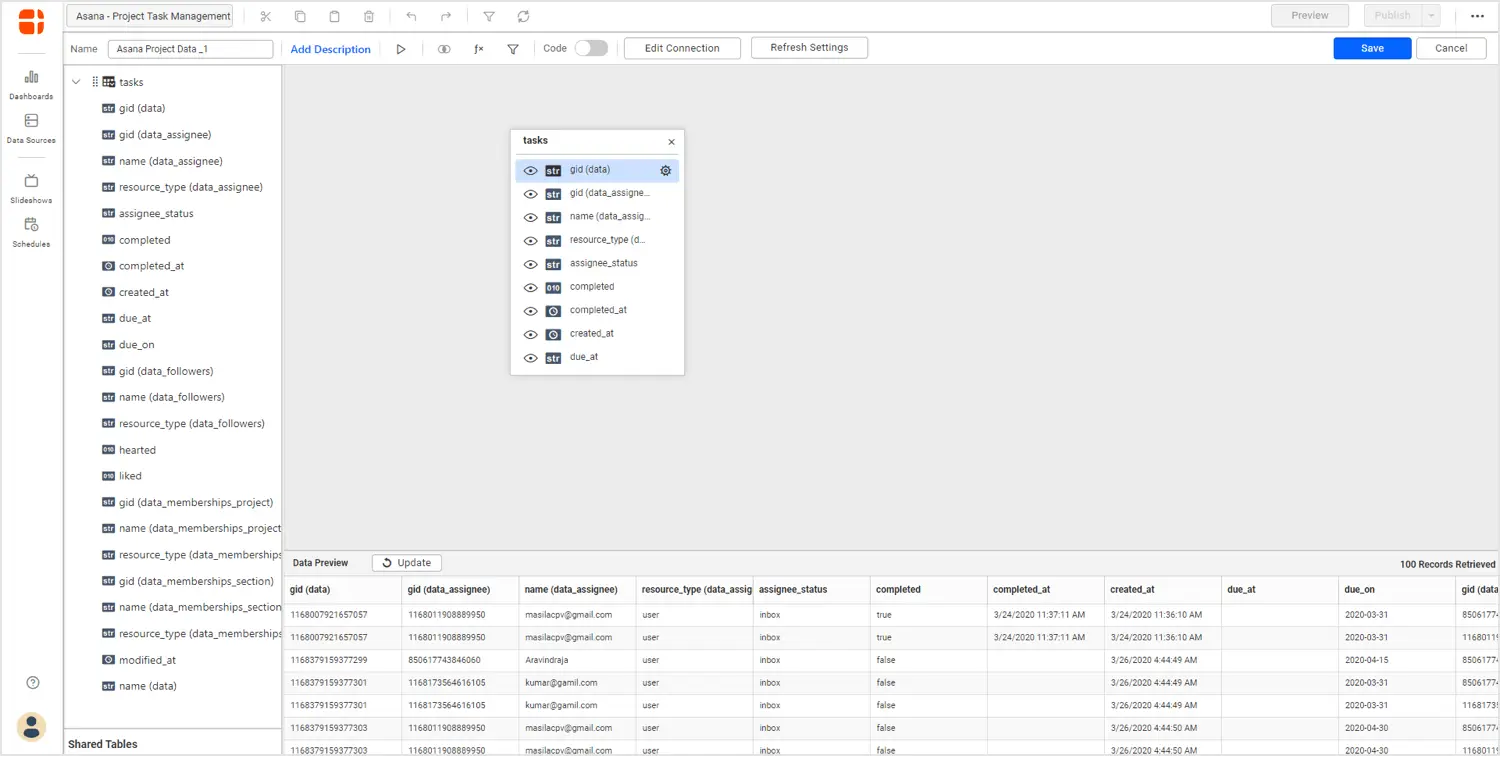
Now, you can see the fields are updated as per the endpoint given.
Drag and drop the table and save the Asana data source. Once the data source is created, add the required widgets to your dashboard and connect data to them to visualize the metrics.
Creating project overview dashboard
Let’s create a project overview dashboard with Asana data. Refer to the video titled How to Create a Dashboard – Bold BI Tutorial for Beginners if you’ve never set up a Bold BI dashboard before.
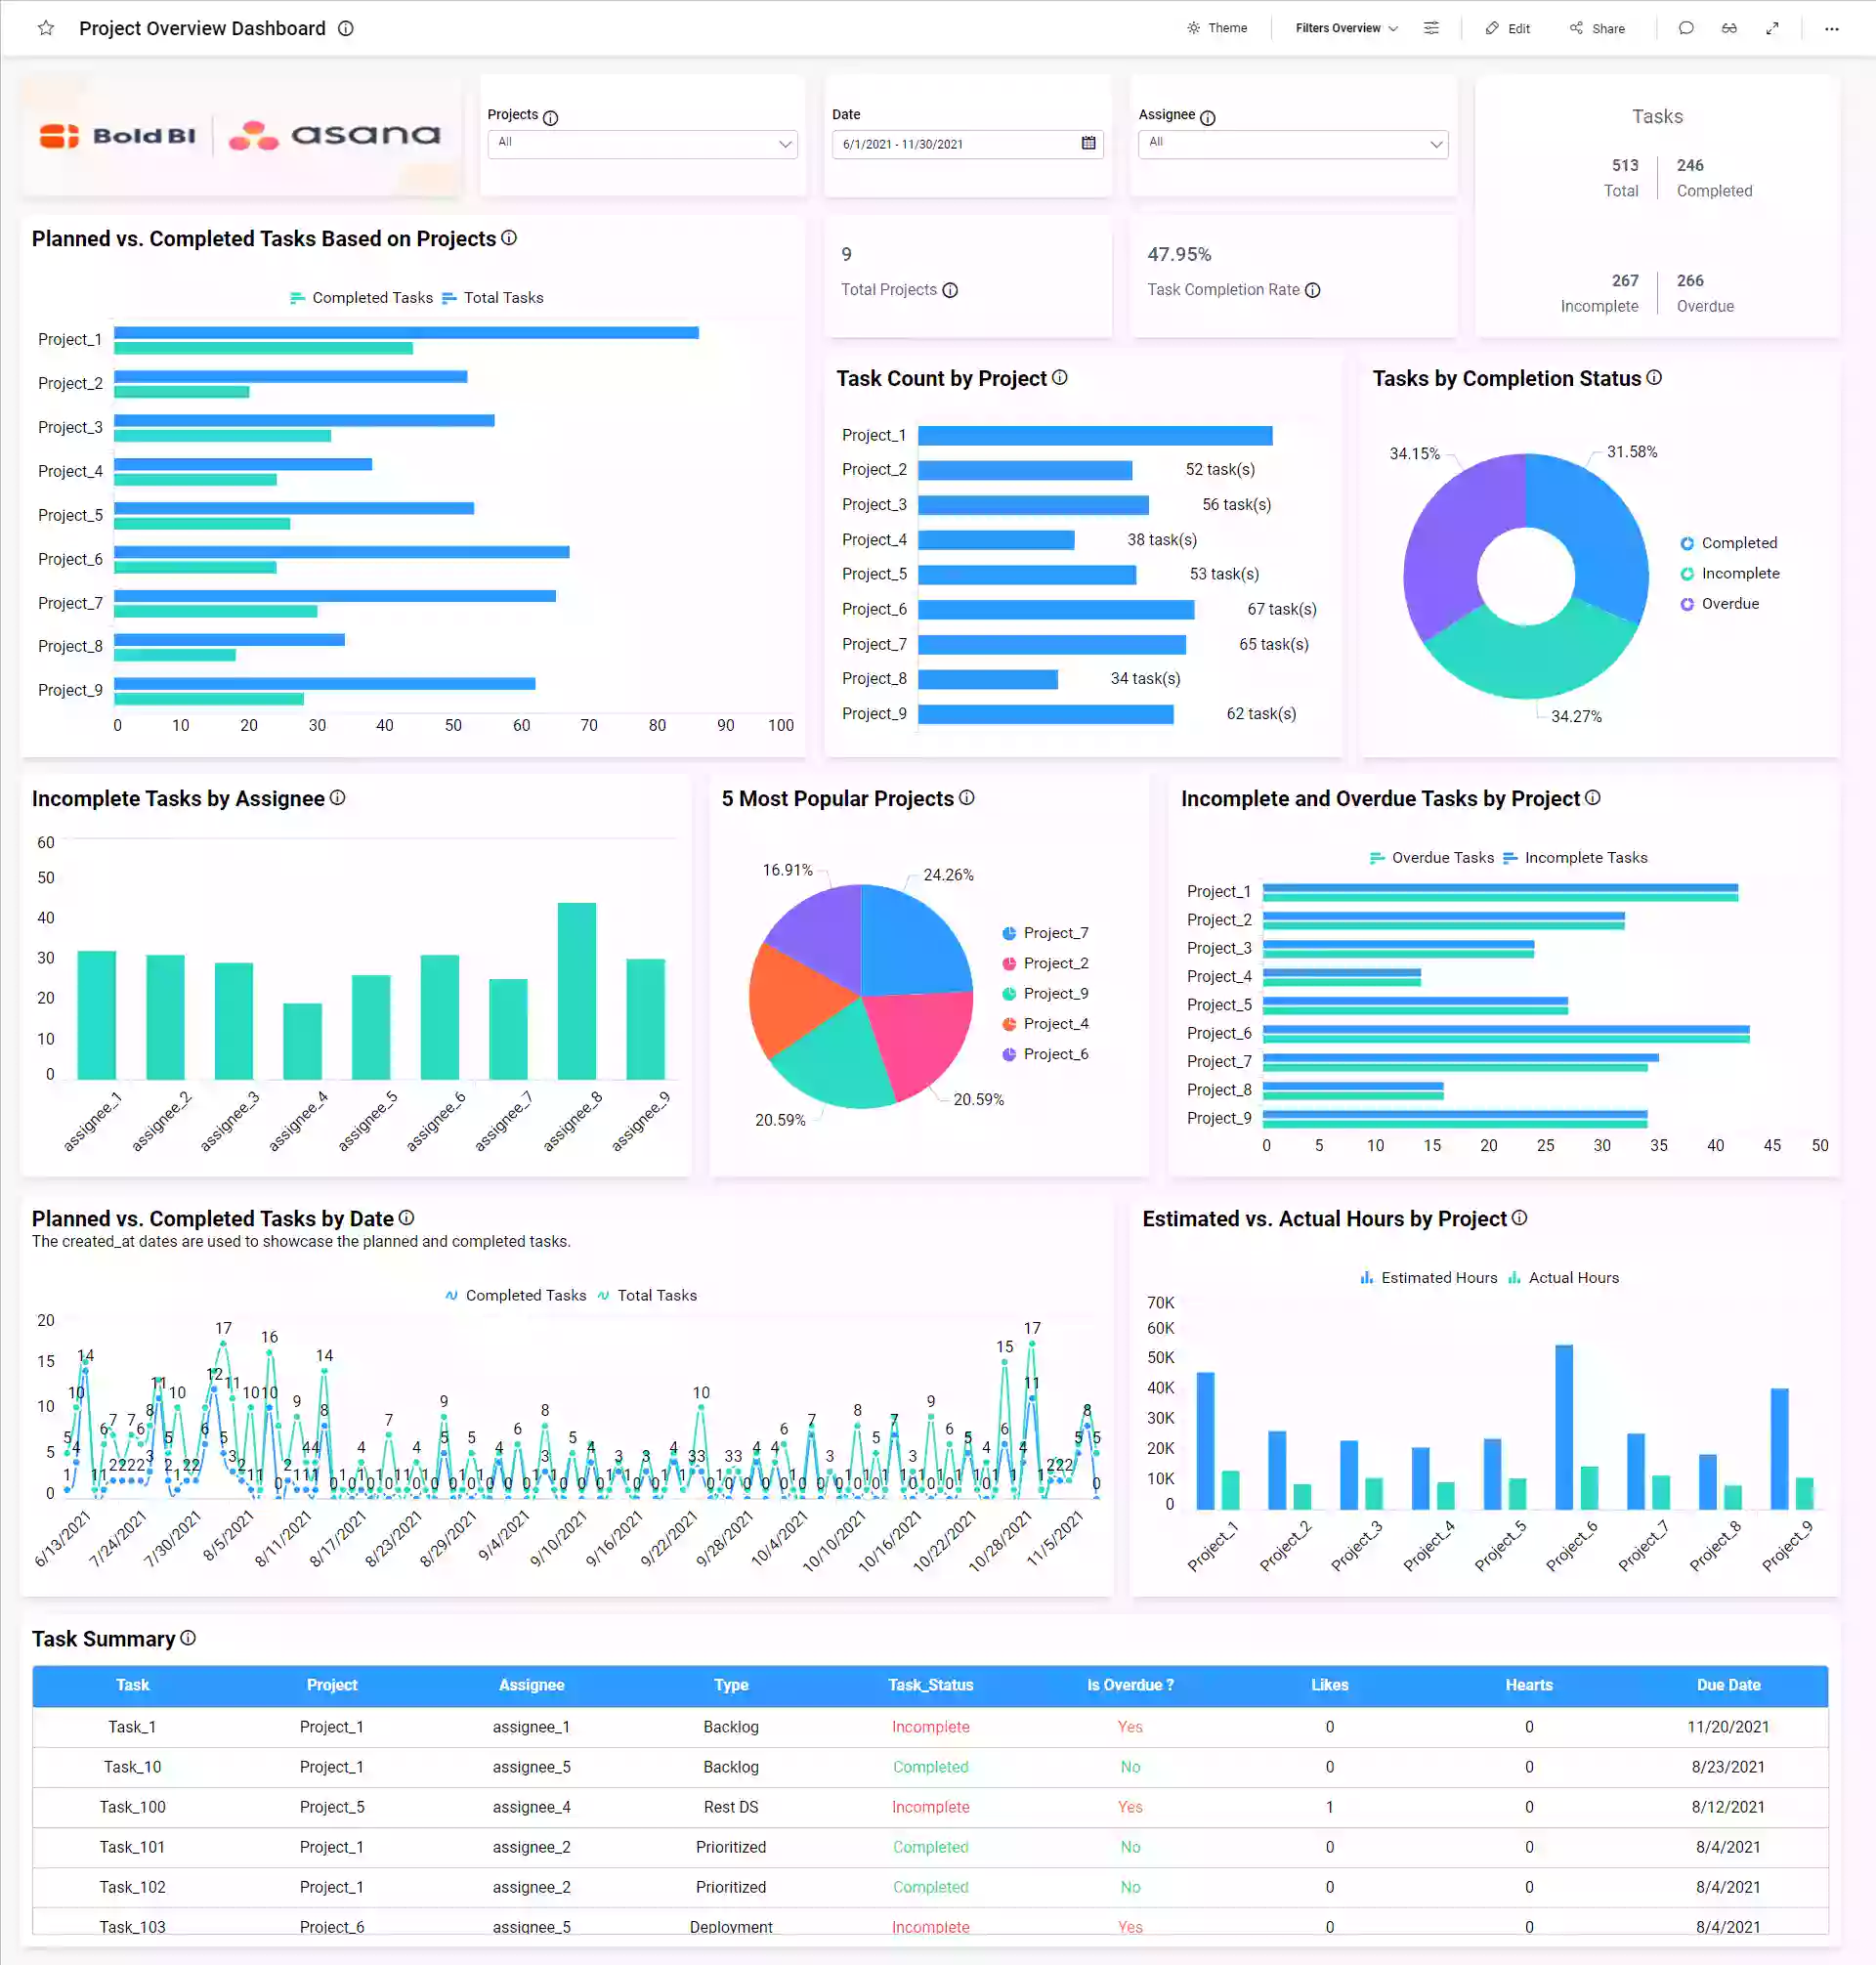
This dashboard focuses on tracking the work status of each project through the following metrics:
- Total projects
- Total tasks
- Completed tasks
- Incomplete tasks
- Overdue tasks
- Task completion rate
- Completed vs. planned tasks based on project
- Task count by project
- Tasks by status
- Incomplete tasks by assignee
- Incomplete vs. overdue tasks by project
- Planned vs. completed tasks by date
- Top 5 most popular projects
- Estimated vs. actual hours by project
- Task summary
With this dashboard, you can visualize the progress of important tasks in projects involving different teams. You can also break down results related to specific issues by status and assignee.
To learn more about the metrics and KPIs used in this dashboard example, refer to the Project Overview Dashboard demo.
Conclusion
We hope this article guides you in connecting Asana data and visualizing important information from your Asana account using Bold BI®. If you have any questions on this blog, please feel free to post them in the following comment section. Get started with Bold BI by signing up for a free trial and create more interactive business intelligence dashboards. You can also contact us by submitting your questions through the Bold BI website or, if you already have an account, you can log in to submit your support question.