

Customer relationship management (CRM) systems play a crucial role in managing customer interactions, streamlining business processes, and improving profitability. Nowadays, businesses ranging from startups to large enterprises are tailoring prebuilt CRM systems to fit their unique needs.
Microsoft Dynamics 365 is a package that provides CRM and enterprise resource planning (ERP) applications that accelerate business growth by helping businesses manage customer databases, generate new leads, and engage with customers.
In this blog post, we are going to see how to connect to and visualize Dynamics 365 Sales data in a sales manager dashboard created using Bold BI® through the following topics:
- What is Dynamics 365 Sales?
- Connecting to Dynamics 365 Sales data.
- Creating a sales manager summary dashboard.
- Creating a Microsoft Dynamics CRM data source.
- Bold BI’s Microsoft Dynamics CRM sales dashboard example.
Sales managers can gain insight into the sales pipeline, identify potential leads, and reach revenue targets with a dashboard like this.
What is Dynamics 365 Sales?
Dynamics 365 Sales is Microsoft’s CRM application dedicated to sales. It helps salespeople and sales managers track leads, contacts, and opportunities from a team’s sales pipeline. It comes with a free, 30-day trial. If you’re a Microsoft partner, you can access the applications through PartnerSource.
First, create your account with appropriate details.
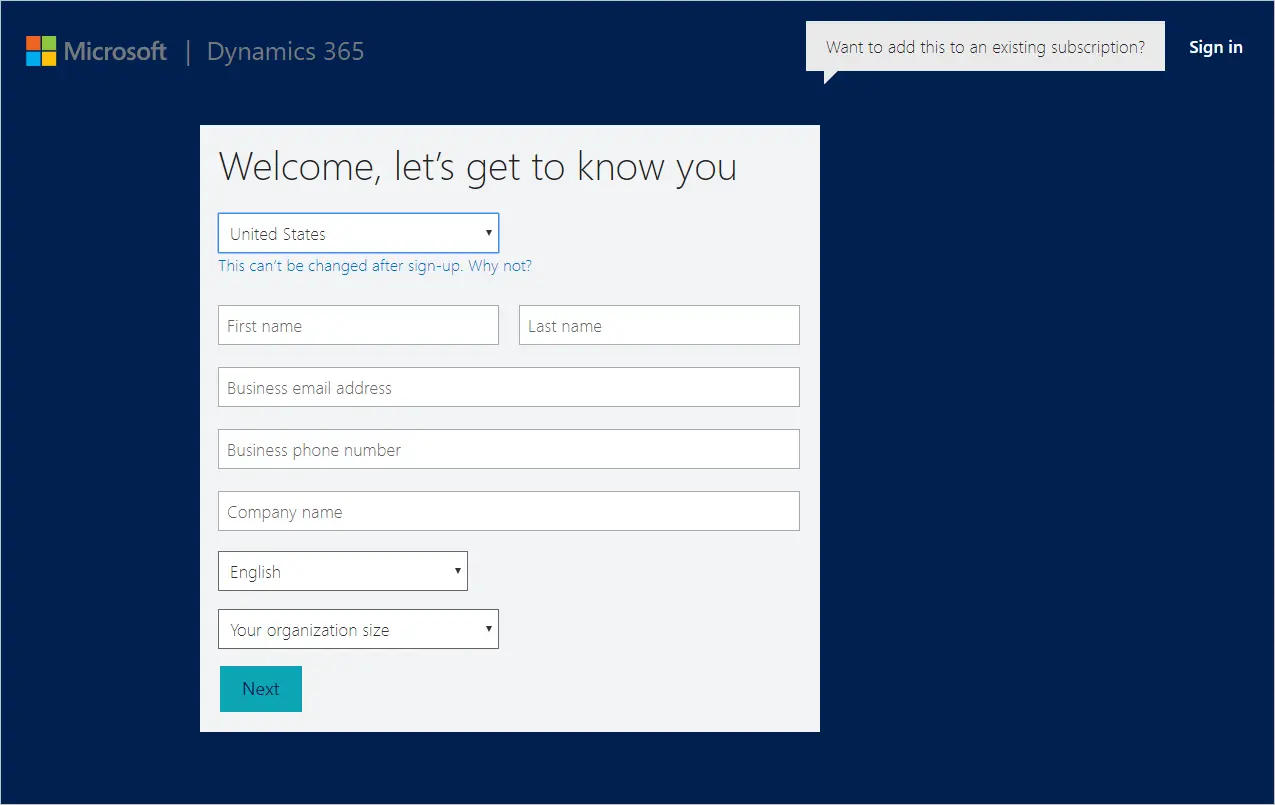
After setting up your account, the following page opens.
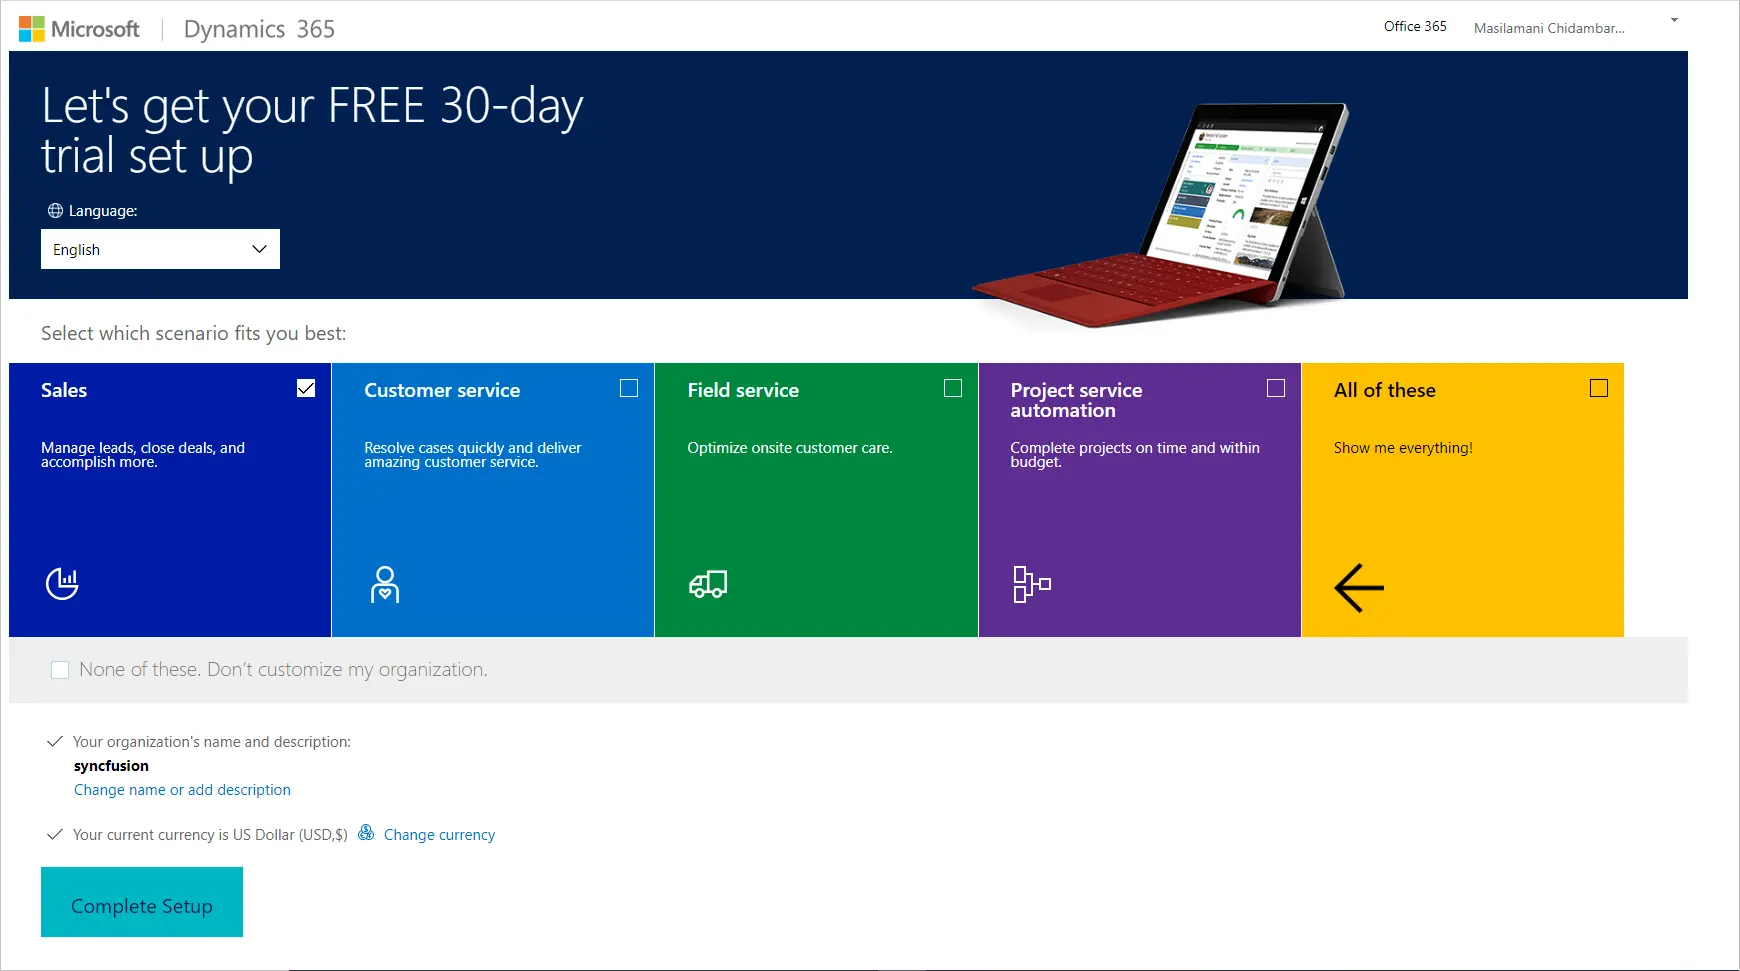
Your account details will be emailed to you once the setup completes. Click the link in the email that takes you to the CRM online trial, which will have sample data already installed. You can access all the data of the CRM, including sales, marketing, and service.
Now let’s see how to visualize sales data using Bold BI through the Microsoft Dynamics CRM Sales data connection.
Connecting to Dynamics 365 Sales Data
The Dynamics 365 web API allows you to retrieve data in Dynamics 365 entity instances through API requests. The base URL format for the Microsoft Dynamic CRM Web API is: https://<:your_organization_url>/api/data/v9.0/<:your_end_point>
Reference the following table to connect to Microsoft Dynamics and create a data source with appropriate APIs.
| End Points | Used For |
| GET [Organization URI]/api/data/v9.0/accounts | Getting data for an account entity instance. |
| GET [Organization URI]/api/data/v9.0/opportunities | Getting data for an opportunity entity instance. |
| GET [Organization URI]/api/data/v9.0/leads | Getting data for a lead entity instance. |
Refer to Microsoft Dynamics’ entity documentation for more entities.
Creating a sales manager summary dashboard
Let’s create a sales manager summary dashboard with Microsoft Dynamics CRM sales data. Refer to the video “How to Create a Dashboard – Bold BI Tutorial for Beginners” if you’ve never set up a Bold BI dashboard before.
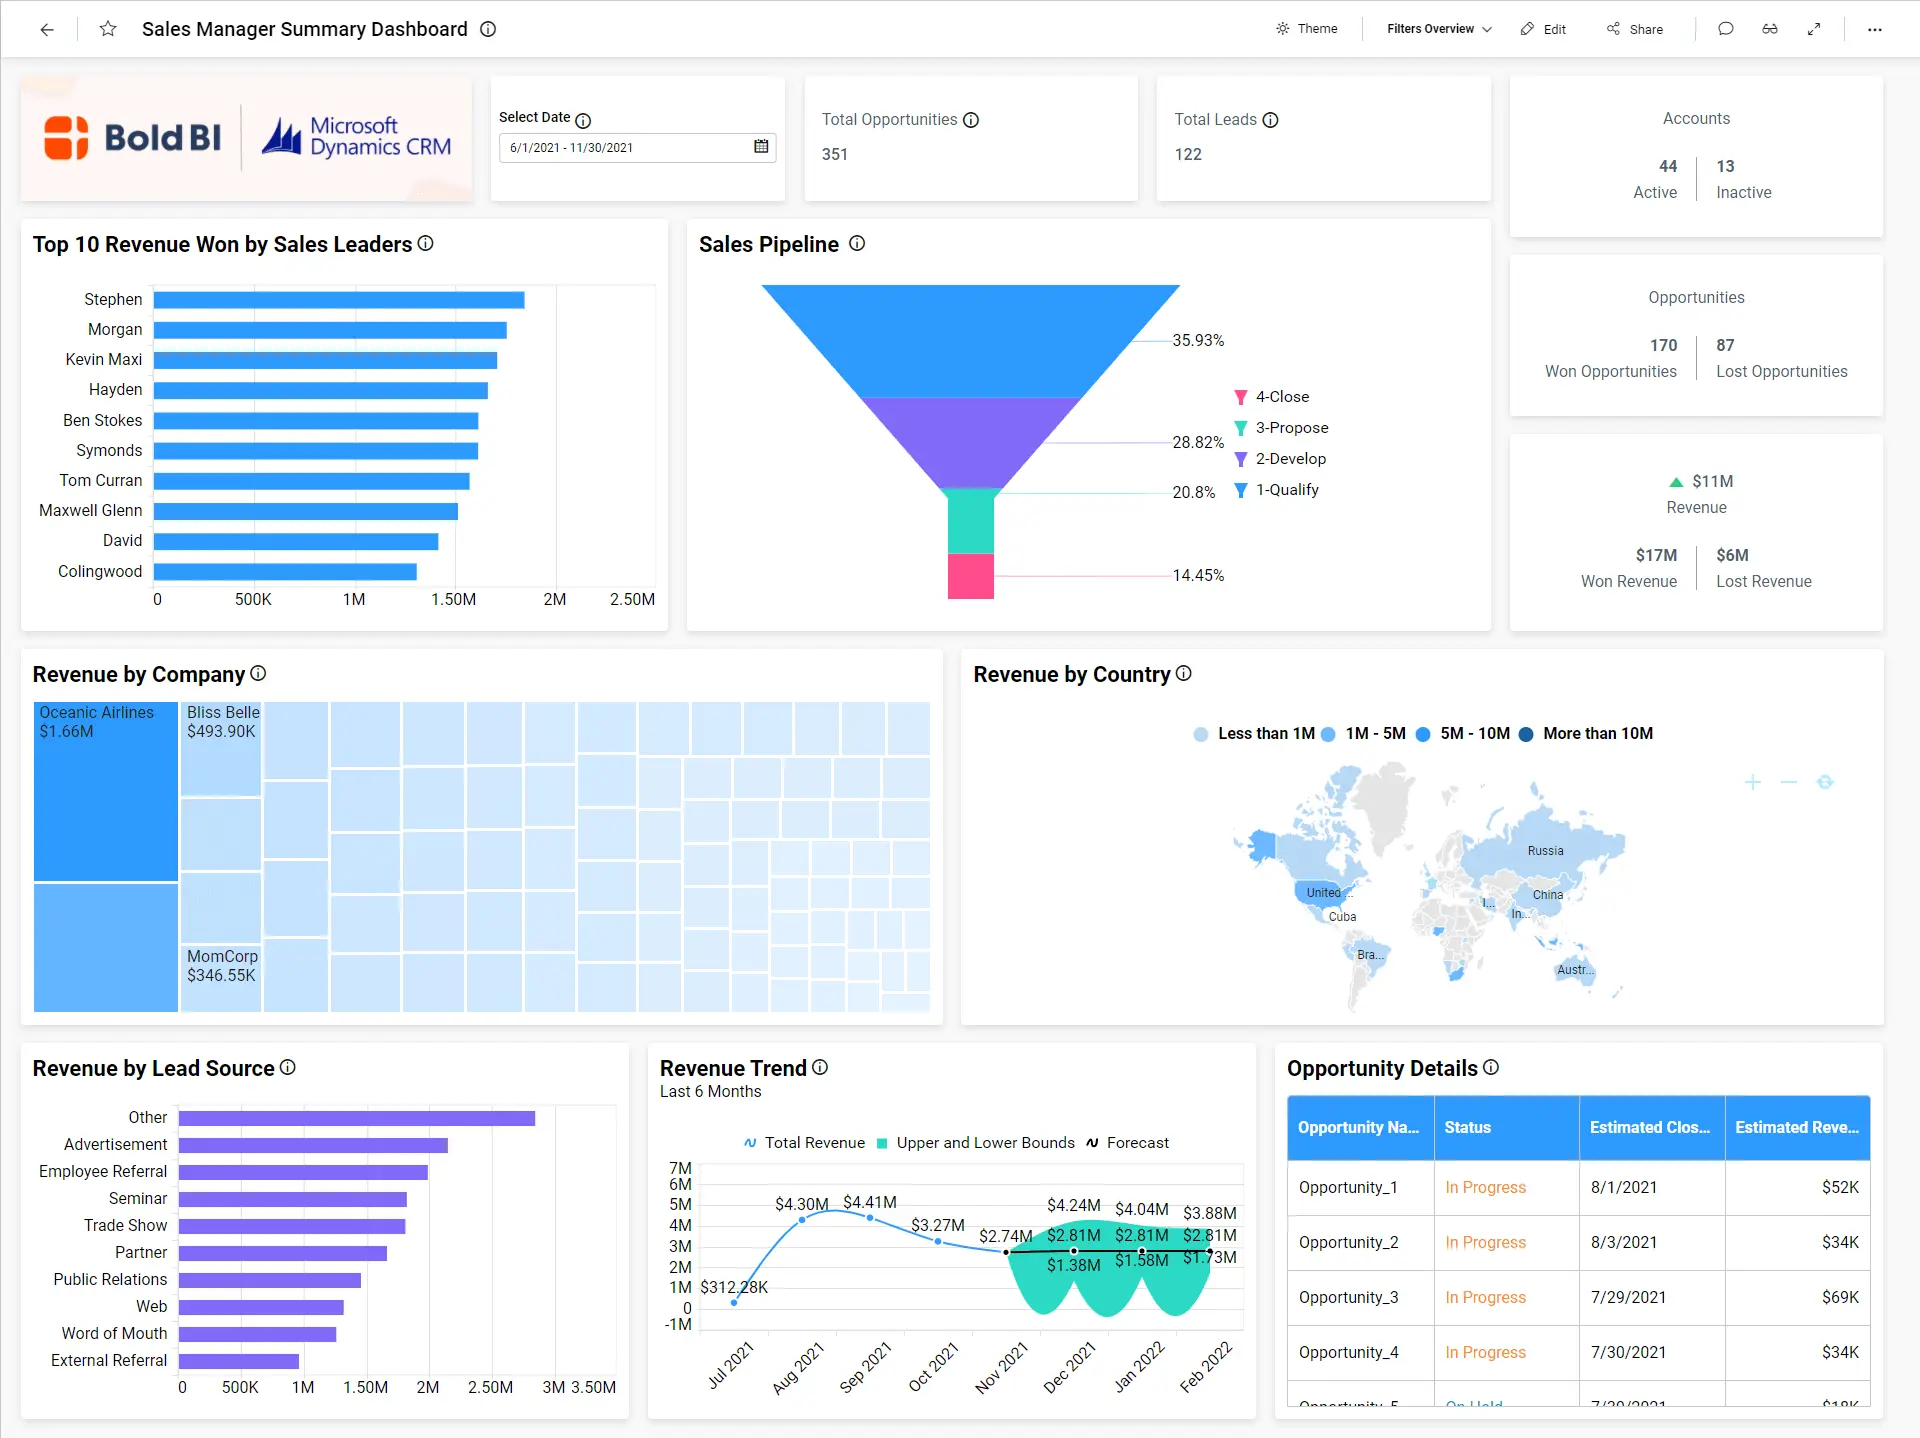
This dashboard showcases sales data through the following metrics, giving sales managers important insight into how the sales team is performing:
- Total opportunities
- Total leads
- Active vs. inactive accounts
- Won vs. lost opportunities
- Won vs lost revenue
- Sales pipeline for opportunity
- Revenue by lead source
- Revenue by company
- Revenue by country
- Revenue trend
- Won revenue by sales leaders
- Opportunities details
To learn more about the metrics and KPIs used in this dashboard example, refer to the Sales Manager Summary Dashboard demo.
Now let’s create a data source from the designer with Microsoft Dynamics data.
Creating a Microsoft Dynamics CRM data source
To create a Microsoft Dynamics Sales data source from the dashboard designer, follow the steps described in “Choose Microsoft Dynamics CRM data source” from Bold BI’s documentation. Also, use the steps in “Authentication with Microsoft Dynamics CRM” to authenticate with Microsoft Dynamics.
After successful authentication, the NEW DATA SOURCE configuration panel opens. Specify a unique name for the Microsoft Dynamics data source. Provide a valid Microsoft Dynamics REST API endpoint in the URL textbox. Leave the default value GET for the REST API under the Method section. Set the time interval for Refresh Settings so that the dashboard can refresh itself with the latest data updates.
Let the Data Format be JSON since the Accounts, Opportunity, and Lead API endpoints return results in JSON format. Microsoft Dynamics CRM Sales will be set automatically in the Authentication Type section since OAuth is used for authenticating with the Microsoft Dynamics CRM account.
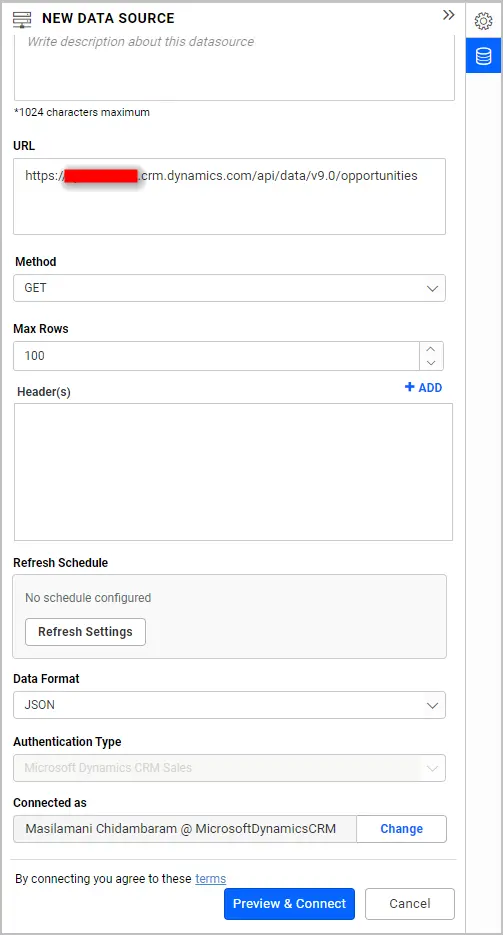
Click Preview & Connect. As a result, a window opens listing the data results as seen in the following image.
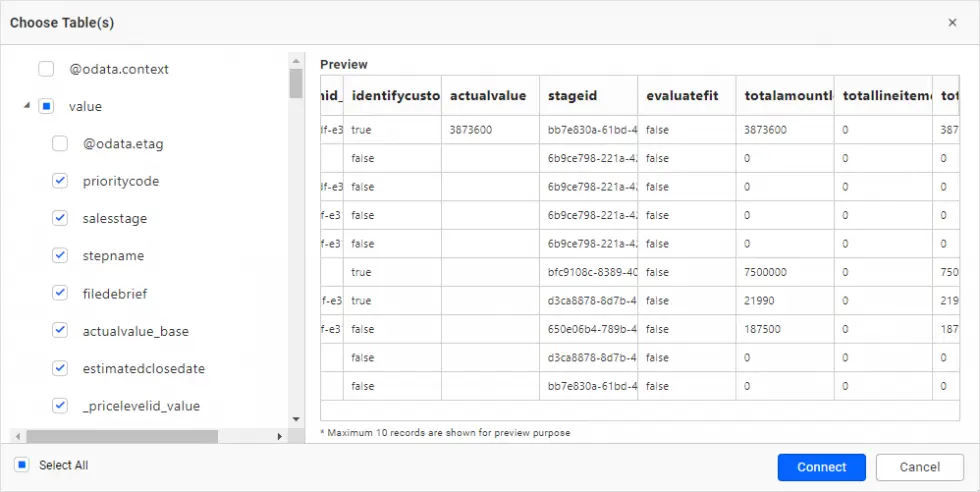
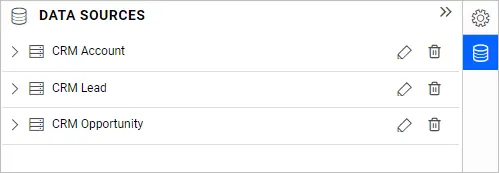
Choose the desired columns and click Connect. Drag and drop the table and save the data source. Finally, the created data sources will be added in the DATA SOURCES panel.
Create an expression column in the CRM Opportunity data source to calculate fields as shown in the following table.
| Expression Name | Expression |
| Opportunity Status | IF([statuscode]=1,’In Progress’,IF([statuscode]=2,’On Hold’,IF([statuscode]=3,’Won’,IF([statuscode]=4,’Canceled’,’Out-Sold’)))) |
| Opportunity State | IF([statecode]=0,’Open’,IF([statecode]=1,’Won’,’Lost’)) |
| Won Count | IF([Opportunity State]=’Won’,1,0) |
| Lost Count | IF([Opportunity State]=’Lost’,1,0) |
| Account Status | IF([statuscode]=1,’Active’,’InActive’) |
| Active Account | IF([Account Status]=’Active’,1,0) |
| Inactive Account | IF([Account Status]=’InActive’,1,0) |
| Lost Revenue | IF([Opportunity State]=’Lost’,[estimatedvalue],0) |
Now, the data source is ready to be configured with the widgets.
Configuring data to the widgets in a dashboard
Add the required widgets to your dashboard and configure them with corresponding data sources, as described in the following table.
| Widget Title | Configuration |
| Total Opportunities | Type: Number Card Data source: CRM Opportunity Measure: Count of Opportunity ID |
| Total Leads | Type: Number Card Data source: CRM Lead Measure: District Count of Lead ID |
| Accounts | Type: KPI Card Data source: CRM Account Actual Value: Active Account Target Value: Inactive Account |
| Opportunities | Type: KPI Card Data source: CRM Opportunity Actual Value: Won Count Target Value: Lost Count |
| Revenue | Type: KPI Card Data source: CRM Opportunity Actual Value: Estimated Value Target Value: Lost Revenue |
| Sales Pipeline for Opportunity | Type: Funnel Chart Data source: CRM Opportunity Value(s): Estimated Value Column(s): Step Name |
| Revenue by Industry | Type: Tree Map Data source: CRM Lead Value(s): Revenue Column(s): Company Name |
| Revenue Won by Sales Leaders | Type: Column Chart Data source: CRM Lead Value(s): Revenue Column(s): Full Name |
| Revenue by Country | Type: Map Data source: CRM Account Location Value: Revenue Location Name: Address1_Country |
| Revenue Trend | Type: Spline Chart Data source: CRM Opportunity Value(s): Actual Value Column(s): Actual Close Date |
| Opportunities Details | Type: Grid Data source: CRM Opportunity Column: Name,Estimated Close Date,Estimated Value,Opportunity Status |
Finally, the sales manager summary dashboard is ready. You can share it with your sales team by enabling access to it. Team members can view business information while working in Dynamics 365 Sales. For more details on sharing dashboards, refer to “Share Dashboards” in Bold BI’s documentation.
Bold BI’s Microsoft Dynamics CRM sales dashboard example
Sales Leads Tracking Dashboard
This sales leads tracking dashboard helps sales leads and managers track their top 10 accounts by revenue, accounts by country, total accounts, total leads, accounts by industry, leads by source and owner, top 10 owners by accounts, leads by rating, leads by campaign, lead generation rate, and lead summary.
To learn more about the metrics and KPIs used in this dashboard example, refer to the Sales Leads Tracking Dashboard demo.
Sales Opportunities Dashboard
This sales opportunities dashboard helps sales leads and managers track sales opportunities, including sales progress by country, total opportunities, deals won vs. lost by revenue, deals won vs. lost by owner, opportunity by rating, top 5 won opportunities, top 5 accounts by opportunities, campaign type, top 5 campaigns by opportunities, sales revenue by campaign, opportunity summary, opportunity status by owner, estimated vs. actual revenue, and top 10 customers by estimated revenue.
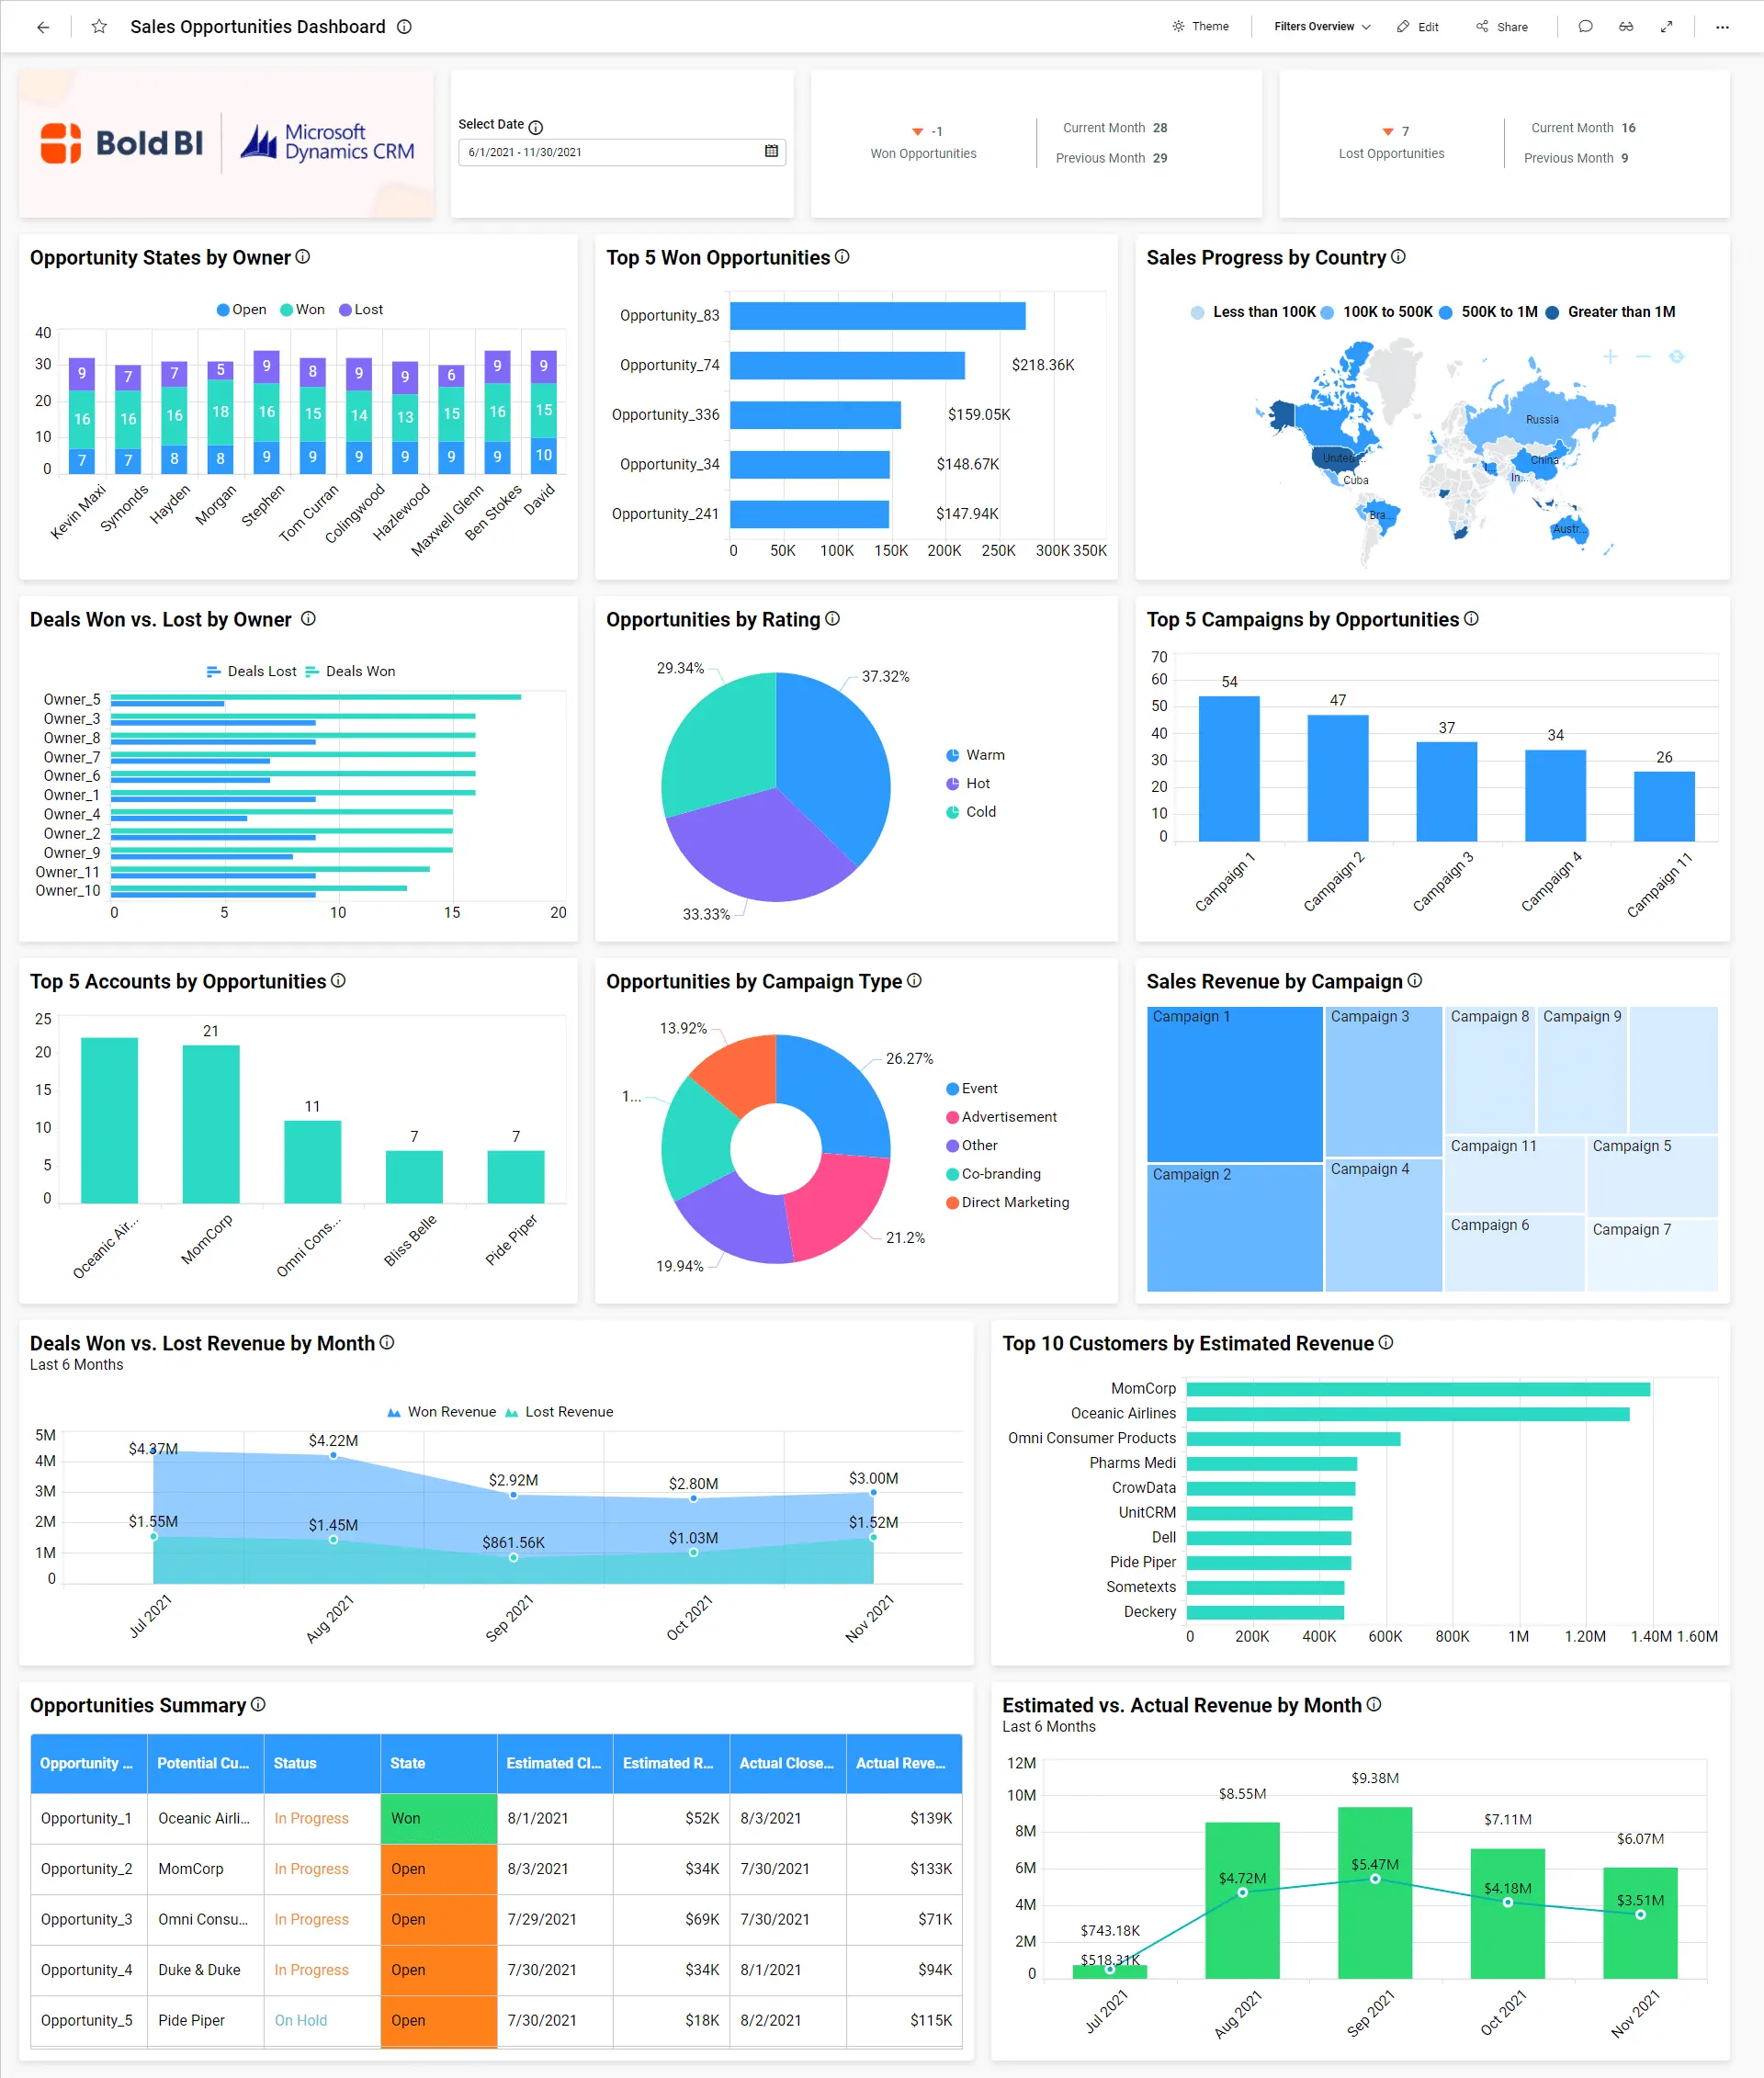
To learn more about the metrics and KPIs used in this dashboard example, refer to the Sales Opportunities Dashboard demo.
Bold BI –
Conclusion
So, now you know how to connect to Dynamics 365 Sales data and visualize important information from your sales pipeline using Bold BI®. If you have any questions on this blog, please feel free to post them in the following comment section. Get started with Bold BI by signing up for a free trial and create more interactive business intelligence dashboards. You can also contact us by submitting your questions through the Bold BI website or, if you already have an account, you can log in to submit your support question.