

Infusionsoft, by Keap, is a sales and marketing automation tool for small businesses. It offers an all-in-one CRM and advanced marketing automation platform that lets users manage their small service businesses by pulling data points together related to sales, marketing, leads, payments, customers, and more. Bold BI® allows them to connect Infusionsoft data with a dashboard to track their periodical sales metrics and KPIs, such as contact details, orders, subscriptions, and revenue progress.
In this blog, let’s see how to track periodical information of sales-related metrics like contacts, orders, subscriptions, and revenue through KPIs and visualize them using a Bold BI dashboard.
Defining sales metrics
The following are some sales metrics from Infusionsoft data that sales leaders can track to improve and ensure their performance:
- Total contacts of converted leads.
- Subscription and revenue rate.
- Orders and subscriptions over a time period.
- Top revenue through orders by date.
- Payment status over a time period.
- Revenue vs. refunds over a time period.
Let’s see how each of these metrics can be visualized through KPIs in a Bold BI dashboard that sales managers and executives can then use to track and measure the sales team’s performance to improve the revenue of their business.
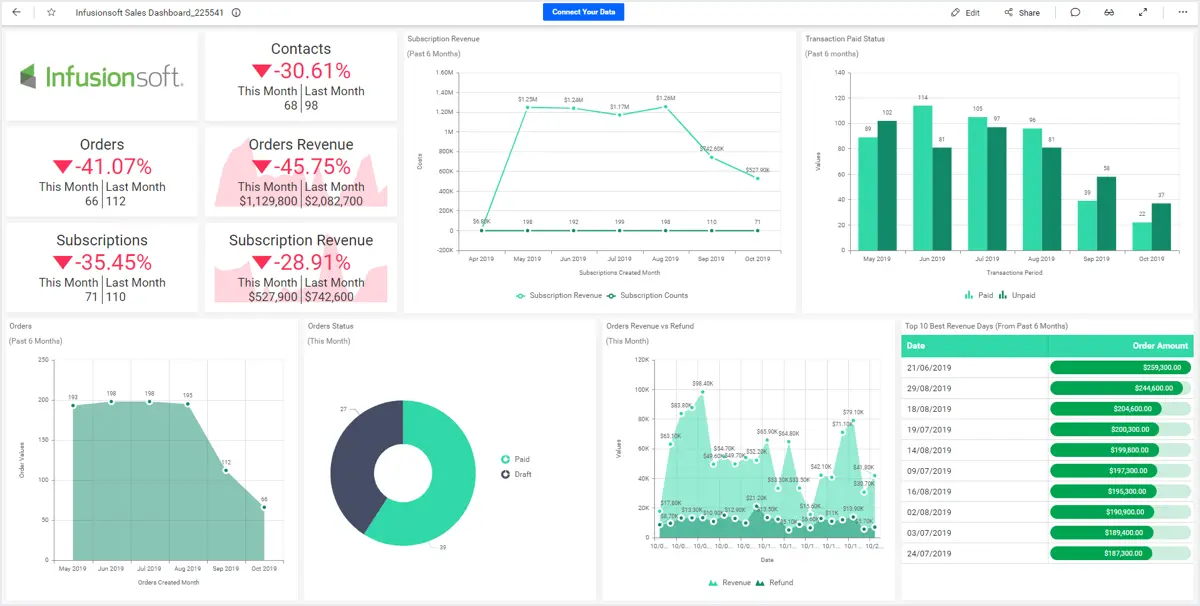
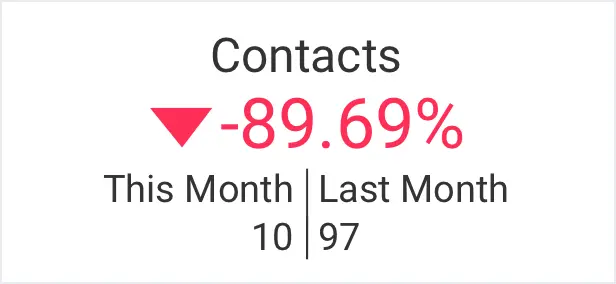
Total contacts with converted leads
By comparing the number of contacts with converted leads between the current and previous months, team managers can take necessary action to improve in next month. They can reduce duplicate emails sent and increase open-rate emails about their services and product, for example.
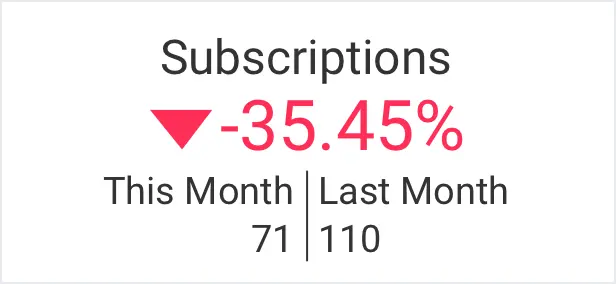
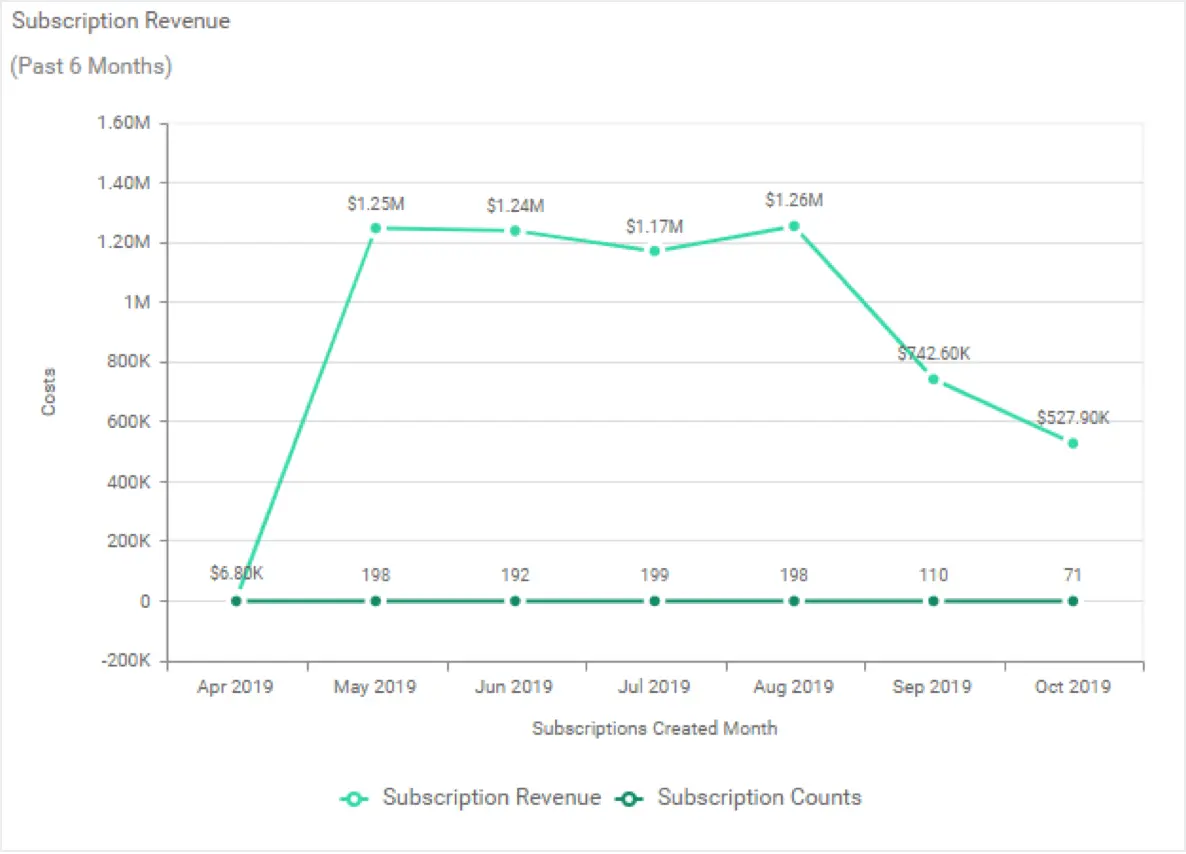
Subscriptions and revenue rate
The following KPI card visualizes the subscriptions and revenue comparatively between the current month and the previous month.
Knowing the subscription count, sales managers can easily see which subscription plan gets less attention and why. This lets them focus on improving the subscription plan for more revenue.
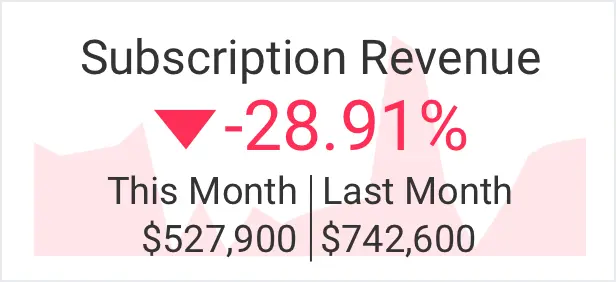
Sales teams need this KPI to calculate how much revenue has been generated through order subscriptions over a time period. The line chart is best to showcase the trends over a time period with a straight line connecting the data points.
The total count of orders over a time period is showcased in an area chart. This KPI will provide information about the number of orders received during a time period, which lets you determine whether you’ve met the target or not.
Knowing this info, sales leads and executives can decide where to increase promotional offers in order to increase orders from customers, leading to increases in subscription revenue.
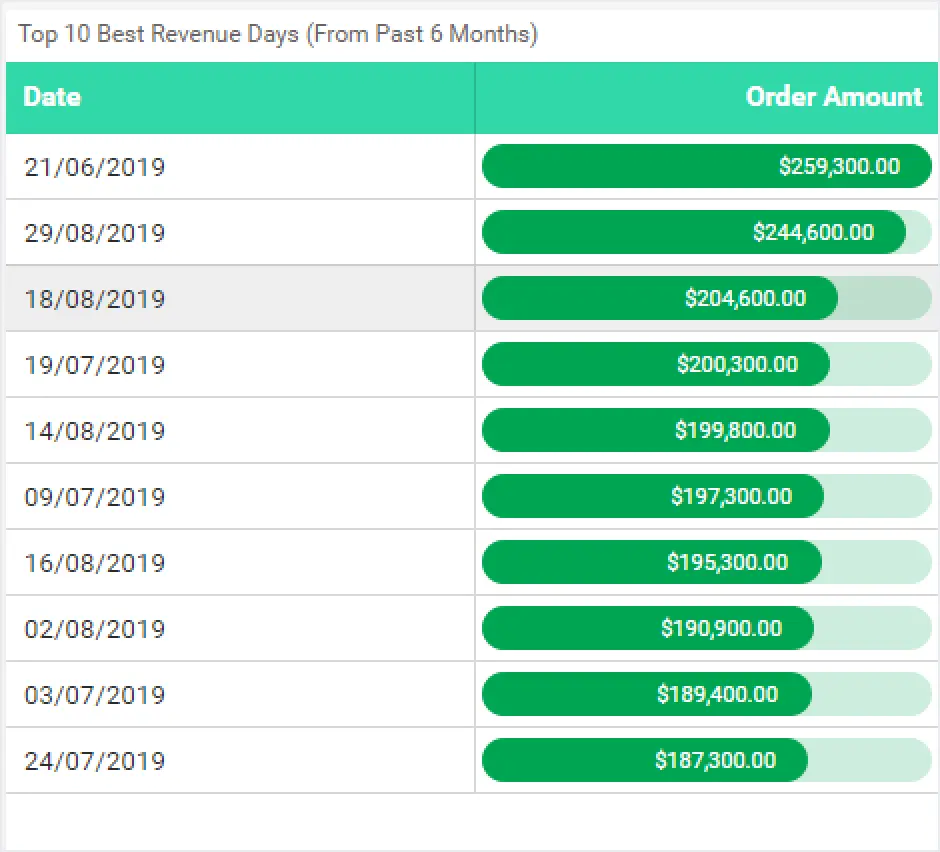
Top revenue through orders by date
This KPI lets you identify when the revenue through orders is increasing or decreasing. A grid widget with a status bar column is good to showcase this metric.
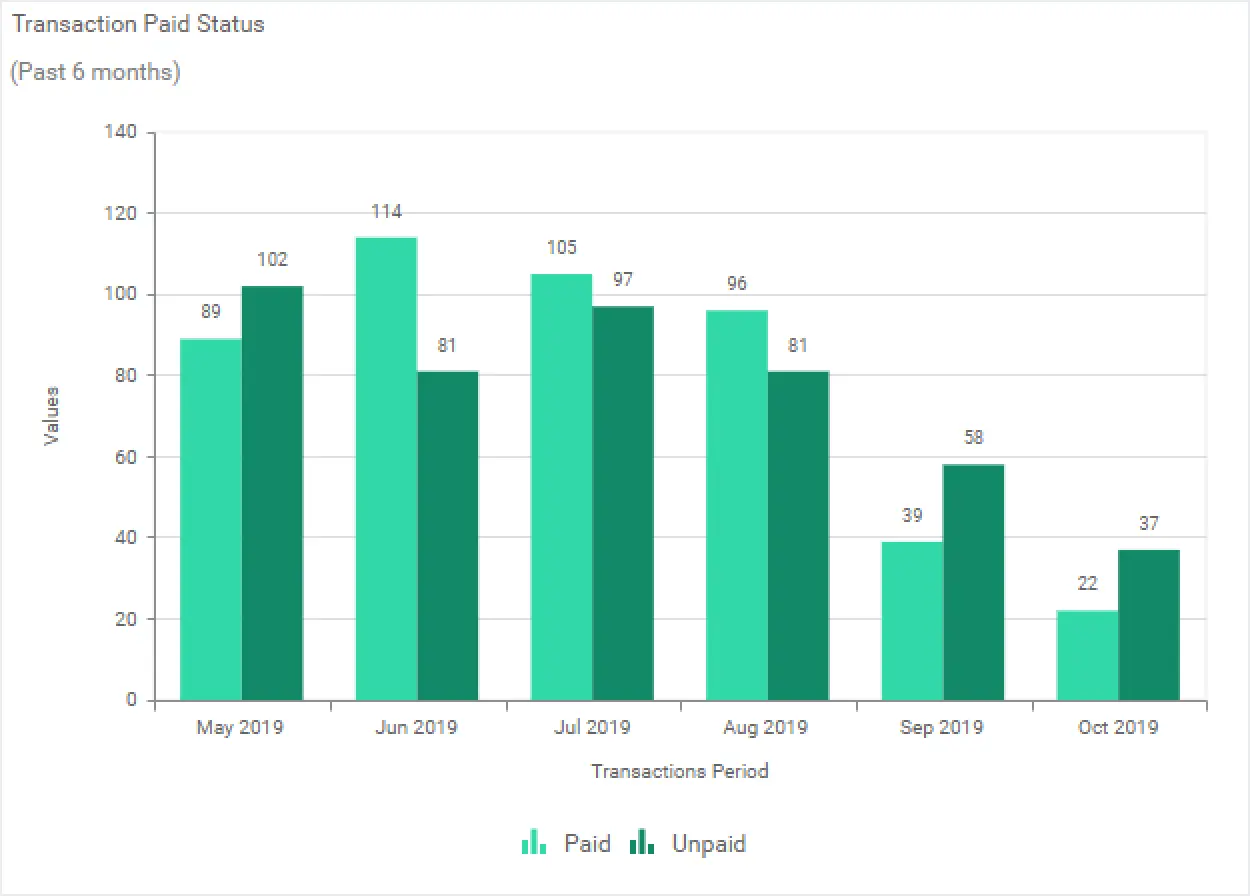
Payment statuses over a time period
The following column chart shows payment statuses over a time period. With this, a sales team can easily compare the values with vertical bars. This metric helps them identify:
- When the count of unpaid customers increases or decreases.
- Where customers struggle to proceed further to pay.
- Which subscription plan did not perform as well as others.
With these metrics, they can plan next to convert unpaid payments to paid ones and improve their services.
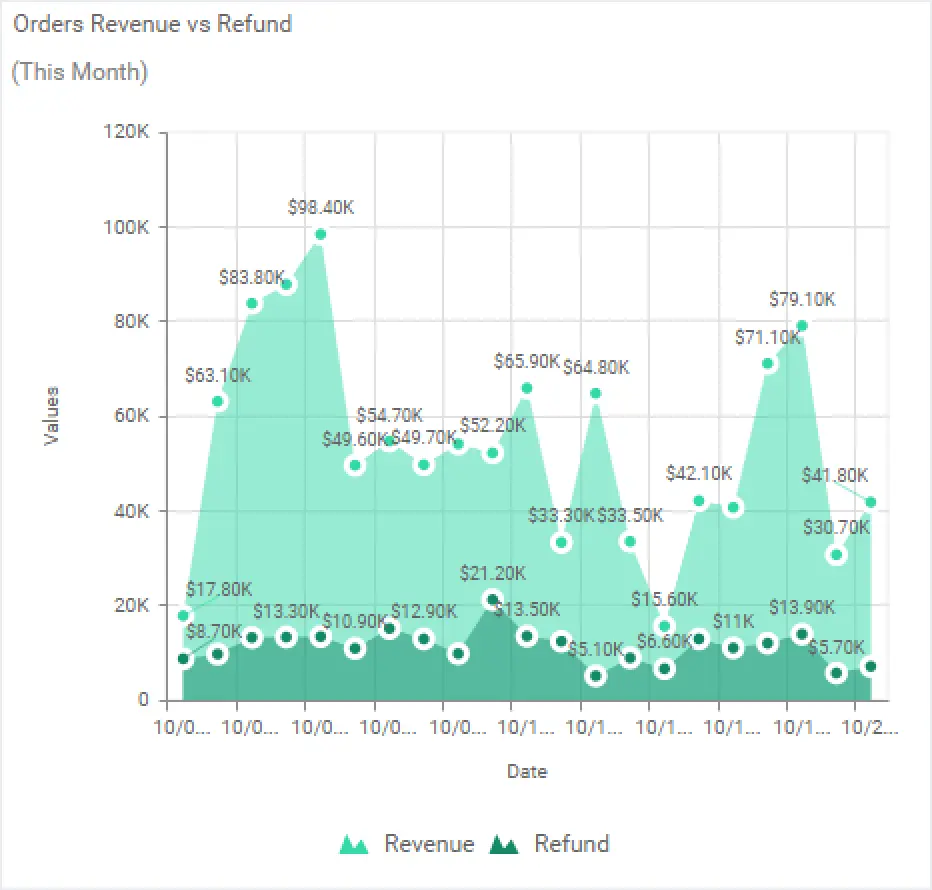
Revenue vs. refunds through orders by date
This KPI showcases the revenue generated and refunds required over a time period. A stacked area chart is best to compare revenue and refund measurements through filled curves stacked one atop another. This lets users identify when the refunds increase and determine which batch of products align with that date to see if quality was compromised. They can then take necessary action to improve customer satisfaction through good quality product delivery to avoid returns.
Fetch Infusionsoft data
Infusionsoft provides REST APIs to fetch data from a Infusionsoft account. Connect to Infusionsoft and create a data source with appropriate APIs like in the following table.
| Subscriptions | https://api.infusionsoft.com/crm/rest/v1/subscriptions |
| Transactions | https://api.infusionsoft.com/crm/rest/v1/transactions |
| Contacts | https://api.infusionsoft.com/crm/rest/v1/contacts |
| Orders | https://api.infusionsoft.com/crm/rest/v1/orders |
Let’s see how to create a dashboard to visualize the discussed KPIs using Bold BI.
Creating Infusionsoft dashboard using Bold BI
Let’s start creating a dashboard using the Bold BI solution.
First of all, if you are new to Bold BI dashboards, sign up for a free trial on our website. At the end of the registration process, you will reach the following page.
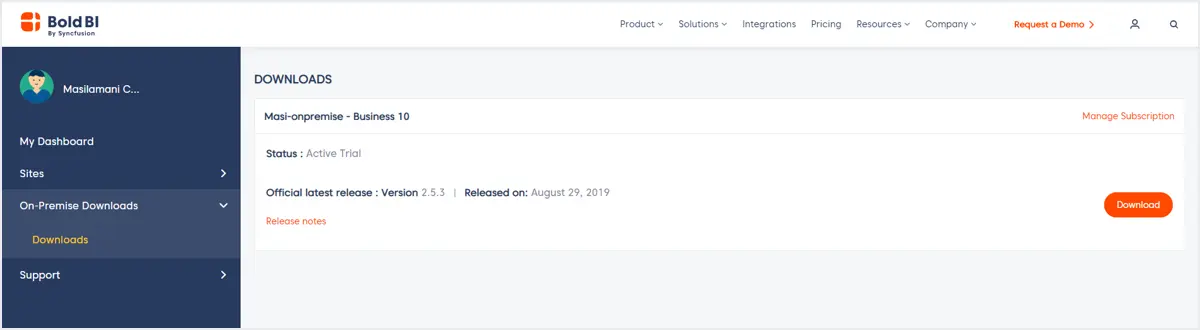
You can download the latest version and launch it in your machine. If you are not familiar with deploying Bold BI Enterprise, refer to this documentation. Bold BI Enterprise’s server will launch, as shown in following image.
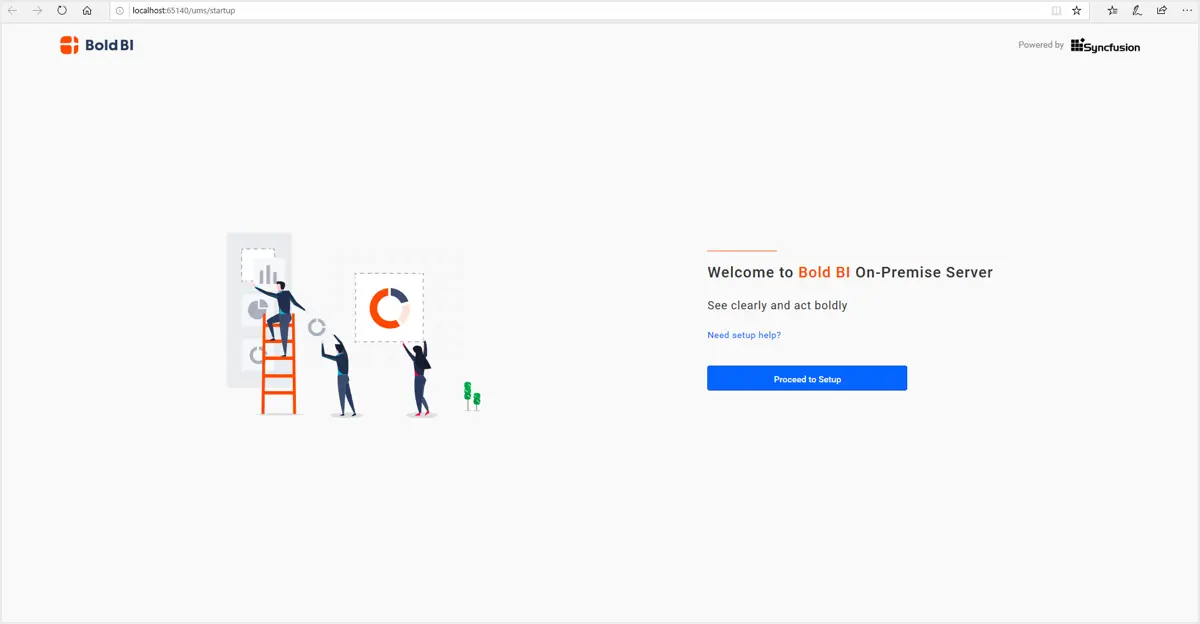
Follow the steps to startup the Bold BI Enterprise application. Afterwards, the homepage will open.
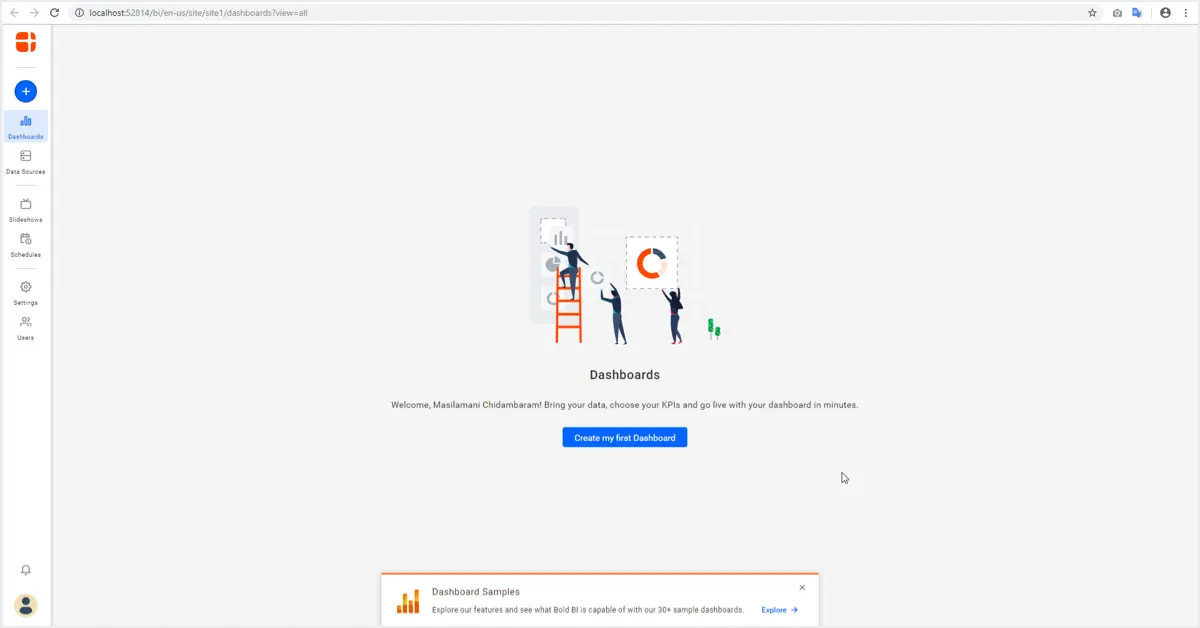
Check out our tutorial video to learn how to create a dashboard from scratch. To create the Infusionsoft data source from the dashboard designer, click the Data Sources button in the configuration panel and select the Infusionsoft connection in the connection panel.
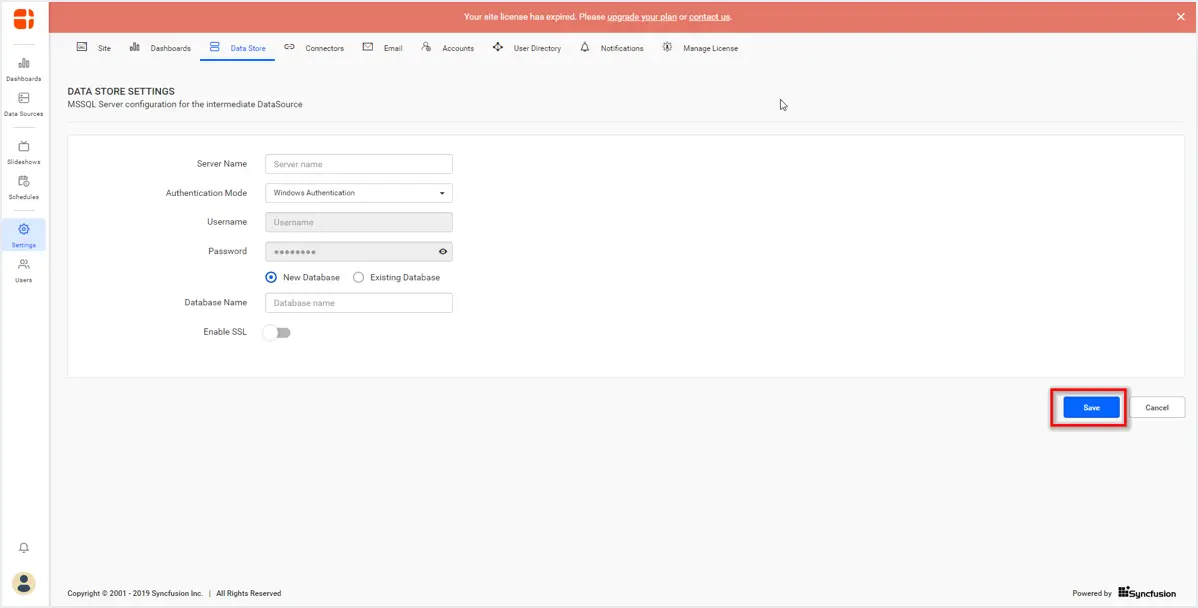
Once you’ve selected the Infusionsoft connection, an alert window will open to set the intermediate database for data storage. Click the settings hyperlink on the window.
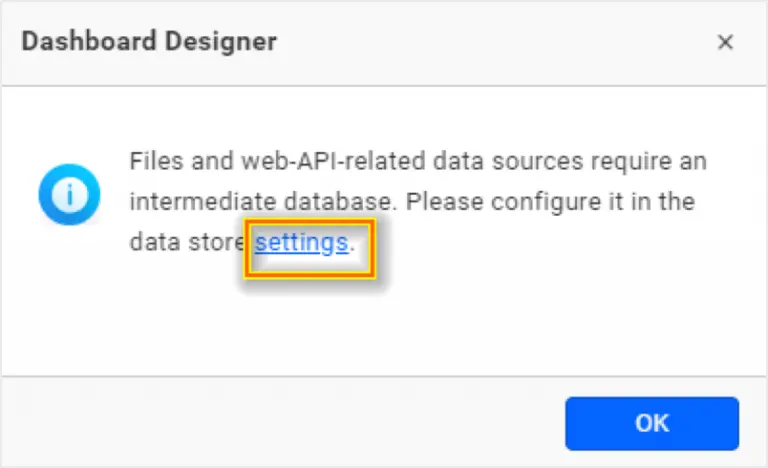
The data storage setting page will open, as shown in following image. Configure your SQL server details and save.
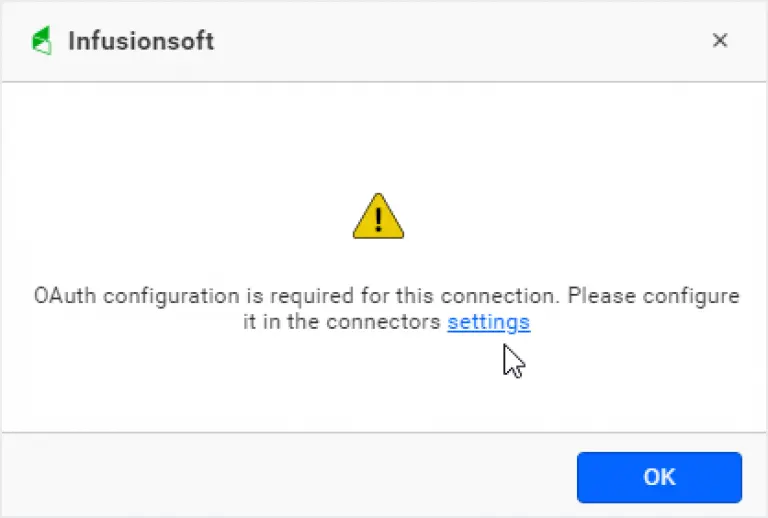
After that, choose the Infusionsoft connection again in the connection panel. An alert window will open for OAuth configuration. Subsequently, click settings on the window.
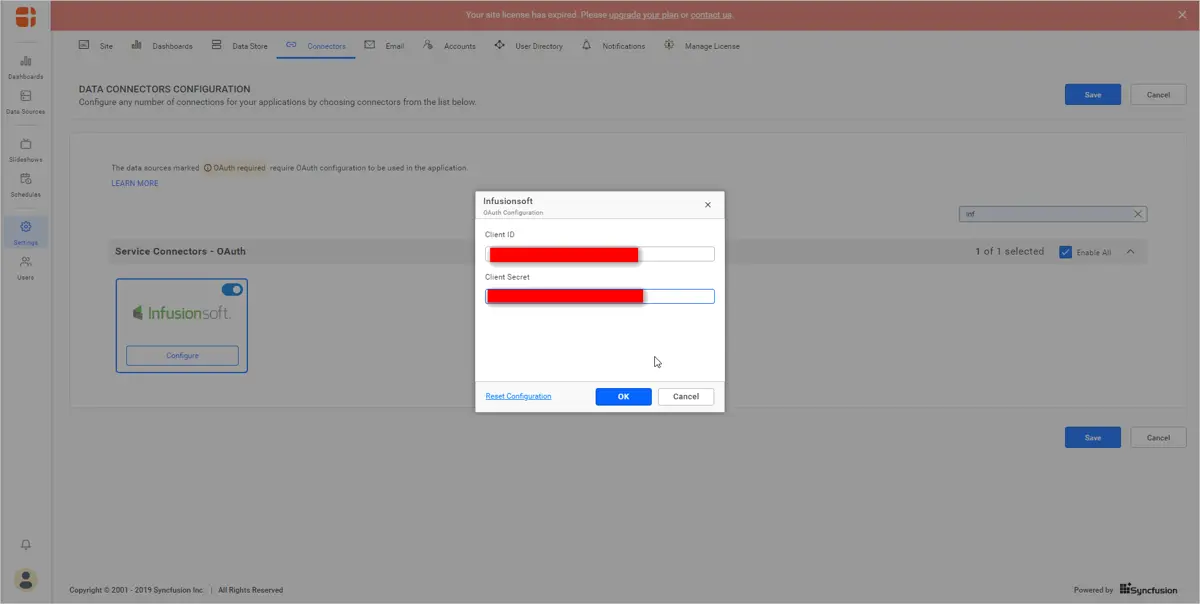
Now the data connector configuration page opens. Select the Infusionsoft connection and configure the client ID and secret of your Infusionsoft account.
Now, you can create your Infusionsoft data source. Follow the steps in this documentation to create the Infusionsoft data source, add required widgets to your dashboard, and connect data to them to visualize metrics.
Conclusion
We hope this article helps you understand how to monitor sales metrics and KPIs to motivate your sales team with Infusionsoft using Bold BI® dashboards. If you have any questions on this blog, please feel free to post them in the following comment section. Get started with Bold BI by signing up for a free trial and create more interactive business intelligence dashboards. You can also contact us by submitting your questions through the Bold BI website or, if you already have an account, you can log in to submit your support question.