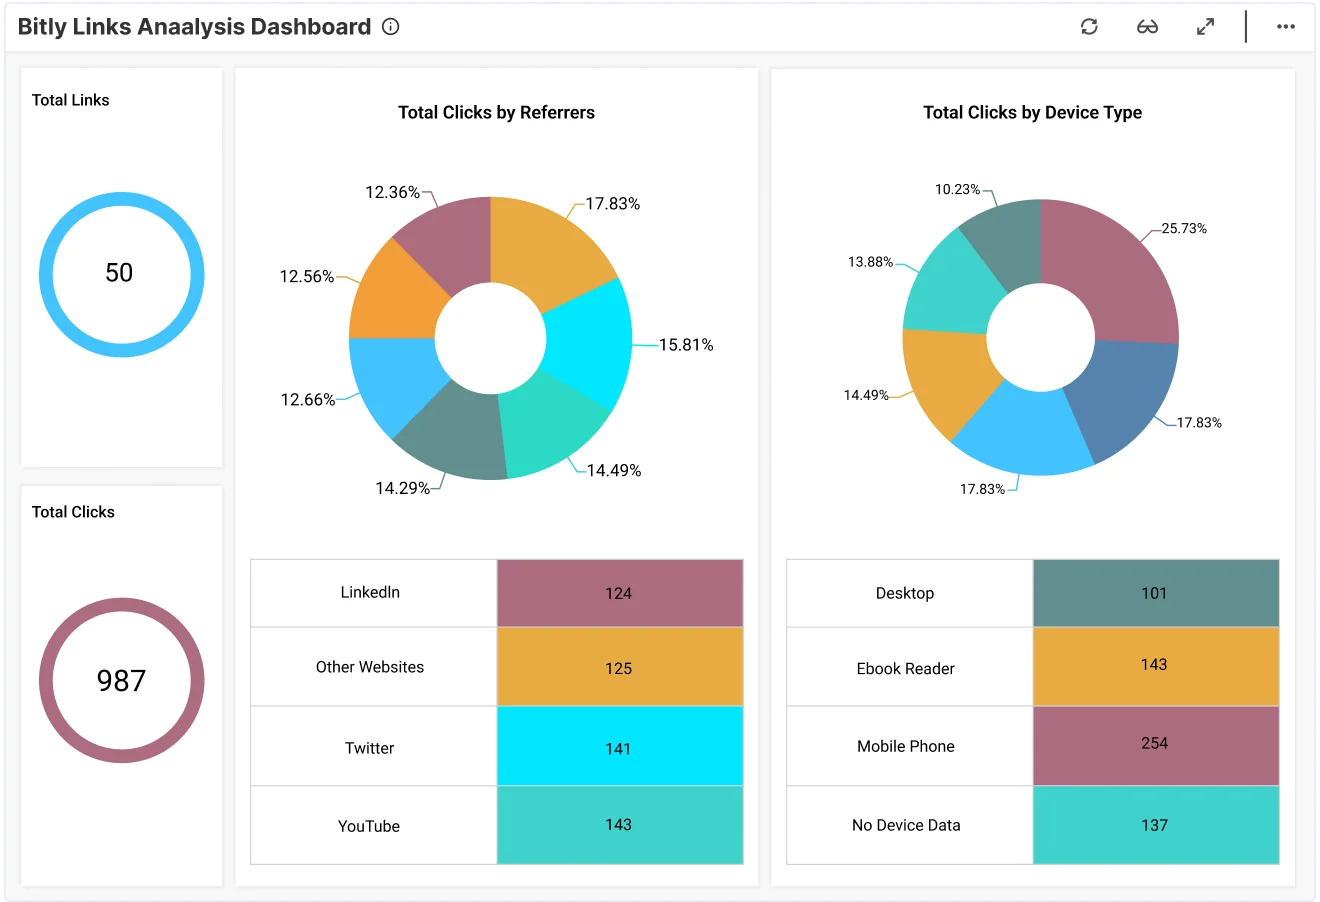
This bitly links analysis dashboard provides a detailed overview of a company’s Bitly metrics. With this dashboard, leaders can answer the following questions:
Firstly, how many links are we managing?
Secondly, across the world, where are we seeing the most activity?
Thirdly, which sources produce the highest amount of clicks?
Finally, within the past month, what are the total number of clicks?
With eye-catching graphs, leaders will be able to monitor KPIs relating to all of their URLs. From spline charts to bar charts, the graphs give a thorough visual reflection surrounding link, click, and tag metrics. For example, business professionals can quickly track total links, clicks, and tags with number boxes. In addition, the colorful bar graphs provide insights into the top five links by clicks and the total shortened links by tags.
Next, tracking past activity enables leaders to see URL activity from a rear-view perspective. For instance, leaders can view total links created by date and total clicks by date over the past seven days with the use of spline charts. Both charts make it easy to read and understand. In summary, the Bitly Links Analysis Dashboard offers a way to track past performance as a means of improving future outcomes.
Finally, marketing professionals can track total clicks by source with the use of a doughnut chart, and the choropleth map chart shows which countries produce the most activity. In conclusion, the Bitly Links Analysis Dashboard provides a way to track KPIs for all of your managed URLs.
Business professionals can use our filter option, which is located at the top of the marketing dashboard, to track activity by a specific time period. For example, we make it easy for leaders to hone in on their metrics by a specific day, month, or year. Check out this embedded demo for Bitly Links Analysis dashboard to learn how Bold BI’s solutions can help your team.
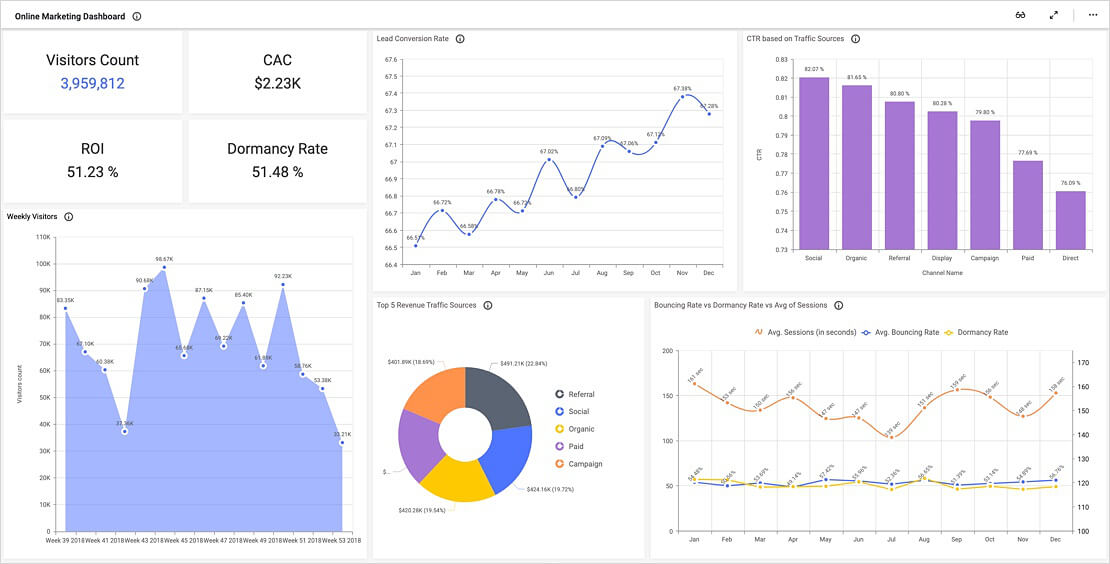
Bold BI’s online marketing dashboard allows the viewer to track various pieces of crucial enrollment and performance data…
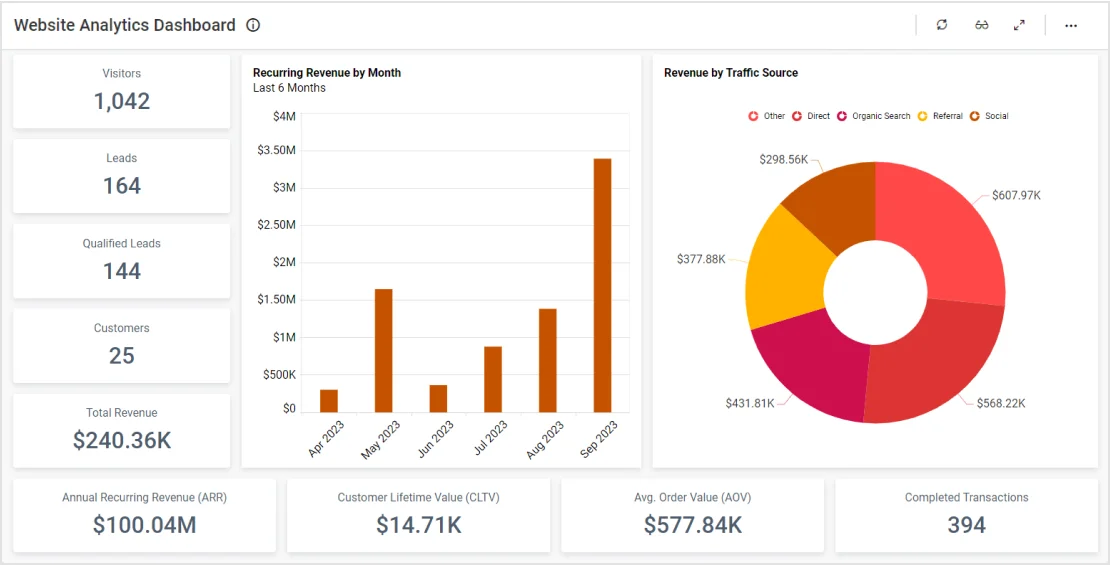
Learn More View DashboardThis website analytics dashboard provides a detailed snapshot of a company’s revenue-related website metrics.
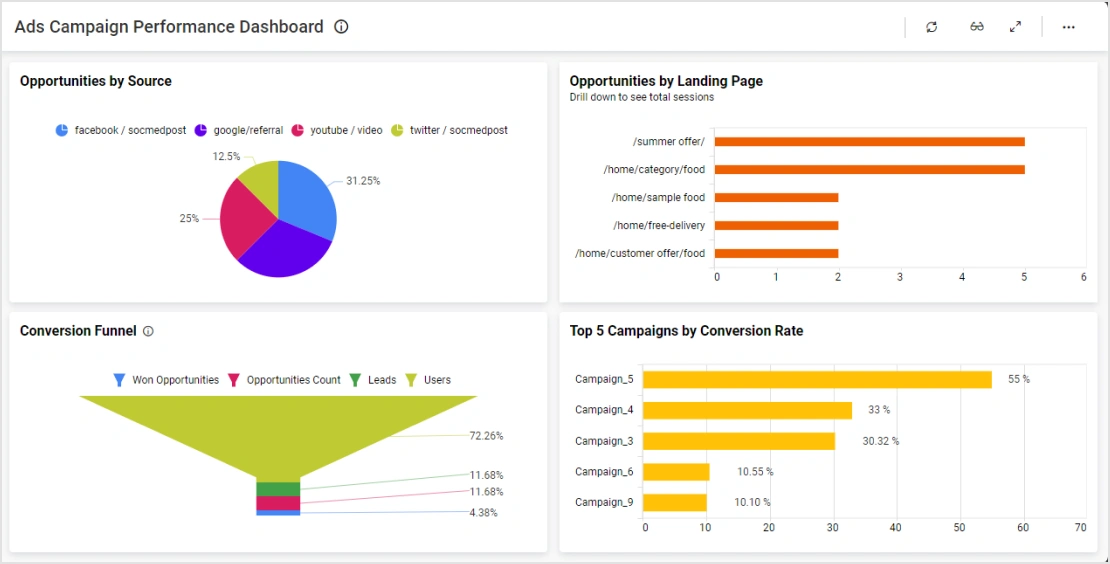
Learn More View DashboardThis marketing campaign performance dashboard provides a detailed snapshot of a company’s ad campaign metrics. With this dashboard…
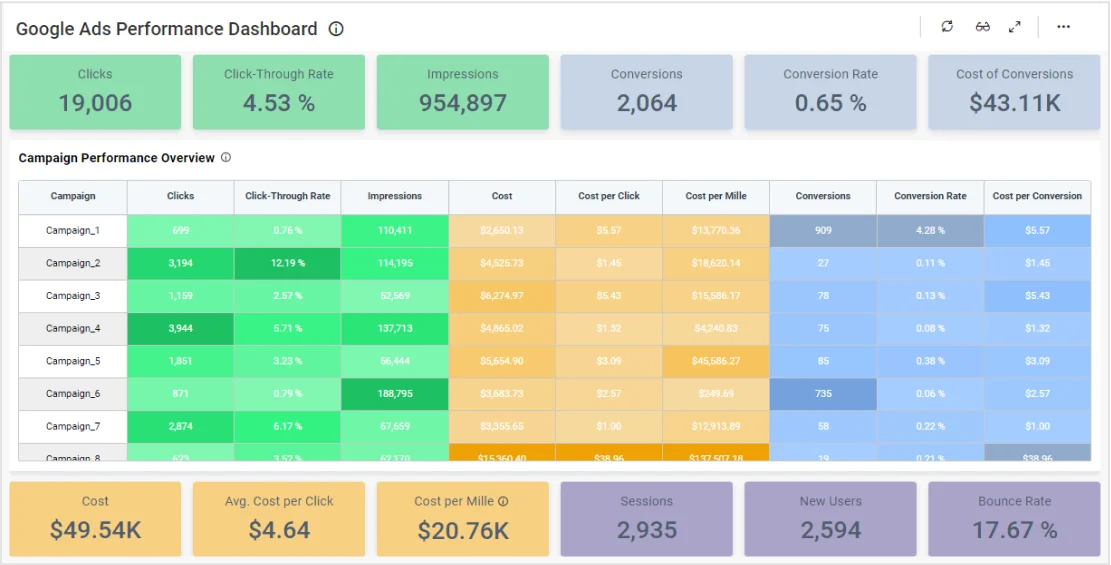
Learn More View DashboardThis ad campaign performance dashboard provides a detailed outline of a company’s ad performance metrics, revenue, and costs. With this dashboard…
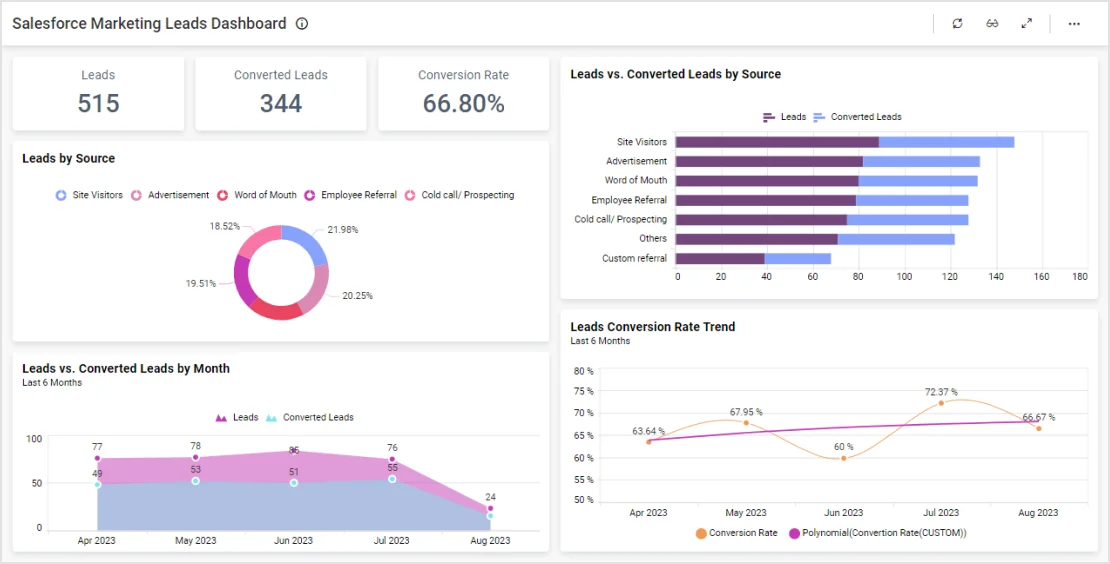
Learn More View DashboardThis Salesforce leads dashboard provides a detailed overview of several key metrics. With this dashboard…
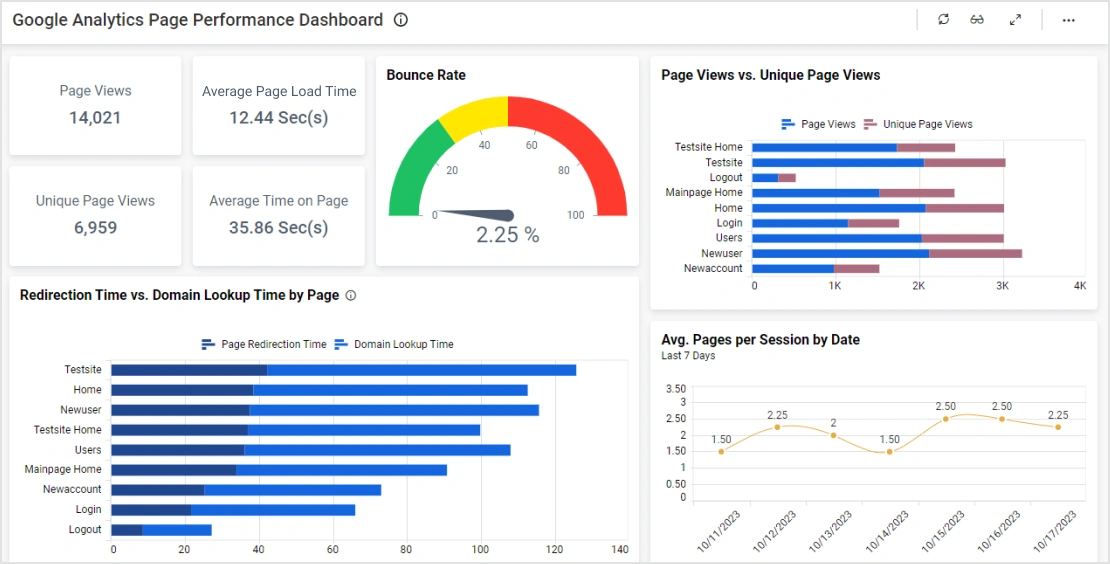
Learn More View DashboardThis Google analytics performance dashboard allows marketing teams to analyze web page performance.
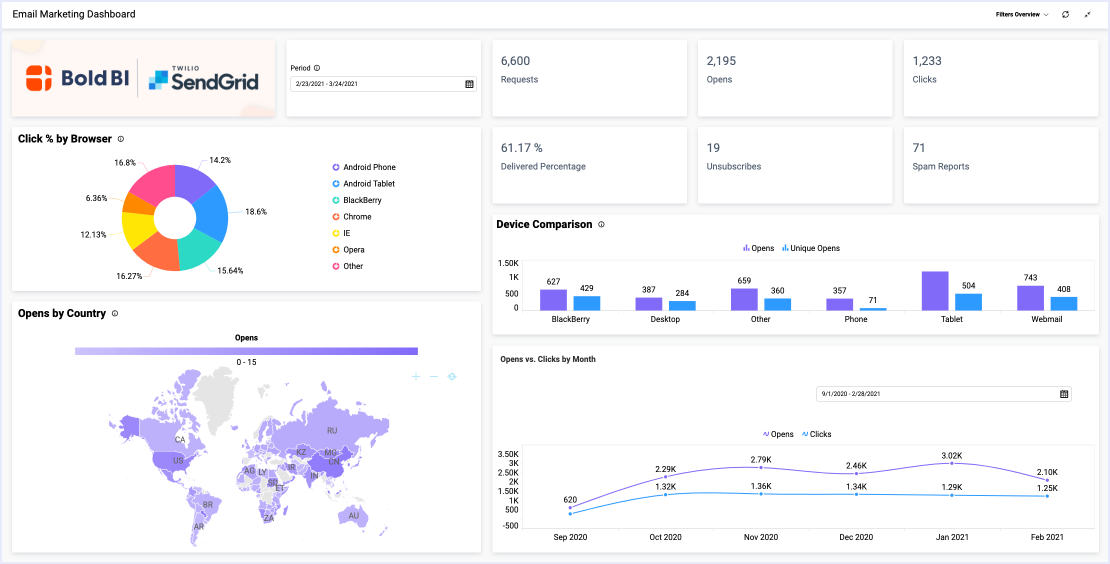
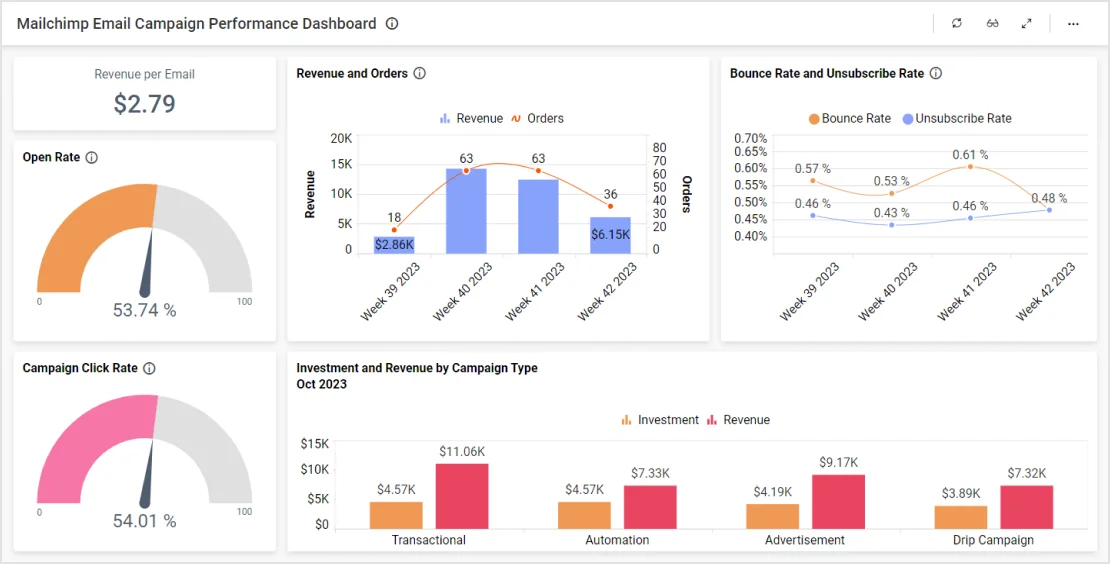
Learn More View DashboardThis email marketing dashboard provides a detailed overview of a company’s email metrics.
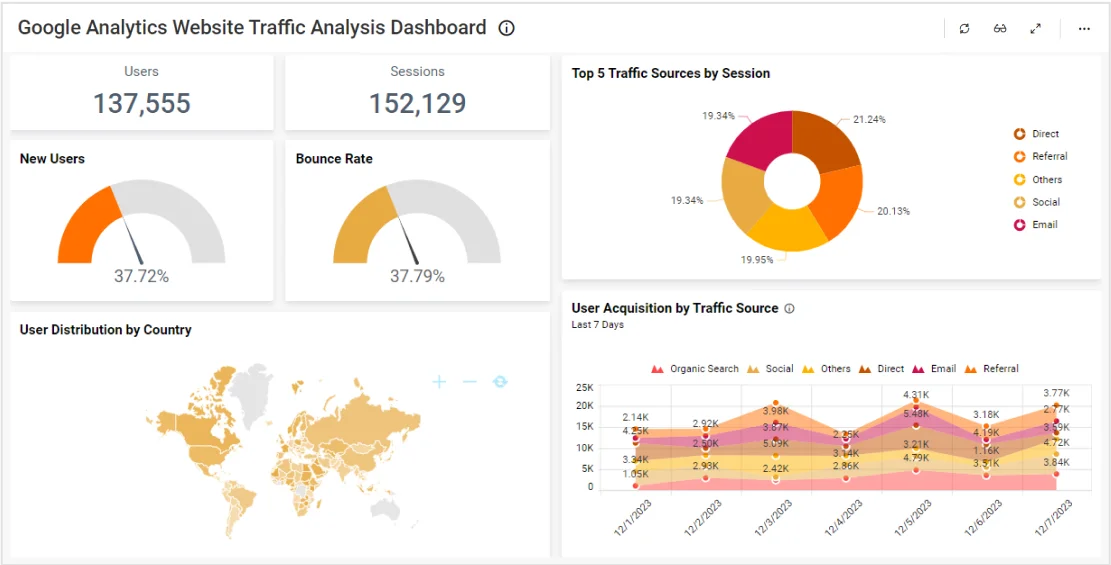
Learn More View DashboardThis website traffic dashboard provides a detailed snapshot of a company’s Google Analytics data.
Learn More View DashboardThis marketing campaign performance dashboard highlights a company’s key email metrics. With this dashboard…
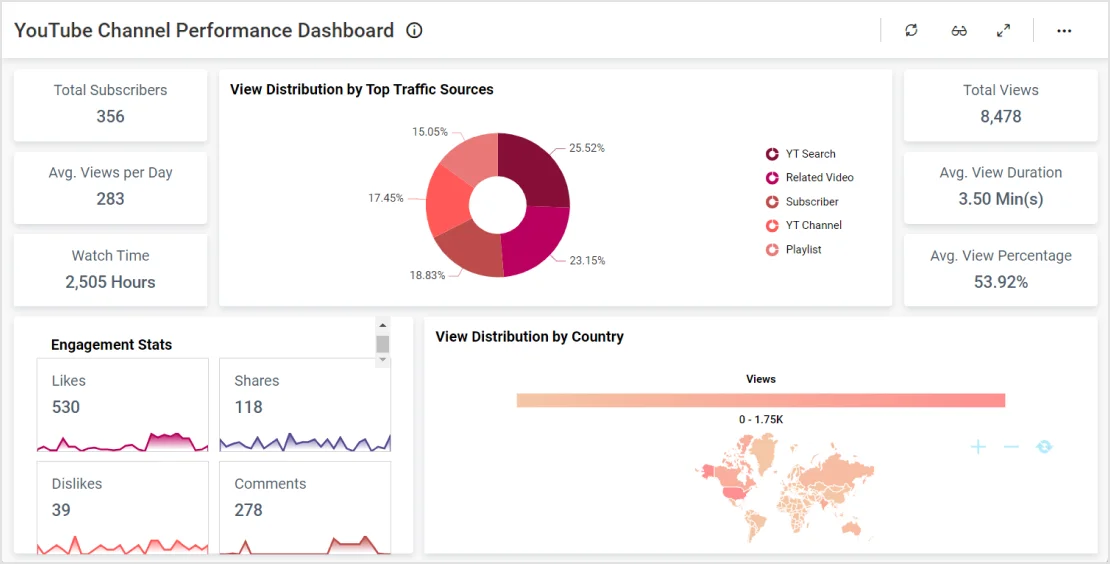
Learn More View DashboardThis marketing dashboard provides a detailed overview of a company’s YouTube viewer metrics. With this dashboard…
Learn More View DashboardTry out all the features of Bold BI® with 30-day free trial and get to know how it suit to your needs of embedded analytics.
Platform