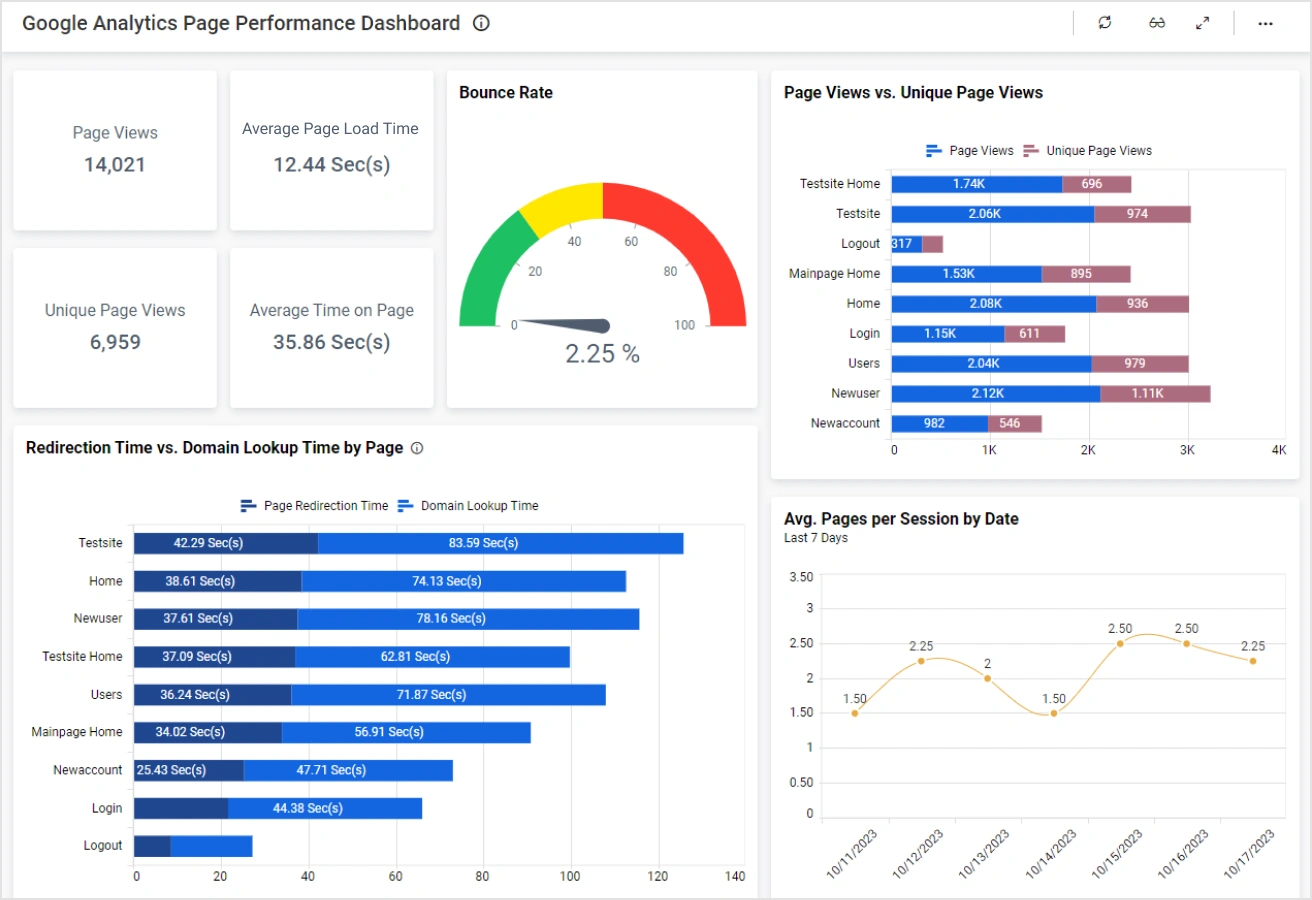
This Google analytics performance dashboard allows marketing teams to analyze web page performance. With this dashboard, viewers can answer the following questions:
Firstly, how many page views and unique page views do we have?
Secondly, how much time do people spend on our pages?
Thirdly, how many pages do customers visit per session?
Finally, what is our average page load time?
This dashboard can help marketing and sales teams assess customer interest in their products and online offerings. Firstly, the card widgets along the top row of the dashboard provide a quick and easy visual reference for assessing key web page metrics. With these cards, users can quickly see the number of page views and unique page views from website visitors. They can also review the average amount of time spent on a page and the average number of pages visited per session.
Further, the page views line chart displays the number of views for the past several days while the summary grid outlines the number of entrances, exits, and unique views per page.
The card widget at the top right corner of the dashboard displays the average page load time while the line chart shows the average page load time for the past week. Finally, the stacked line chart details the redirection and domain lookup times for the past several days.
This dashboard’s data is crucial as it can help leaders assess which pages are most appealing to potential customers. It can also help identify technical issues related to page load time.
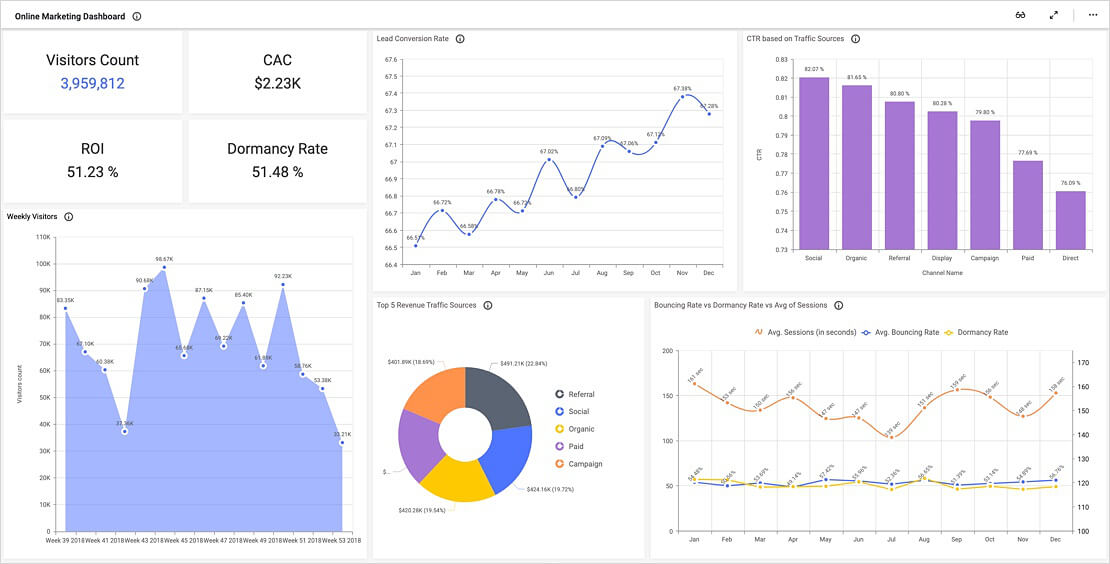
Bold BI’s online marketing dashboard allows the viewer to track various pieces of crucial enrollment and performance data…
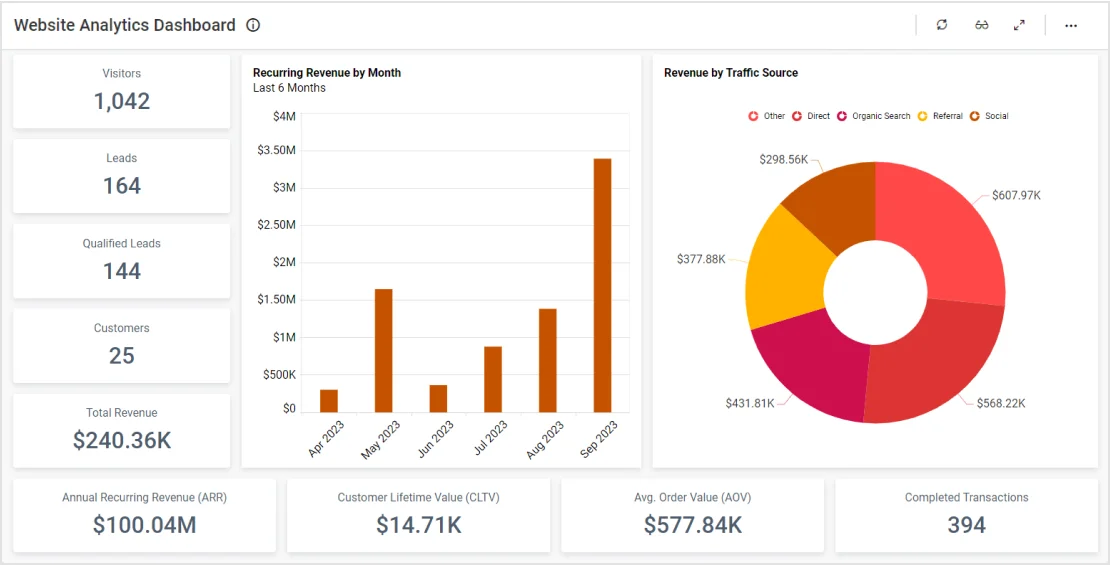
Learn More View DashboardThis website analytics dashboard provides a detailed snapshot of a company’s revenue-related website metrics.
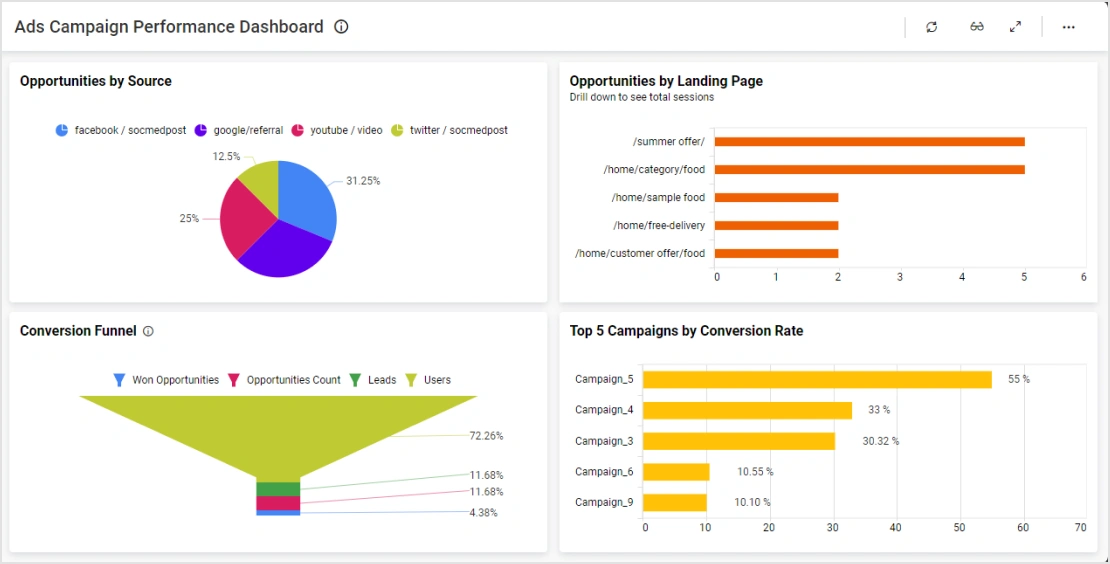
Learn More View DashboardThis marketing campaign performance dashboard provides a detailed snapshot of a company’s ad campaign metrics. With this dashboard…
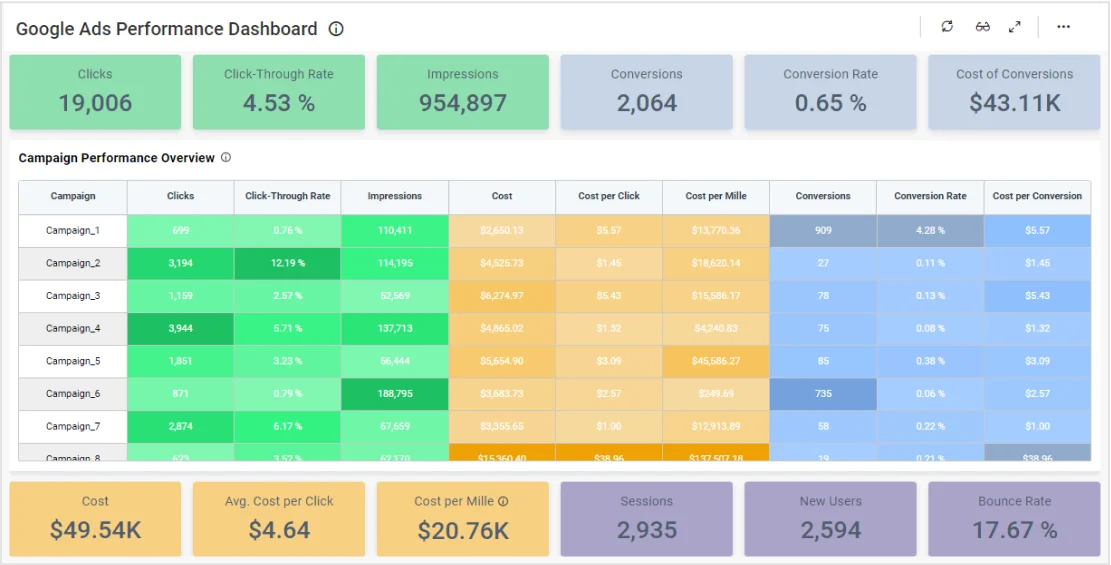
Learn More View DashboardThis ad campaign performance dashboard provides a detailed outline of a company’s ad performance metrics, revenue, and costs. With this dashboard…
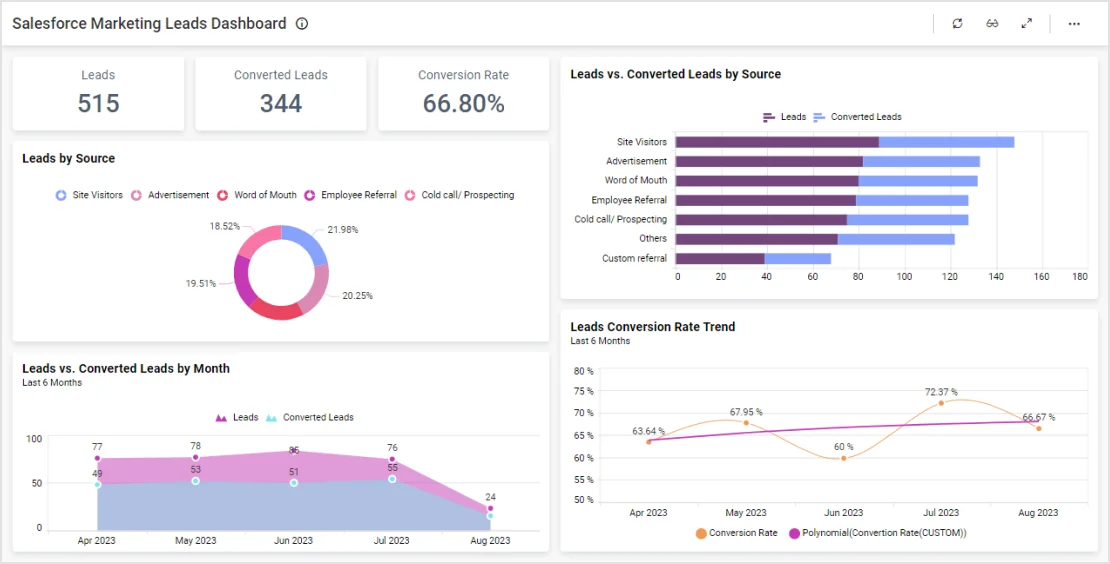
Learn More View DashboardThis Salesforce leads dashboard provides a detailed overview of several key metrics. With this dashboard…
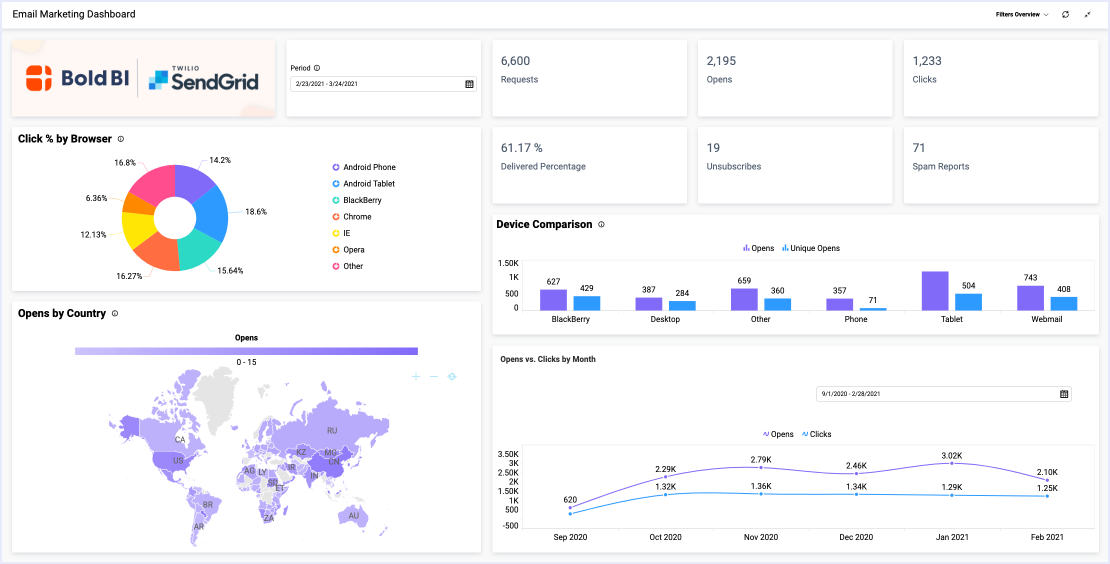
Learn More View DashboardThis email marketing dashboard provides a detailed overview of a company’s email metrics.
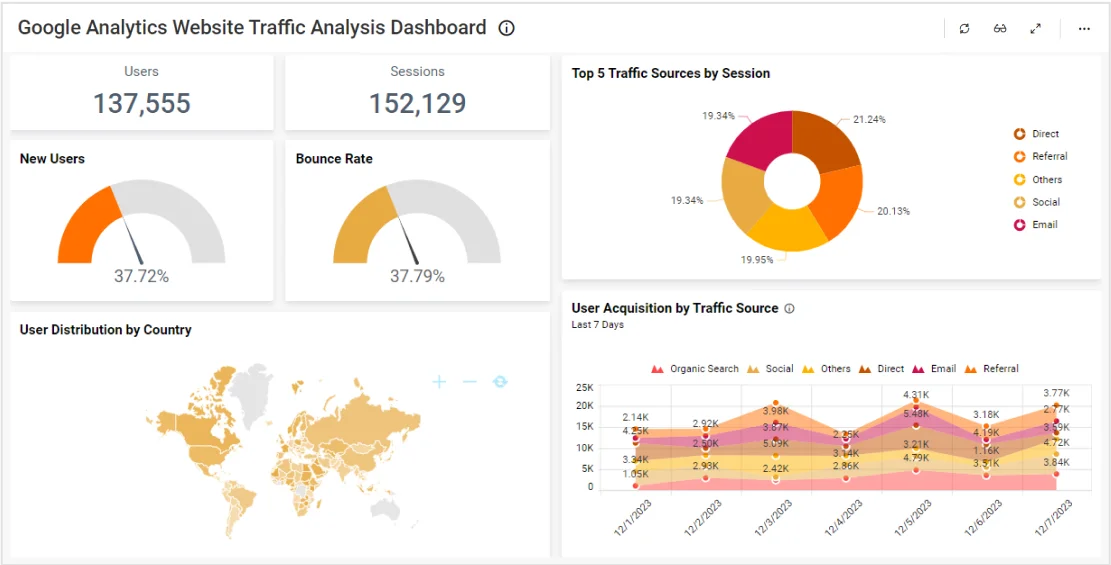
Learn More View DashboardThis website traffic dashboard provides a detailed snapshot of a company’s Google Analytics data.
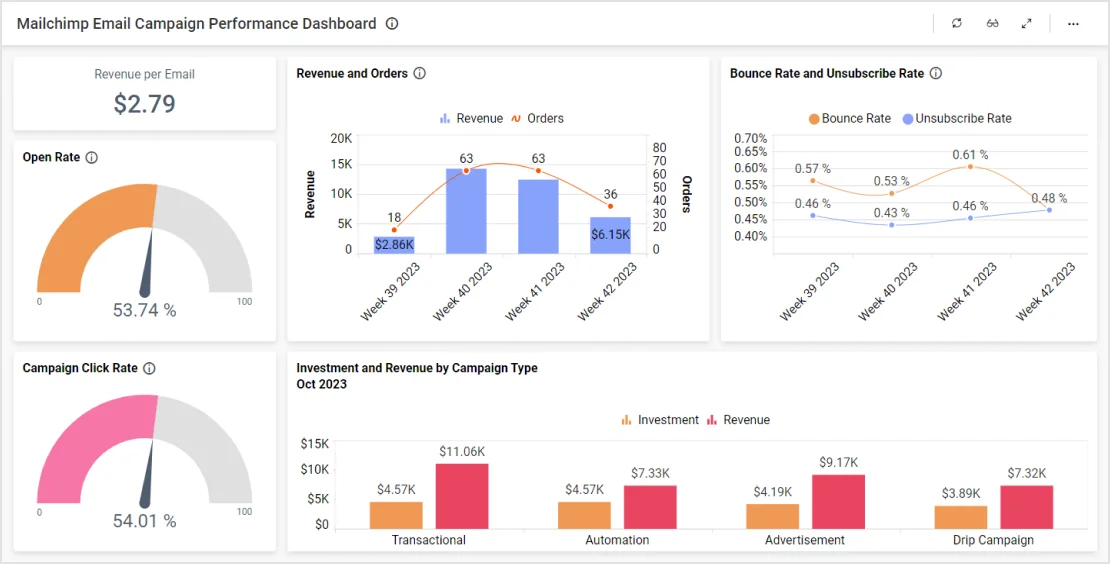
Learn More View DashboardThis marketing campaign performance dashboard highlights a company’s key email metrics. With this dashboard…
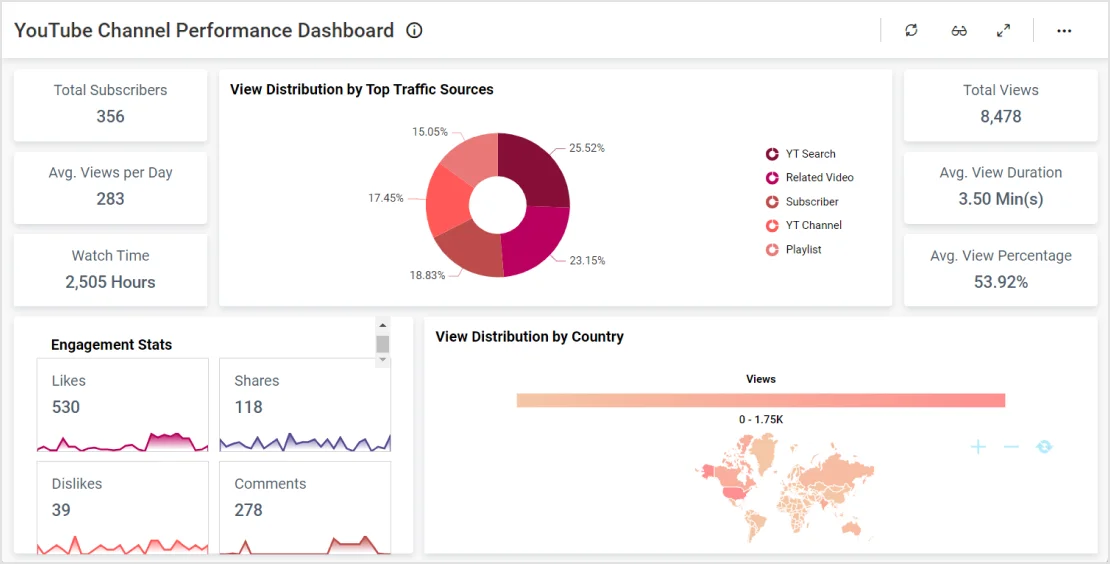
Learn More View DashboardThis marketing dashboard provides a detailed overview of a company’s YouTube viewer metrics. With this dashboard…
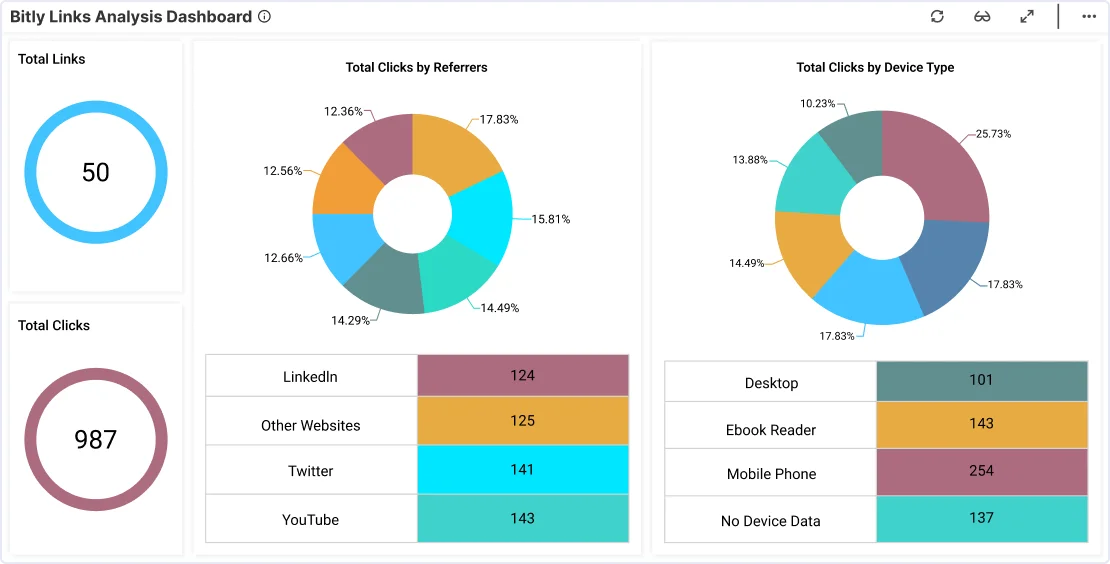
Learn More View DashboardThis marketing dashboard provides a detailed overview of a company’s Bitly metrics. With this dashboard…
Learn More View DashboardTry out all the features of Bold BI® with 30-day free trial and get to know how it suit to your needs of embedded analytics.
Platform