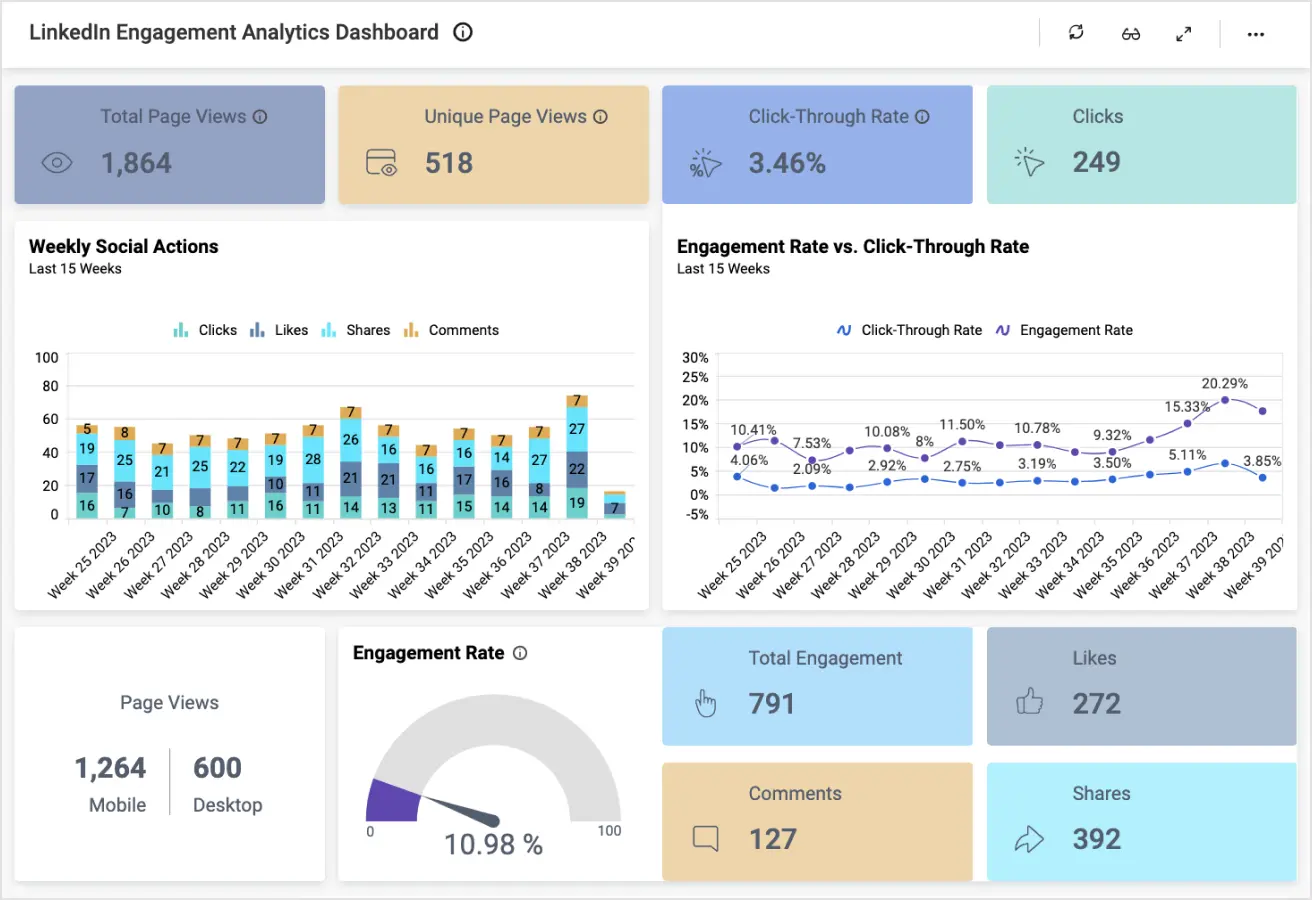
This LinkedIn Engagement Analytics Dashboard provides deeper understanding of visitor interactions with a company’s LinkedIn page. With this dashboard, we can answer the following questions:
How many total page views and unique page views does our LinkedIn page have?
How does our engagement rate compare to our click-through rate?
How do our impressions compare with our unique impressions over time?
What industries and jobs do our followers come from?
The LinkedIn Engagement Analytics Dashboard provides instant insight into how effective your company’s LinkedIn page is at capturing visitors’ attention. It clearly and plainly displays a collection of essential KPIs and metrics for measuring page immersion, from page views to follower demographics.
The initial set of information cards show page administrators the numbers most important to them immediately. Admins can instantly know total page views, unique page views, click-through rate, and clicks, and compare them to established benchmarks or goals.
For more details about social interactions, i.e. clicks, likes, shares, and comments, users can consult the Weekly Social Actions stacked column chart. This chart shows the weekly number of each type of interaction over the previous 15 weeks, and the height of each column shows the total number of interactions. Users can easily see which weeks produced the most activity, and after identifying them, see the breakdown of what kind of action was responsible for the most activity. This lets marketing and content teams design material with specific purposes, whether they just want to drive up clicks or aim for virality with more shares. This chart also indicates the trend of social activity over time, reflecting the LinkedIn engagement rate.
The Engagement Rate vs. Click-Through Rate spline chart similarly measures LinkedIn page interactions over a 15-week period. It lets page admins observe the correlation between these two measures, while also indicating when content resonated with followers. Another spline chart comparing weekly impressions and unique impressions for the previous 15 weeks provides another way to identify what content may have been most interesting to LinkedIn users. Both of these charts also provide an easy way to comprehend the trends of these figures over time.
The Page Views card in the LinkedIn dashboard compares what types of devices users are visiting your page from, whether mobile or desktop. This information guides content creators and marketing teams to employ formatting for content that makes the most of device-specific constraints.
Equally important to understanding LinkedIn page activity is knowing the demographics of the page’s followers. A trio of doughnut charts break down followers by their seniority level at their place of employment, by their industry, and by their job function. From such information, page admins can work with their marketing teams to publish content that targets specific subsets of followers.
For example, the seniority data indicates whether more tutorial-based content should be provided to capture the attention of more entry-level workers, or whether overview information on product pricing or features should be showcased for senior-level workers. The chart evaluating followers by industry can be used to guide content decisions, whether the company wants to maximize its reach in industries where it is already popular, or if it wants to focus on outreach to industries with few followers. Categorizing followers by job role drills-down on the industry-based demographics, showing in fine detail what sorts of roles find the content on the LinkedIn page worthwhile.
This significant collection of LinkedIn analytics visualized across a variety of widgets and cards allows those running a LinkedIn page to know when their content drives higher engagement and who their content should target in the pursuit of establishing a larger LinkedIn footprint and acquiring more customers.
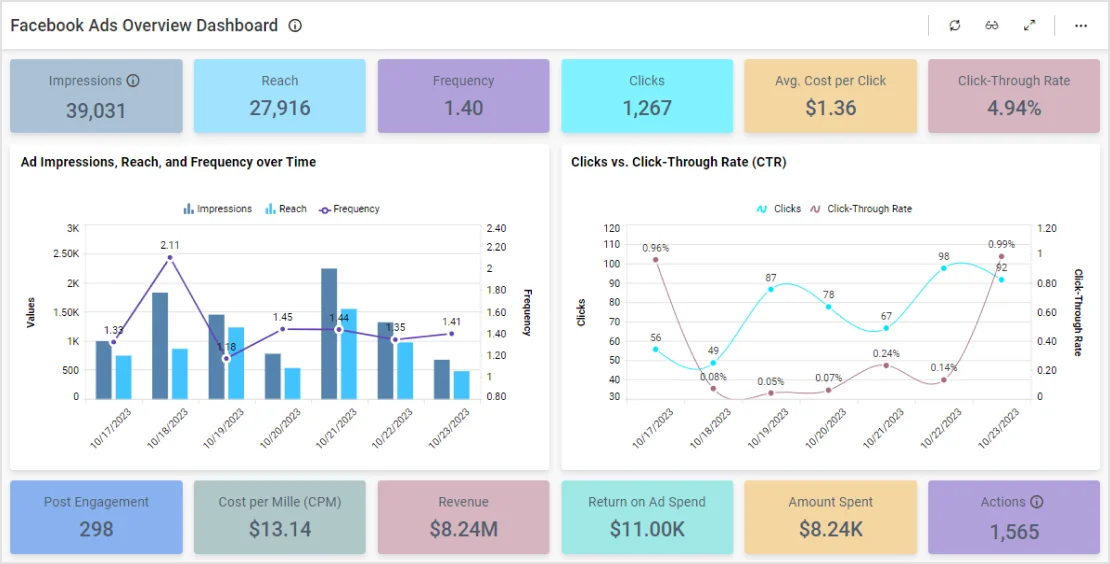
This Facebook Ads Dashboard provides deeper understanding of visitor interactions with a company’s Facebook page. With this dashboard...
Learn More View DashboardTry out all the features of Bold BI® with 30-day free trial and get to know how it suit to your needs of embedded analytics.
Platform