If you work in supply chain management, your team depends on you to reduce costs, increase transparency, and speed up production cycles. For example, you need to monitor key inventory metrics, and you might use blockchain to increase traceability. However, you also need to track financial KPIs such as days sales outstanding, days payable outstanding, and freight cost per unit. This data helps you perform your job more efficiently. Further, it ensures a positive experience for your customers.
Whether you need to analyze cash to cycle time or track on-time delivery rates, Bold BI® can help you meet your supply chain management goals. To get started, check out our dashboard examples. Then, request a demo for a complete walkthrough of Bold BI.
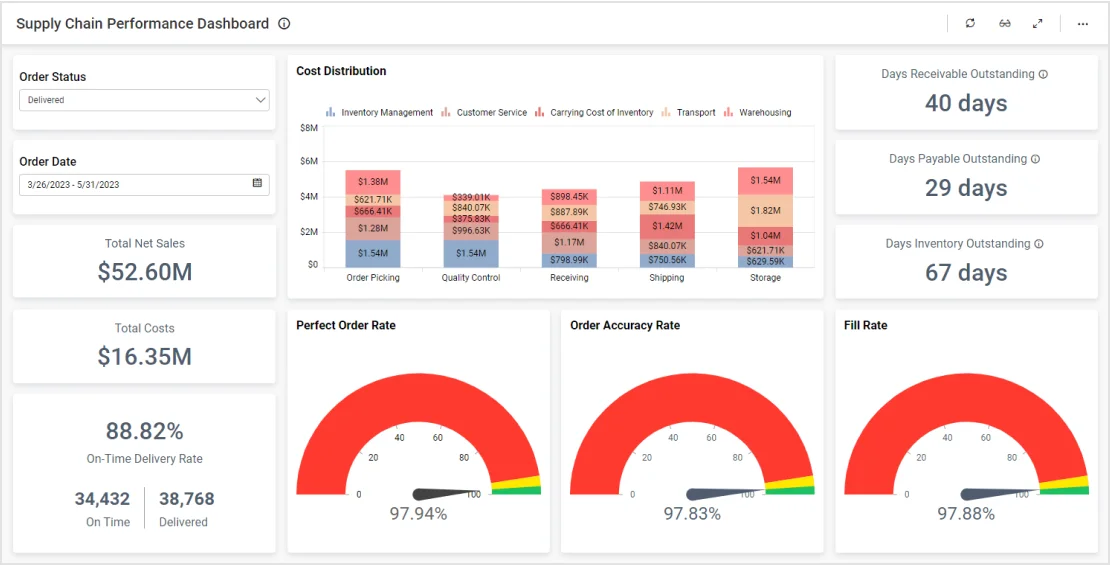
This dashboard provides an overview of a company’s key order metrics. With this dashboard, viewers can answer…..
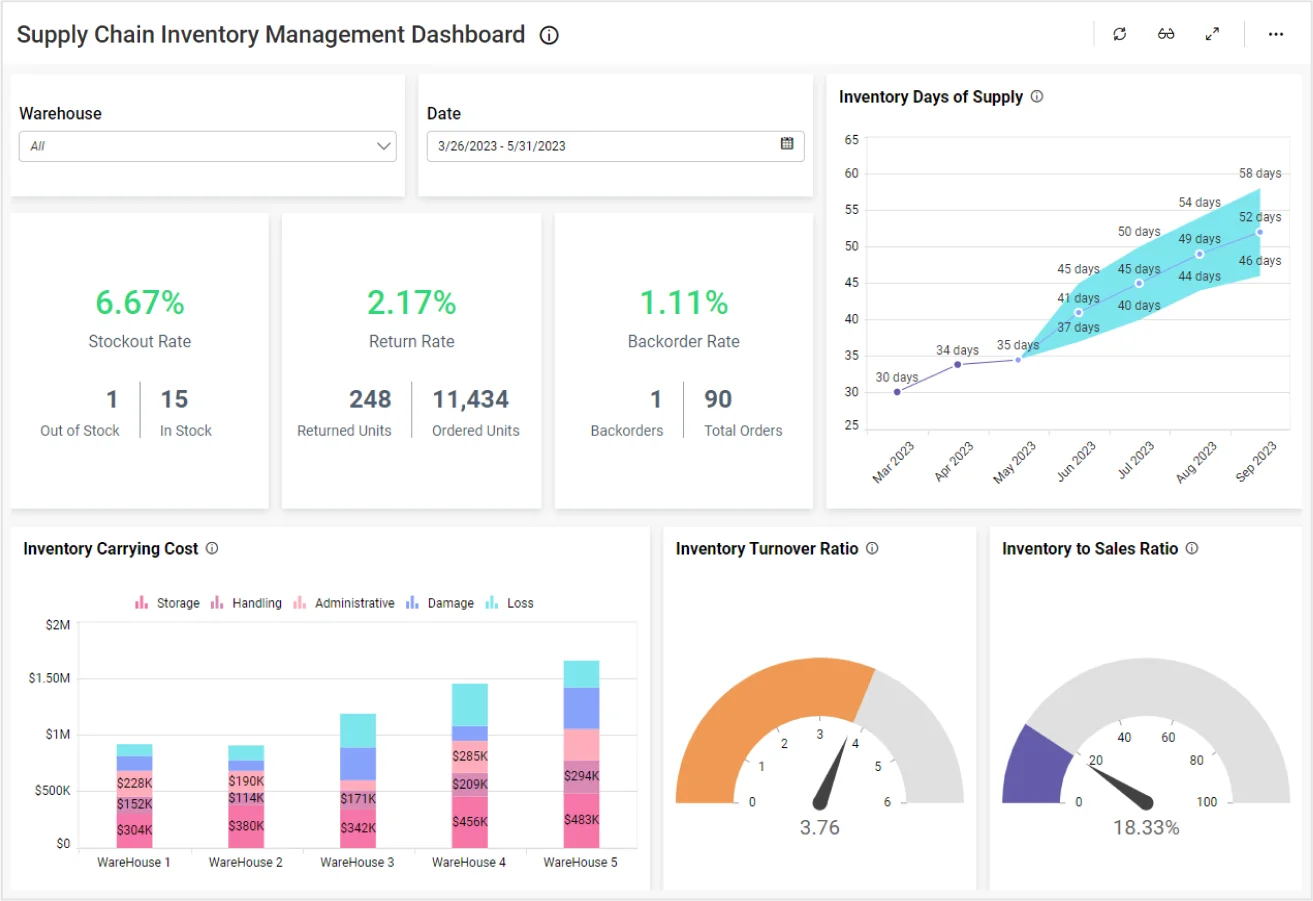
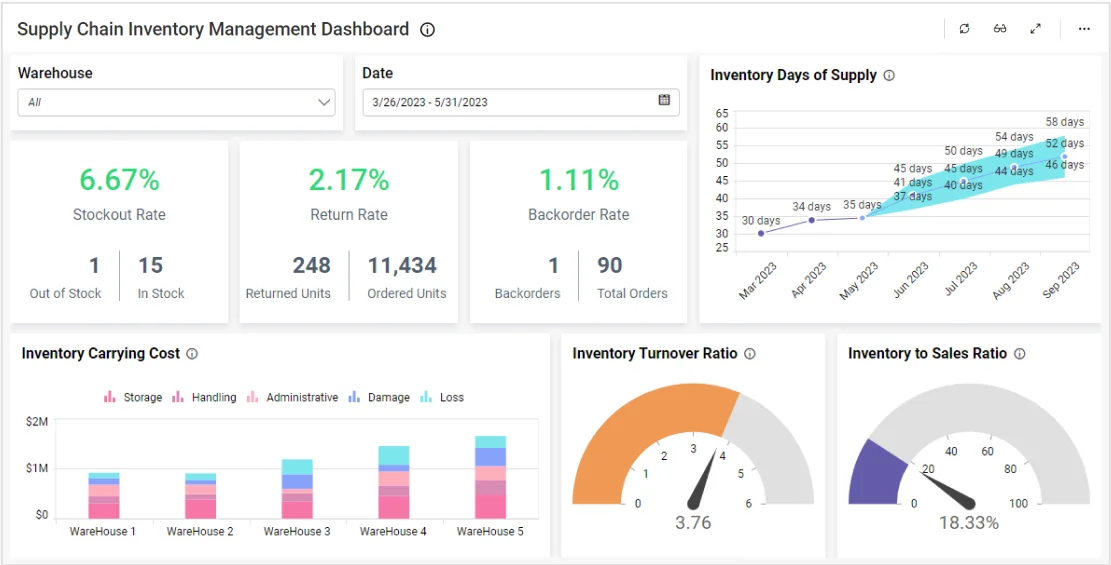
Learn More View DashboardThis inventory management dashboard displays key metrics such as inventory days of supply, back order rate, and more. With this dashboard, viewers can answer……
Learn More View DashboardWith Bold BI’s user-friendly, fully customizable dashboards, you can track all the key performance indicators that supply chain professionals depend on:
Cash to cycle time
Perfect order rate
Customer order cycle time
Inventory days of supply
Inventory turnover
Freight cost per unit
Try out all the features of Bold BI® with 30-day free trial and get to know how it suit to your needs of embedded analytics.
Platform