


Improving the team performance of a call center is difficult without meaningful metrics. So, it is important to choose the right metrics from the available data to find out what is going on. In this blog, we’ll show you some of the best metrics for evaluating a support team’s performance in a call center.
Call Center KPIs
Let us discuss about some call center KPIs to keep track to measure support team and agent performance.
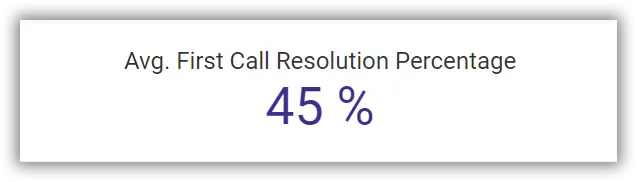
Solution on first call
Fixing a customer issue on the very first call not only saves time, but also leaves a good impression of your organization on customers. If the issue can’t be addressed on the first call, then it’s better to call the customer back than force them to call again. This also avoids the extra burden on the customer of explaining the problem every time they get a different agent on the phone. So, it is always better to have the percentage of solutions on the first call metrics be higher. It can be calculated using the total number of received calls and number of queries resolved on first call.
Wait time
Wait time is the time that the customer has to wait on the phone call before their call is answered by an agent. When customers call a call center, it means they are facing a problem that needs to be fixed immediately. So, no one likes to wait. Keeping this metric as low as possible is a good idea.
Average wait time = total wait time/total calls received.

Time spent on a call
There is also a metric used to identify the average time spent by an agent on a call. If this metric is low, it means more customer queries can be addressed. If it is high, then the agent needs more coaching to resolve customer issues.

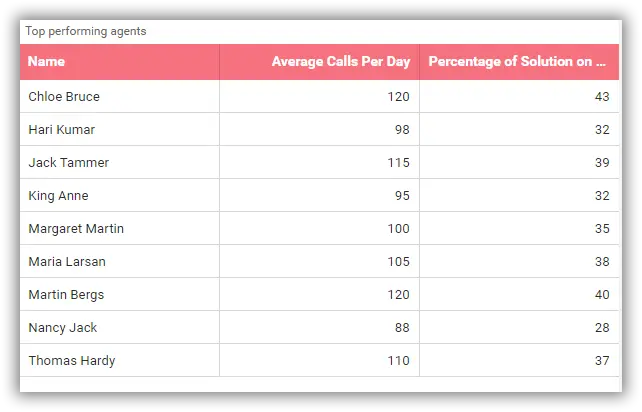
Top-performing agents
Identifying the top-performing agents and showing appreciation will encourage employees in their work. Top-performing agents can be identified using metrics like average calls per day and percentage of solutions on first call.
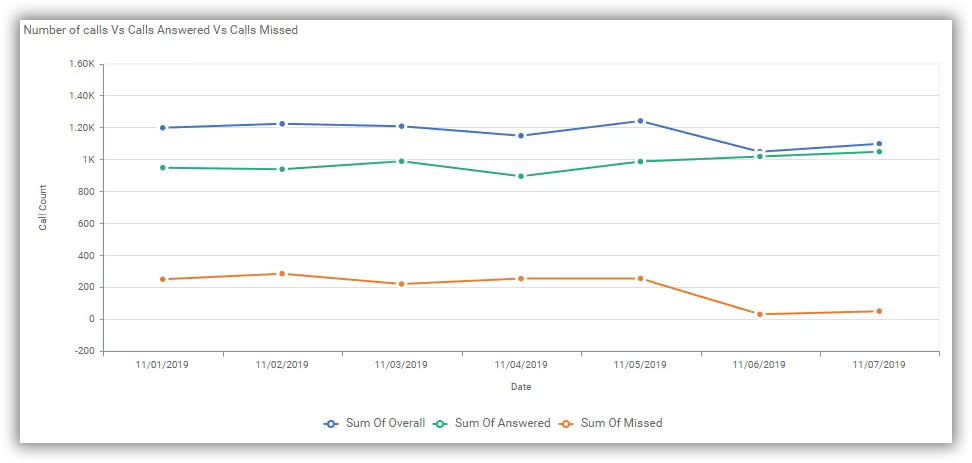
Number of calls vs. calls answered vs. calls missed
Comparing the total number of calls received with the total number of calls answered and total number of calls missed per day (or in any time interval), will show you how well the agents are utilized. If the number of calls missed is high, the problem should be identified and rectified soon, since it may force customers to switch to a competitor.
Possible reasons for high missed calls:
- Shortage of resources, i.e. the number of agents to handle calls is not enough.
- Agents may spend too much time on calls for resolving customer issues.

Overall call details
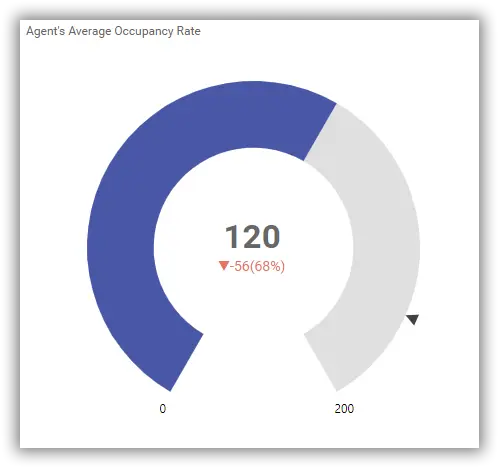
Occupancy rate
Occupancy rate is the total time an agent is engaged on a call versus the total time they’re logged in.
This defines the pace of work of the agents or how well the agents are engaged on calls. In order to provide the best service to customers, the occupancy rate of agents is important.
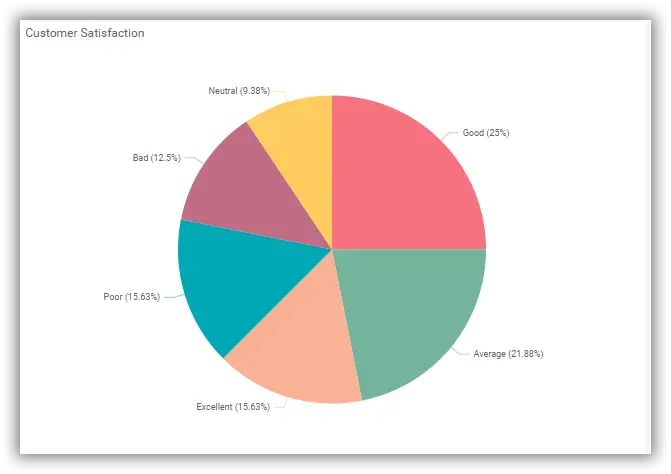
Customer satisfaction
Customer satisfaction is directly proportional to a call agent’s performance. If customers are not satisfied, there is a huge chance of losing them.
Measure customer satisfaction using a survey after calls. Customer feedback can be classified as: –
- Excellent
- Good
- Average
- Neutral
- Poor
- Bad
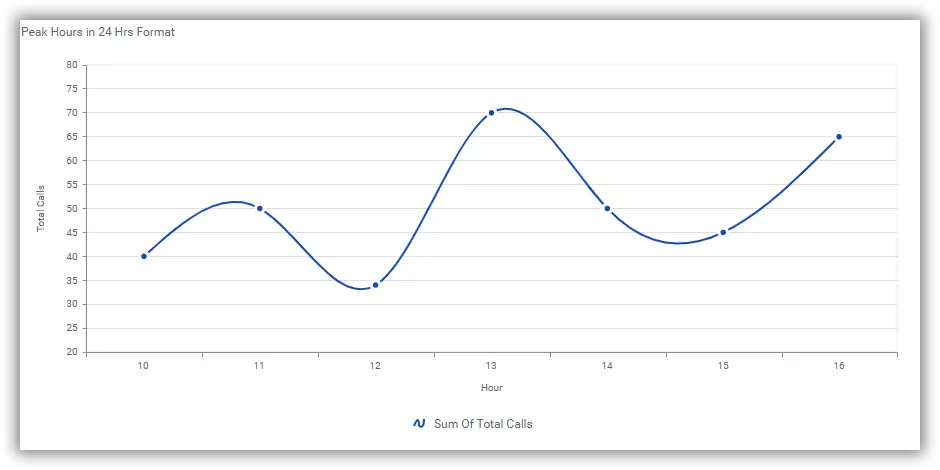
Peak time
It is essential to monitor when the incoming traffic is high. That way, you can plan the staffing needs and handle the peak time effectively.
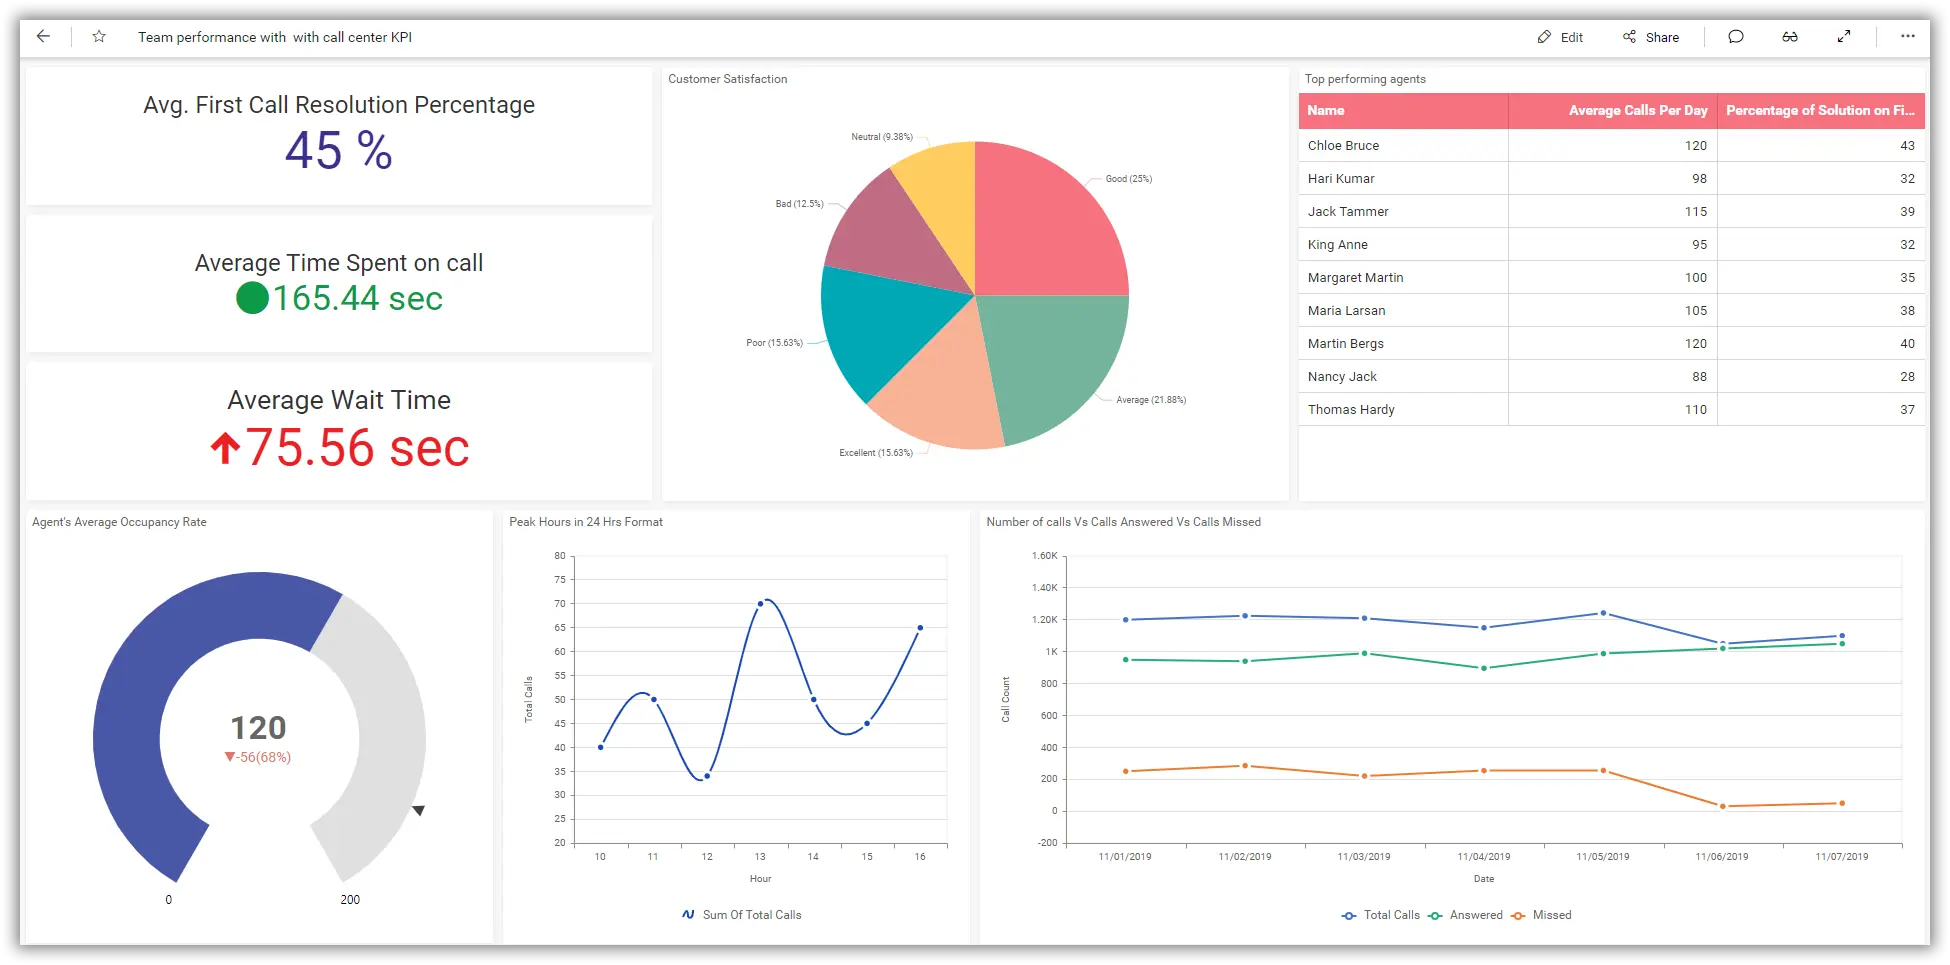
Check out our guide to create a dashboard like the following one from scratch with these call center KPIs.
Conclusion
We hope this article gives you some idea of how to create a dashboard showcasing call center KPIs to estimate a team’s performance. If you have any questions on this blog, please feel free to post them in the following comment section. Get started with Bold BI by signing up for a free trial and create more interactive business intelligence dashboards. You can also contact us by submitting your questions through the Bold BI website or, if you already have an account, you can log in to submit your support question.


