


Introduction
X (formerly Twitter) is a social networking service that lets users post messages known as tweets and interact with them, an activity known as engagement. This service can act as a social medium to improve the reach of your business. With X (formerly Twitter) activity data, you can measure your business’s reach and brand awareness based on tweet impressions, engagements, likes, replies, and retweets, and then use these metrics to grow your business. Visualizing such X (formerly Twitter) analytics data through a dashboard saves people in your organization time by streamlining the processes of collecting data and then transforming it into structured tables based on needed metrics, refreshing the data periodically, and repeating these steps on a daily basis. In this blog, we’ll see how to bring analytics data from X (formerly Twitter) through the CData Connect Cloud connector and then create a live, interactive dashboard using Bold BI® to visualize the data. CData Connect Cloud allows you to create a virtual database for all supported connectors and make it available as a standard SQL interface. Refer to this blog post for more details about CData Connect Cloud connector integration with Bold BI.Creating a virtual database for a X (formerly Twitter) data source in CData Connect Cloud
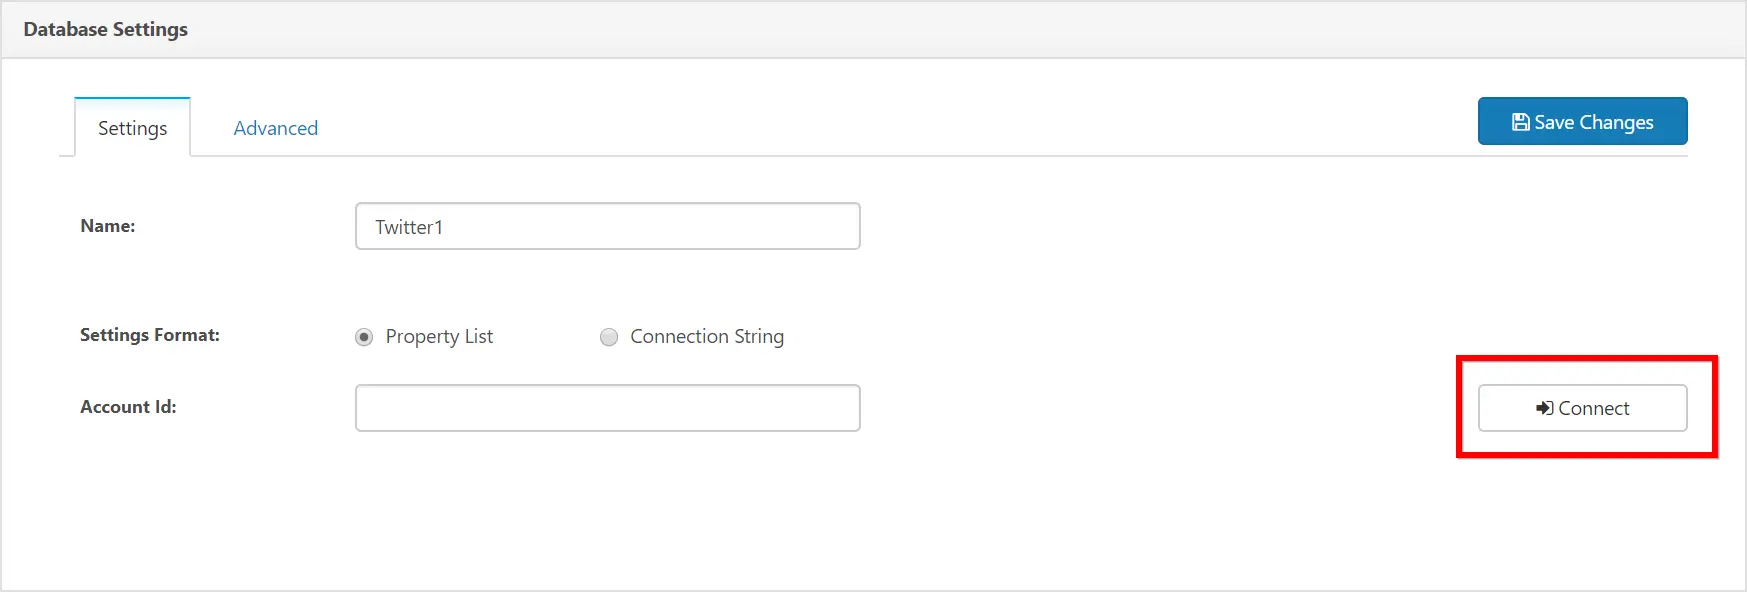
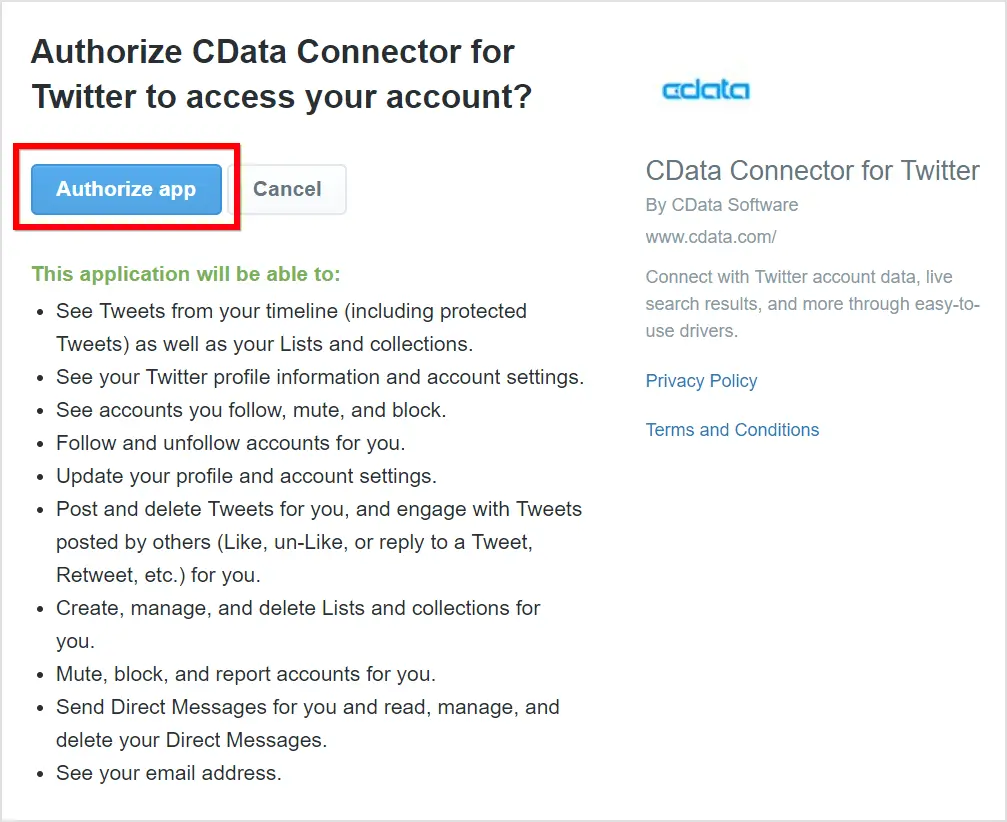
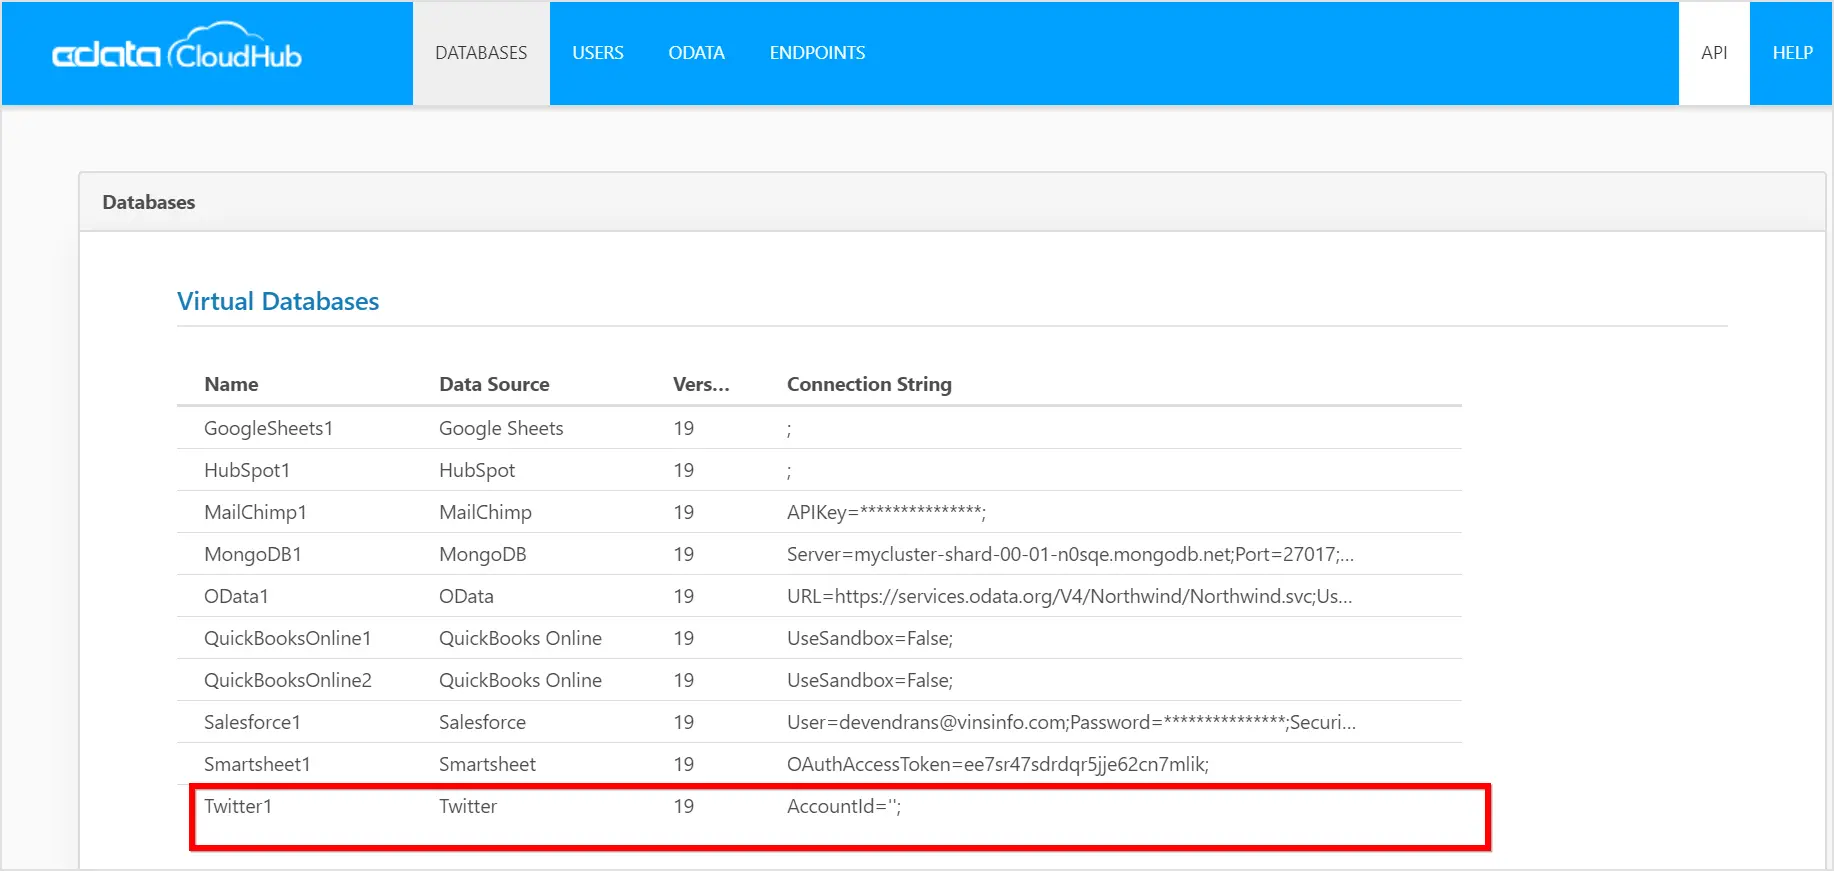
In your CData Connect Cloud, click the X (formerly Twitter) data source and create a virtual database by logging in to your X (formerly Twitter) account.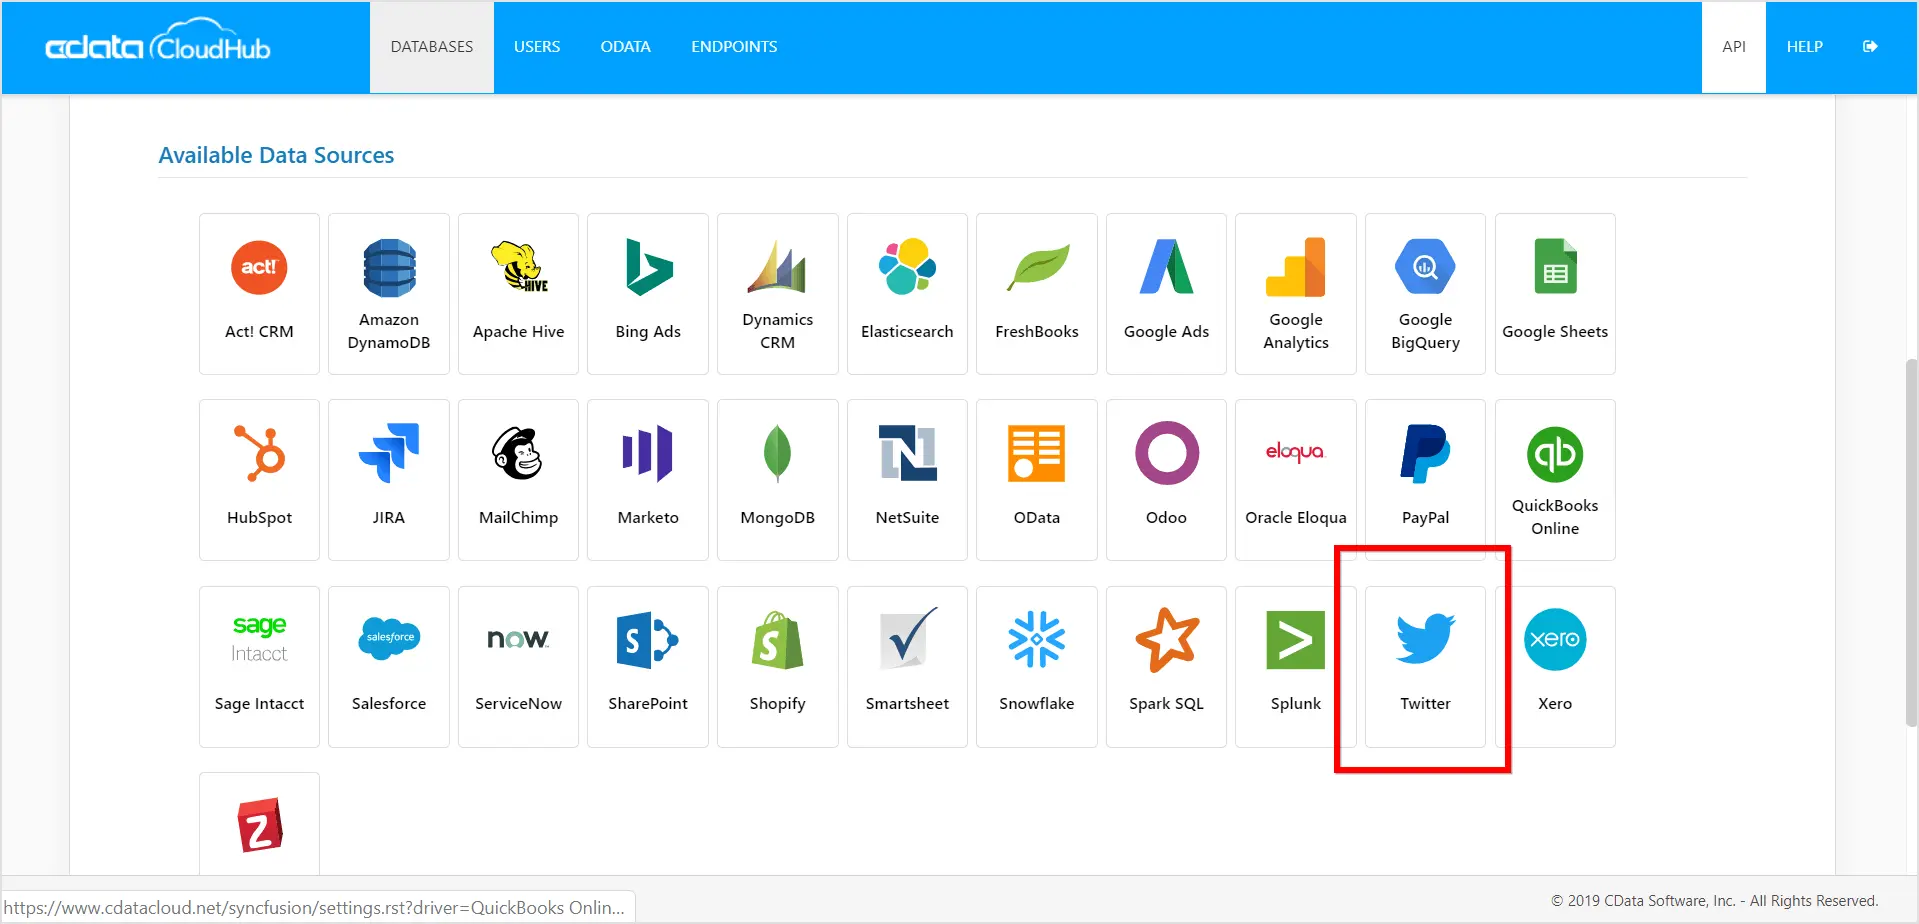
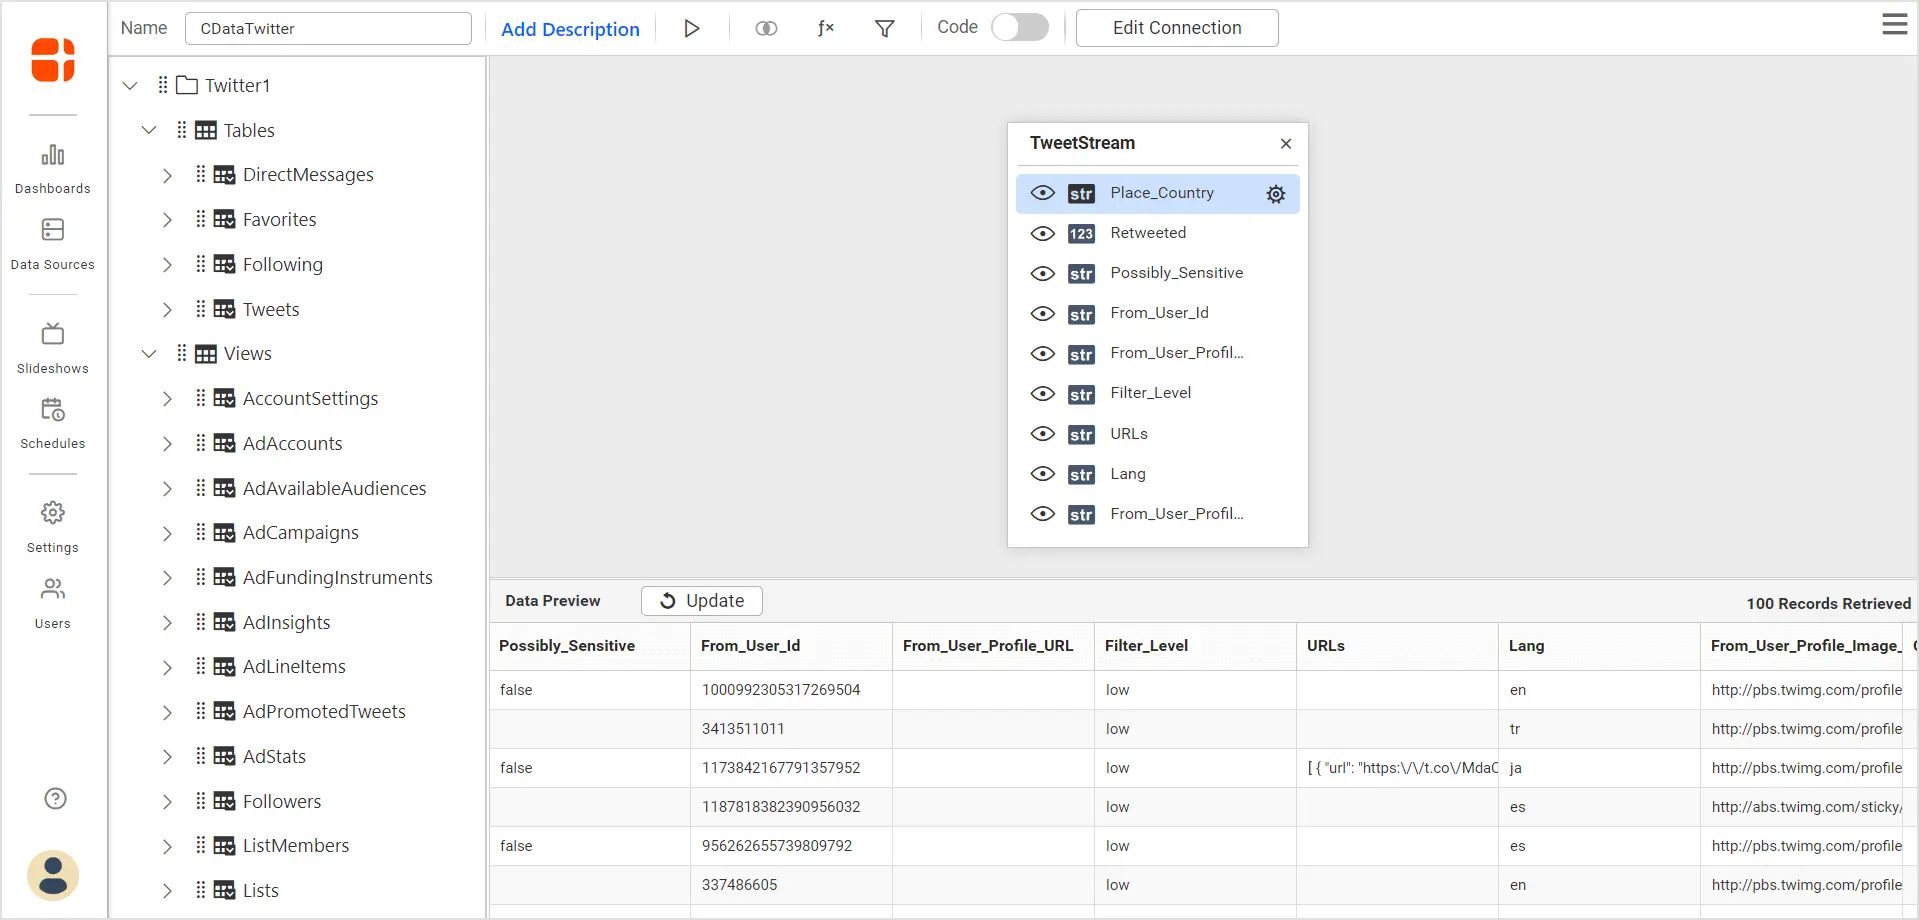
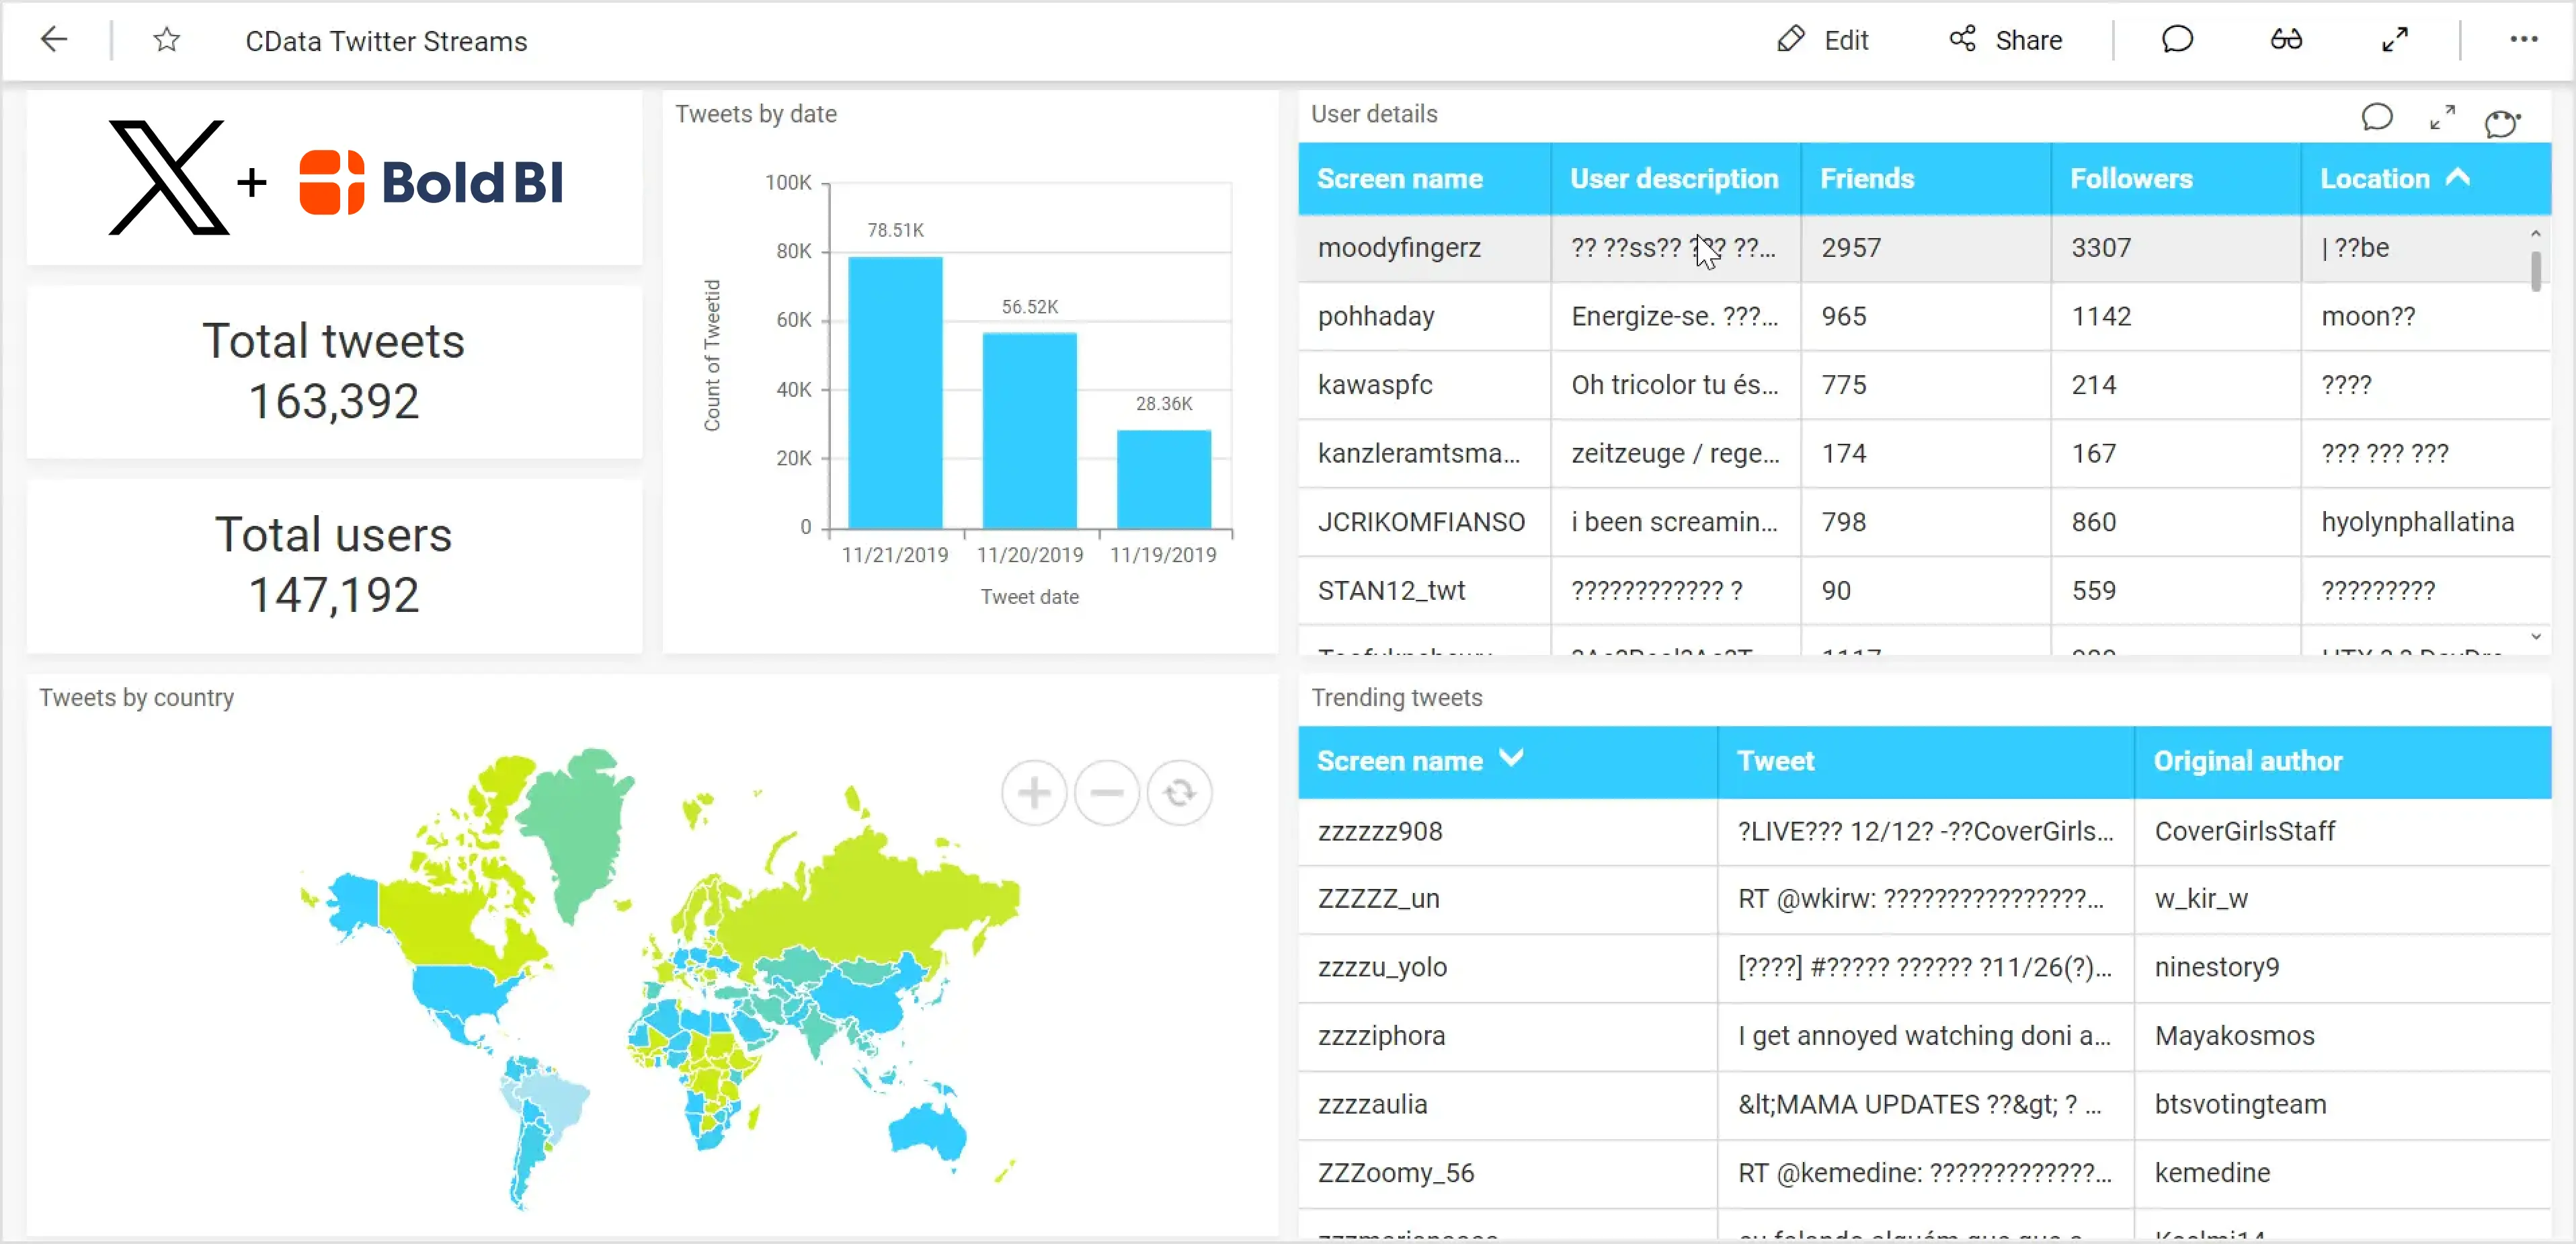
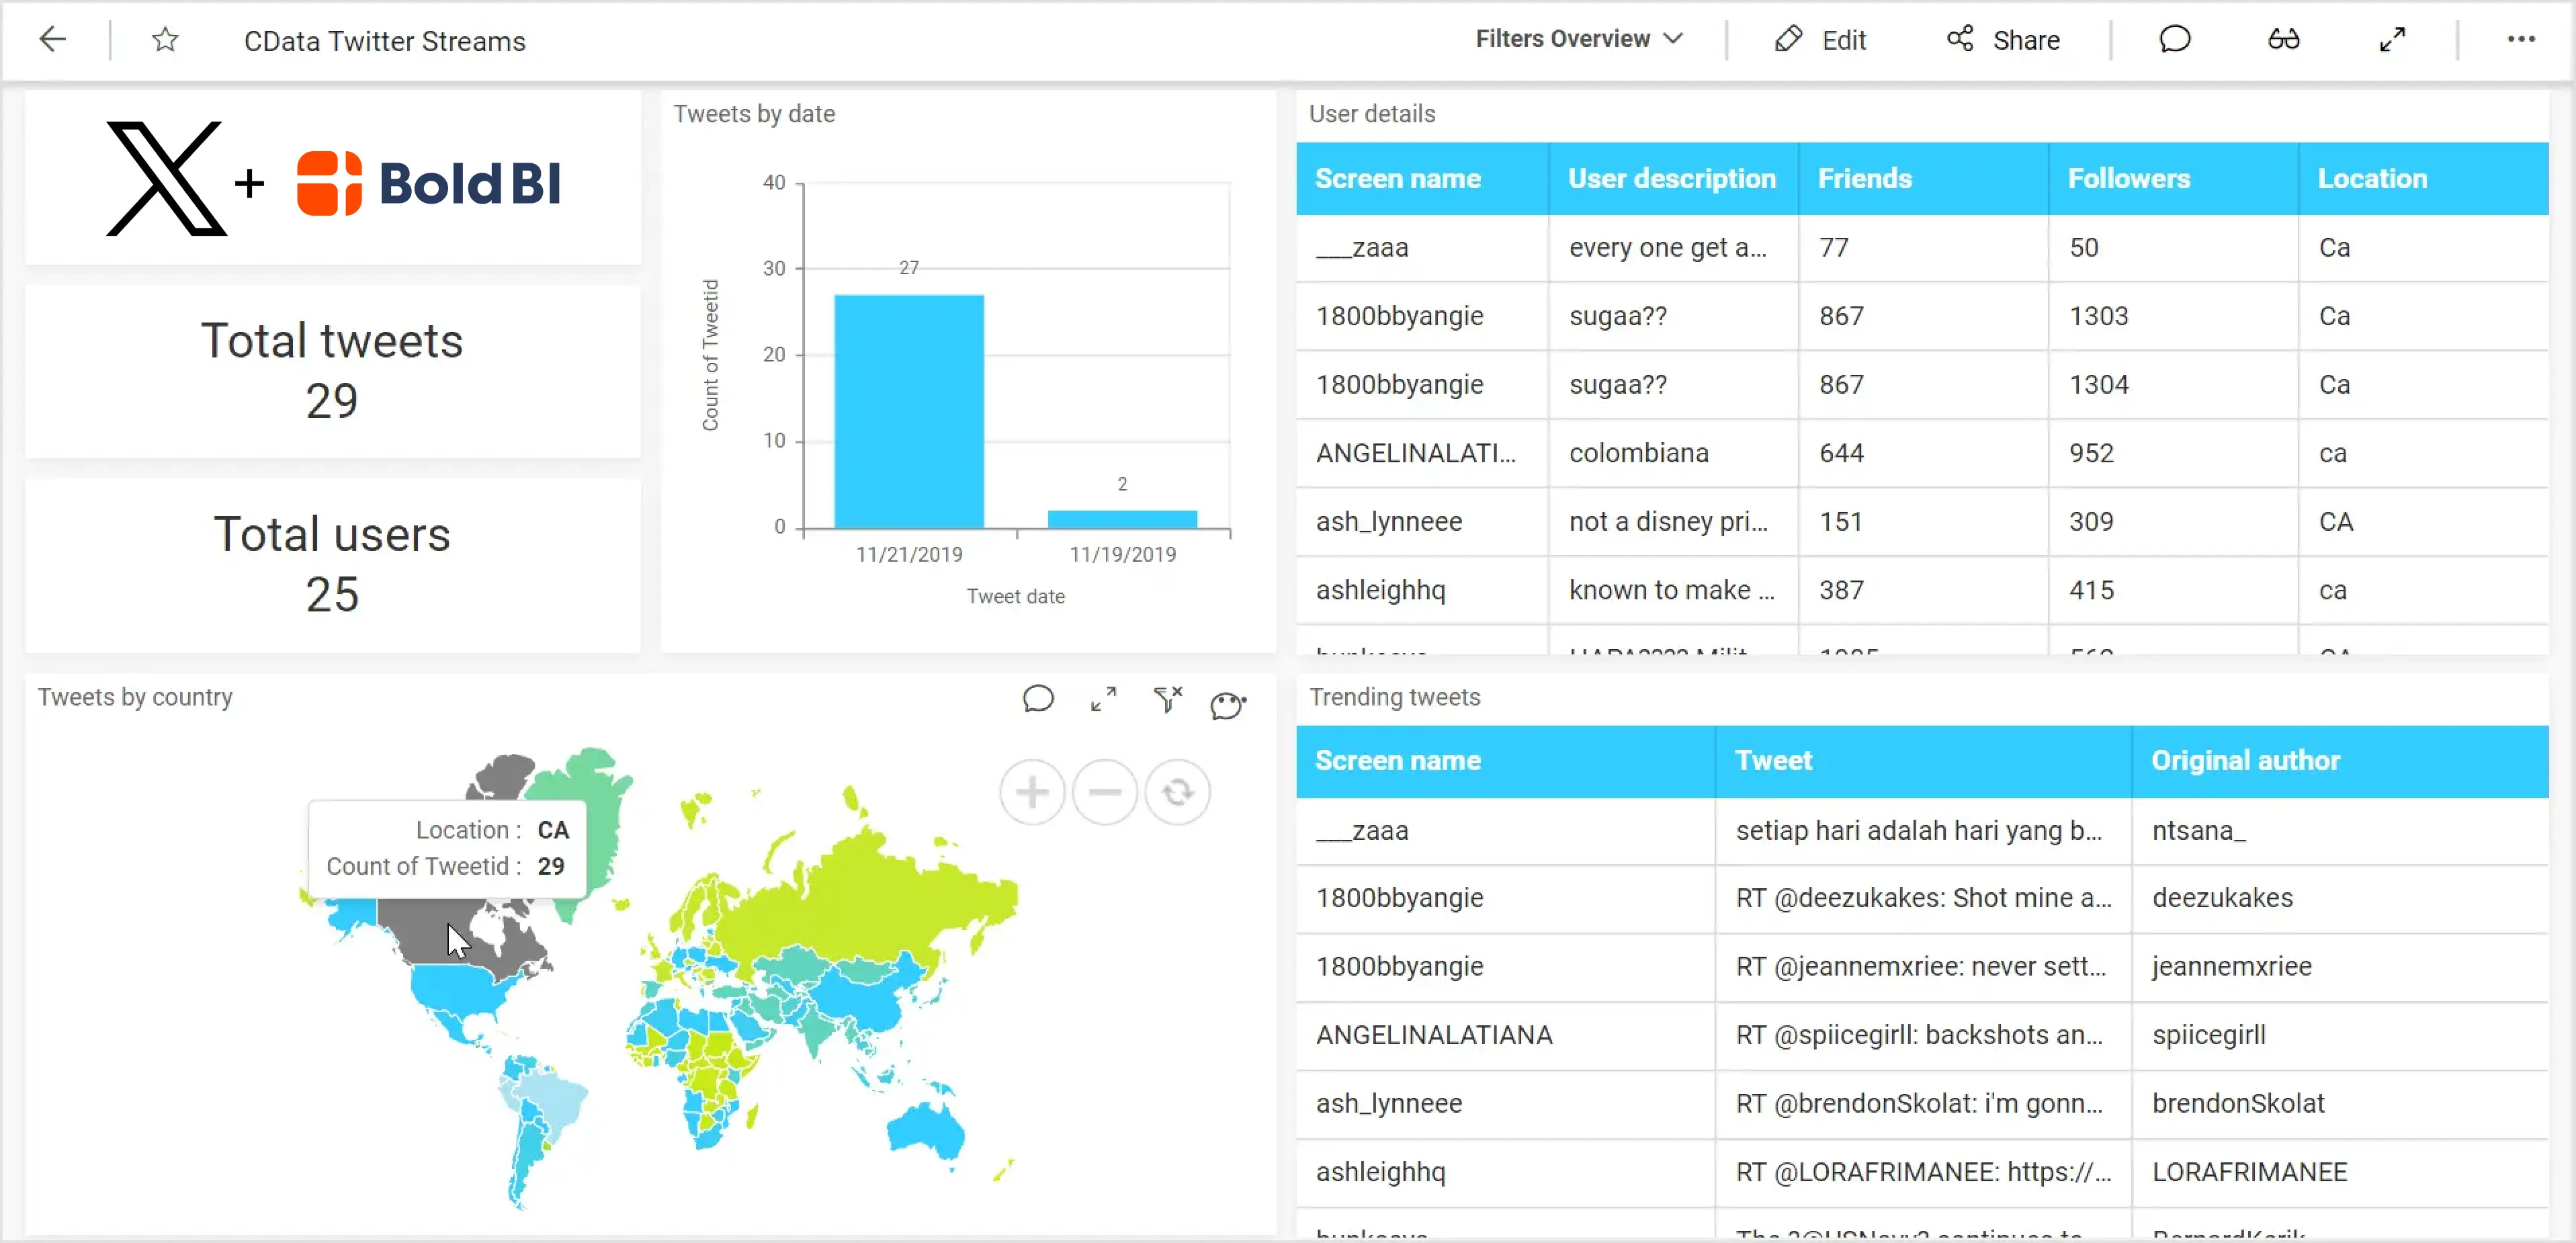
Creating a X (formerly Twitter) analytics dashboard
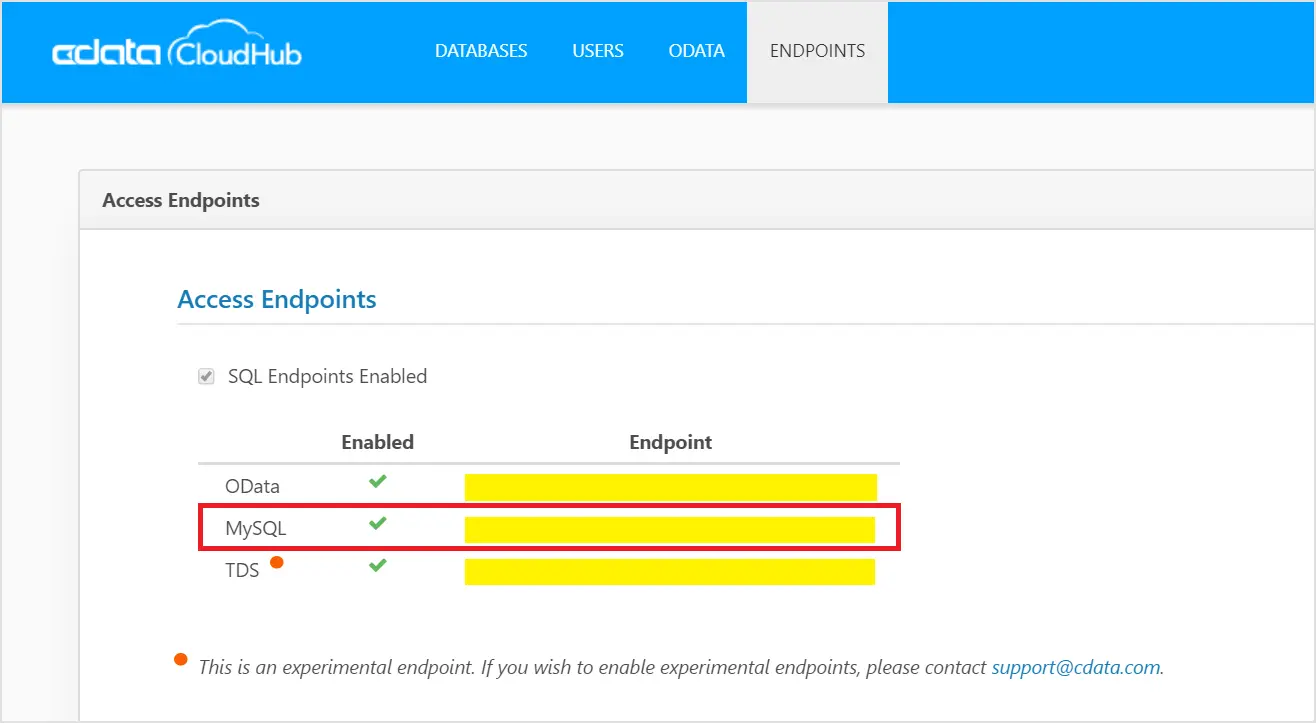
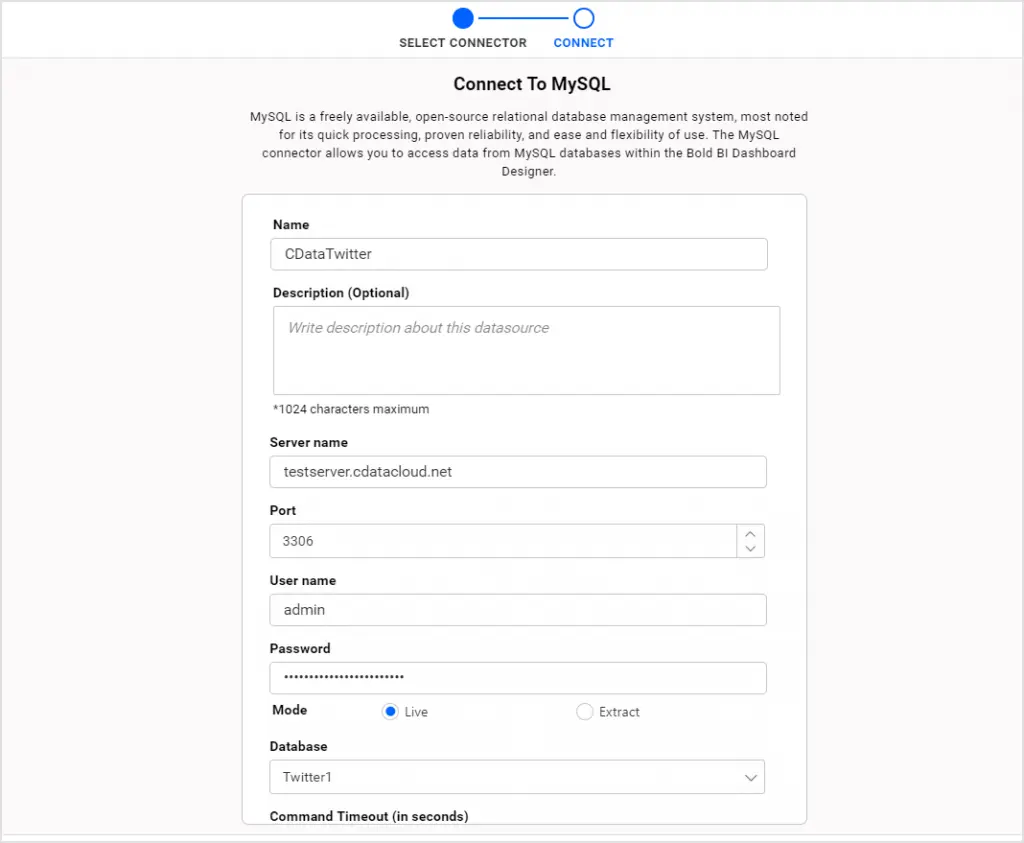
To create dashboard, first connect to the Bold BI MySQL data source using the MySQL endpoint in CData Connect Cloud. It fetches the data from the database server by executing the query every time, and the dashboard shows the latest metrics in real time for live connections.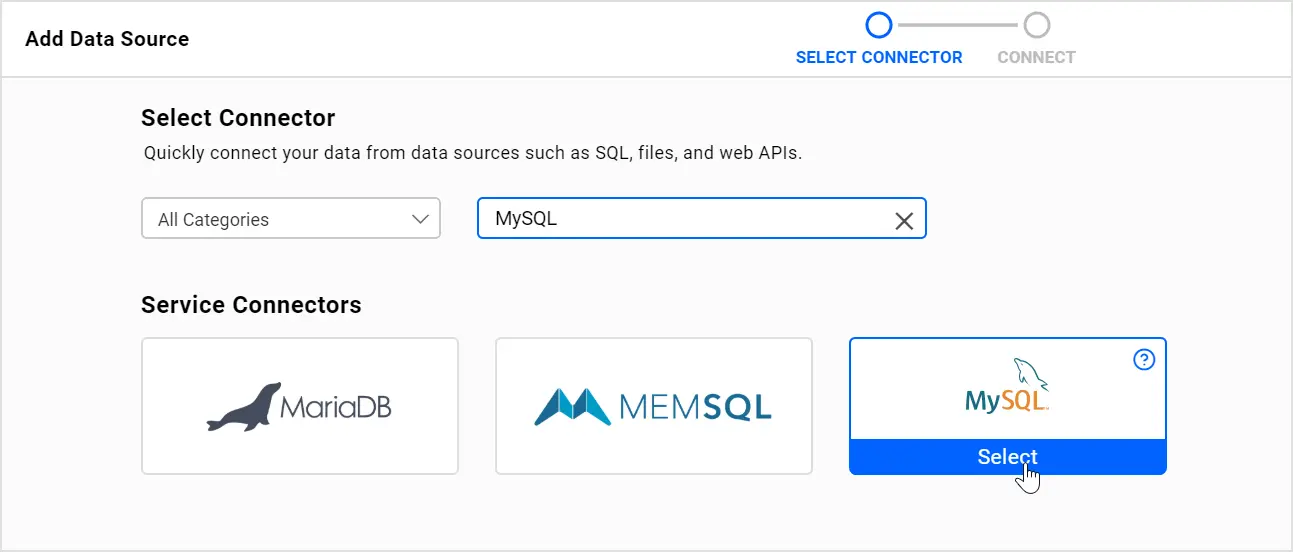
If you have any questions on this blog, please feel free to post them in the following comment section. Get started with Bold BI® by signing up for a free trial and create more interactive business intelligence dashboards. You can also contact us by submitting your questions through the Bold BI website or, if you already have an account, you can log in to submit your support question.


