


Time is invaluable for any kind of business. Time management is important for business people to succeed. It will improve your decision-making abilities. For organizations that make business decisions based on their historical data, their front-end tool should be capable of fetching data fast and visualizing it using dynamic user interactions. Having a front-end tool like Bold BI® for data visualization and a high-performance analytics database like Exasol on the back-end will let you unlock insights from your data and make business decisions quickly. In this blog post, we will explore:
- What is Exasol?
- Why do you need Exasol?
- What are its benefits?
- How to connect the Exasol database with Bold BI
What is Exasol?
Exasol is a high-performance, in-memory analytics database. It allows you to connect with various SQL clients, BI, data integration and ETL, data warehousing, and many other tools using the Exasol drivers and programming languages.
Why do you need Exasol?
The loading performance of dashboards is dependent not only on the visual rendering, but also the database querying performance. This analytics database can make your data visualization an excellent user experience through fast load times.
Benefits of using the Exasol database
Exasol helps organizations analyze large volumes of data in near real-time. You can host data from a few gigabytes to hundreds of terabytes in Exasol. The TPC-H benchmark test says EXASOL offers the highest performance, giving users high-quality results. Exasol holds the number one position for performance with data volumes ranging from 300GB to 100TB.
Connecting the Exasol database with Bold BI
The prerequisites for connecting the Exasol database using Bold BI to create an interactive dashboard are as follows:
- Exasol ODBC driver
- Bold BI Enterprise (latest version)
Download the Exasol ODBC driver from the Exasol download page and install it on your machine.
Exasol provides an ODBC driver for Windows, Linux, Unix, macOS. Follow these steps for installing and configuring the ODBC driver.
Download and install the latest version of Bold BI.
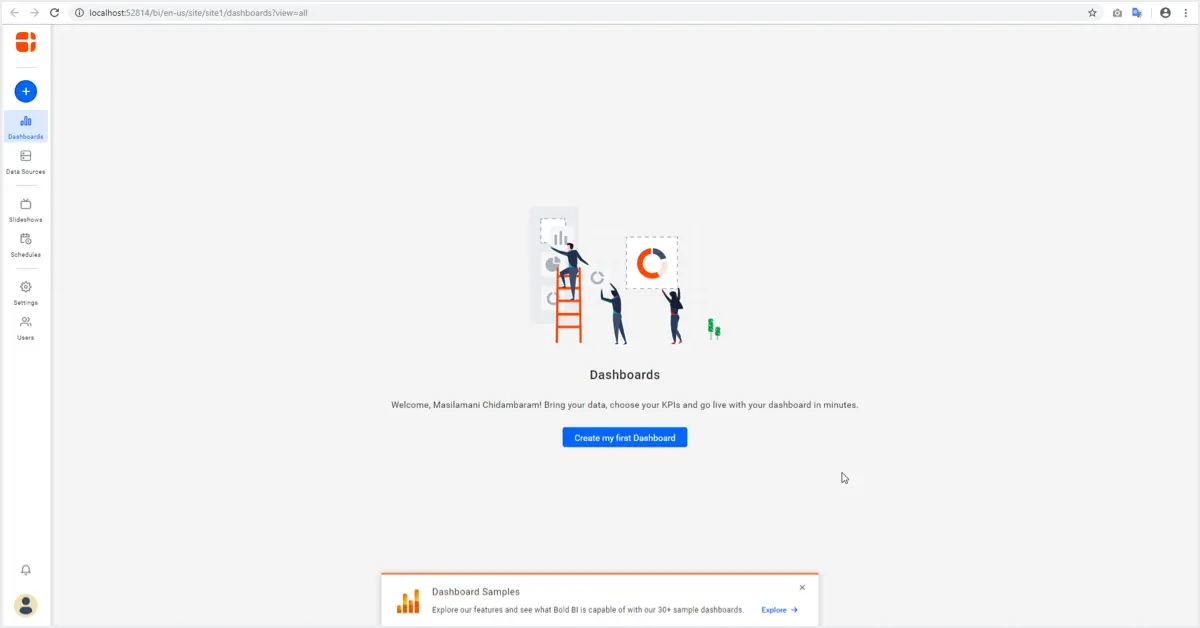
After installation of Bold BI, launch the application from the desktop shortcut and set up its back-end through configuring the database and creating a system administrator account. If you are not familiar with setting up the Bold BI application, refer to this documentation. On completion, the homepage opens like the following.
Check out our tutorial video to learn how to create a dashboard from scratch. To create the ODBC data source from the dashboard designer, click the Data Sources button in the configuration panel and select the ODBC connection in the connection panel.
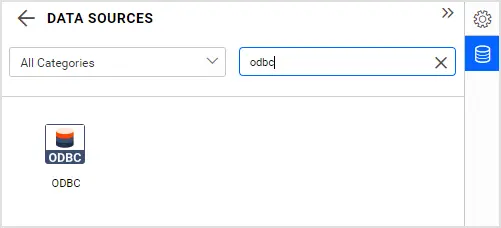
Once you select ODBC connector, the ODBC connection window will open in panel.
Creating Exasol ODBC data source
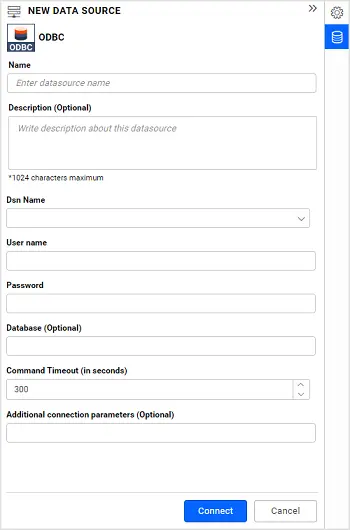
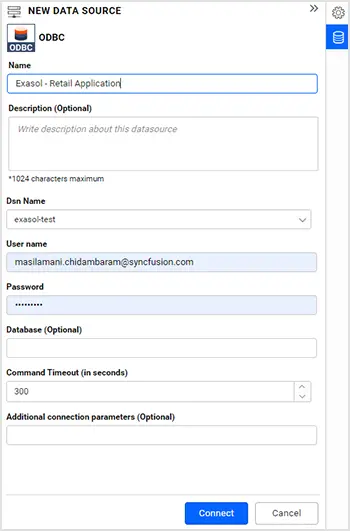
In the connection window, provide a unique name for your ODBC data source.
Your Exasol data sources are listed in the Dsn name drop-down. Select your data source from the drop-down. Enter the username and password for your Exasol database.
If you want to fetch a specific database, then provide the database name in the Database field. Otherwise, you can leave it empty. Ignore the Command Timeout and Additional connection parameters fields.
Click Connect. Consequently, the Exasol schema is listed in a tree view on the left side of the editing window. Drag and drop the table you want to analyze and save the data source.

Finally, the created data sources will be added to the DATA SOURCES panel. Now, the data source is ready to be configured with dashboard widgets. So, you can analyze gigabytes of data in a few seconds. Add required widgets to the blank dashboard that you created in the beginning and configure the widgets in the dashboard.
Creating dashboards with Exasol data
Let’s visualize Chicago taxi service performance and retail industry revenue performance metrics with analytics data from Exasol using Bold BI dashboards through the ODBC data connection.
Refer to the below the Chicago taxi service performance dashboard.
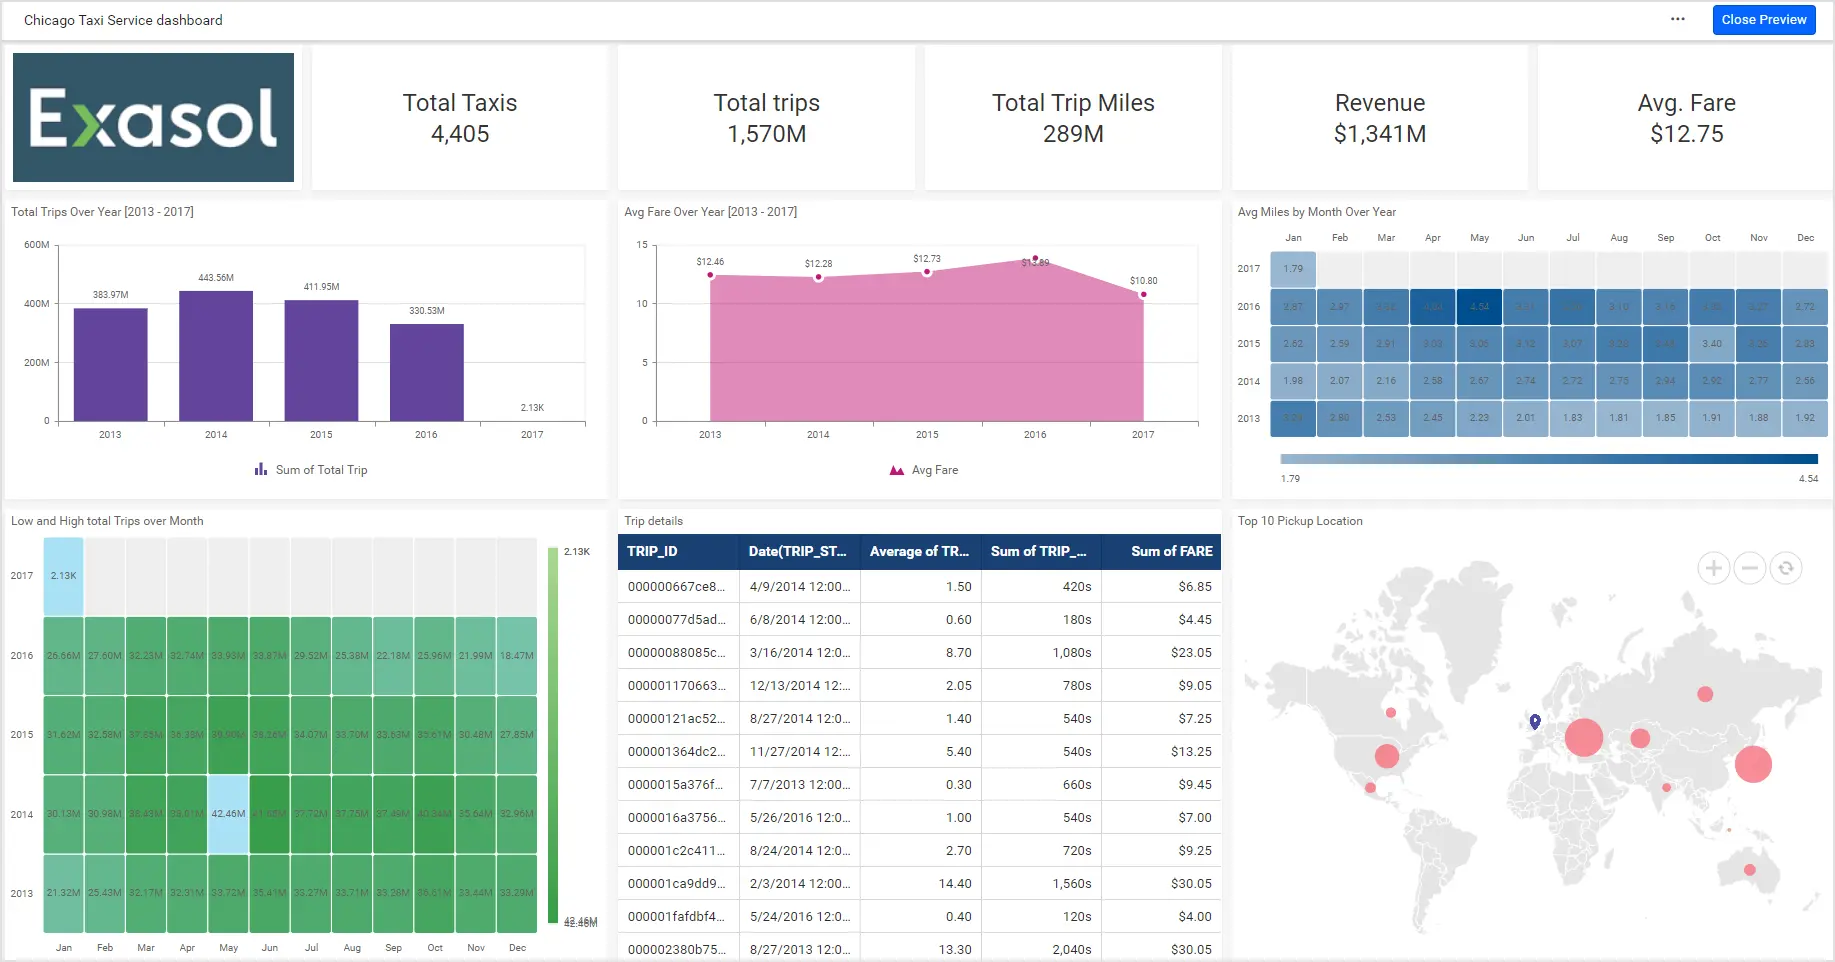
This dashboard focuses on monitoring Chicago taxi service performance through the following metrics:
- Total taxis
- Total trips and trip miles
- Revenue
- Average fare
- Total trips over a year
- Average fare over a year
- Average miles by month over a year
- Low and high total trips over a month
- Trip details
- Top 10 pickup locations
Here is another dashboard showcasing the revenue performance of a retail company.
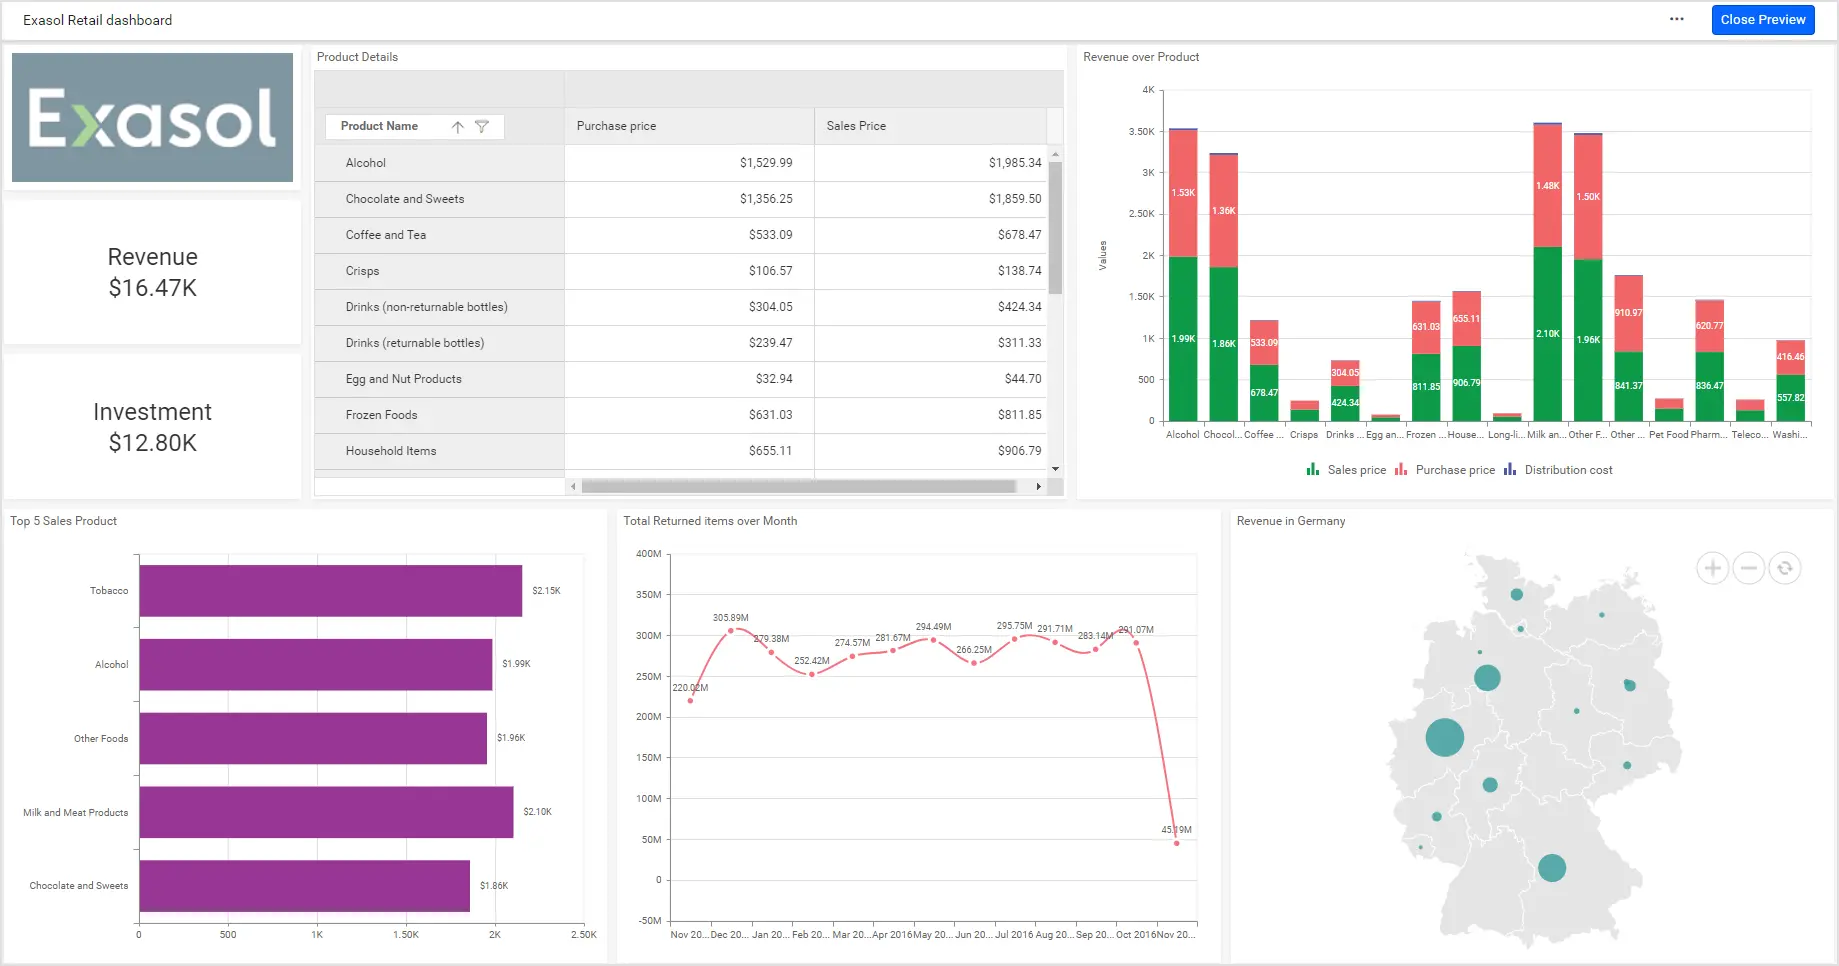
The following metrics are enough to track the revenue performance of a retail company:
- Revenue
- Investment
- Product details
- Revenue of a product
- Top 5 sales products
- Total returned items in a month
- Revenue in Germany
Loading time of dashboard
Rendering 1.29 billion of records (158 GB) of Exasol data in a Bold BI dashboard takes approximately just eight seconds. It used to take more than a minute with other common database providers.
Conclusion
We hope this article provided enough information about the Exasol analytics database and its integration with Bold BI® in delivering timely output. In this blog, you have gone through two different domain examples with some useful KPIs showcasing this integration. If you have any questions on this blog, please feel free to post them in the following comment section. Get started with Bold BI by signing up for a free trial and create more interactive business intelligence dashboards. You can also contact us by submitting your questions through the Bold BI website or, if you already have an account, you can log in to submit your support question.


