


CData Connect Cloud provides data connectivity for more than 120 different cloud data sources with virtual database connections using the wire protocol database of MySQL instances. It enables integration with other cloud applications to connect their data sources using MySQL instances in an easy and secure manner. If you are new to the CData Connect Cloud, request a trial. Now that Syncfusion has partnered with CData Software, you can connect Syncfusion’s business intelligence dashboard platform, Bold BI®, to any CData-supported data connector, including Shopify, Snowflake, Zoho CRM, and HubSpot. The virtual MySQL endpoint is provided by CData Connect Cloud for both cloud and enterprises versions.
In this blog, let’s see how to connect Northwind Traders Sales data in Google Sheets through creating a virtual database in the CData Connect Cloud and then create a live, interactive dashboard visualizing that data. CData Connect Cloud allows you to create a virtual database for any supported connector and make it available as a standard SQL interface.
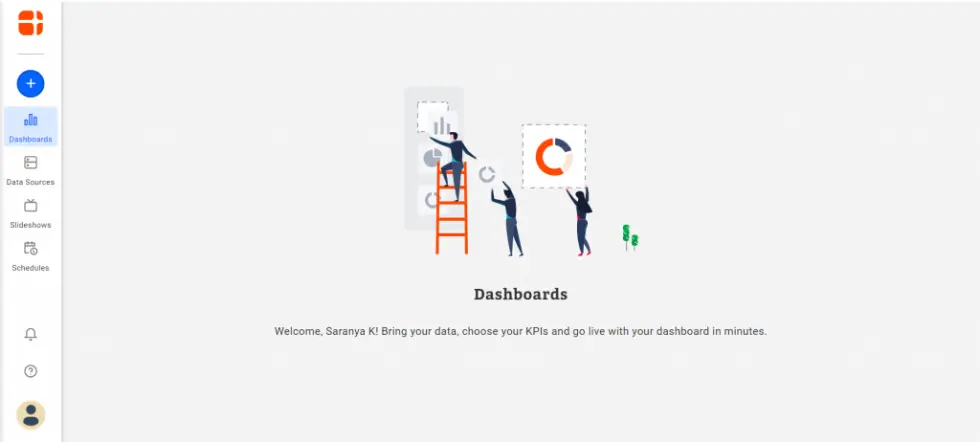
If you are new to Bold BI dashboards, sign up for a free trial on our website. At the end of the registration process, you will reach the following page view.
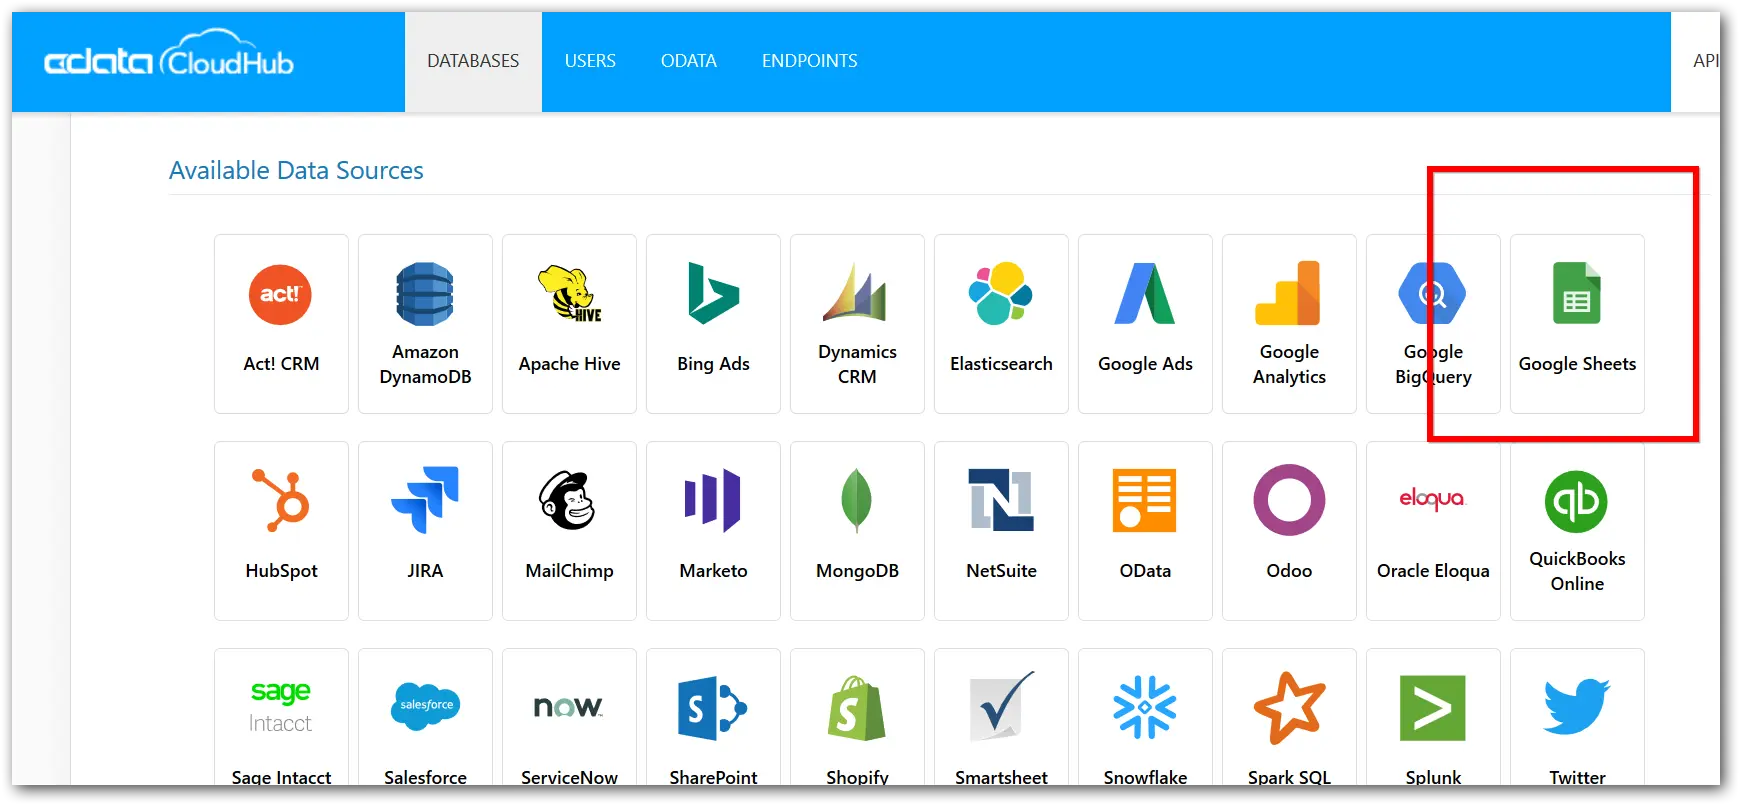
Creating a virtual database in CData Connect Cloud
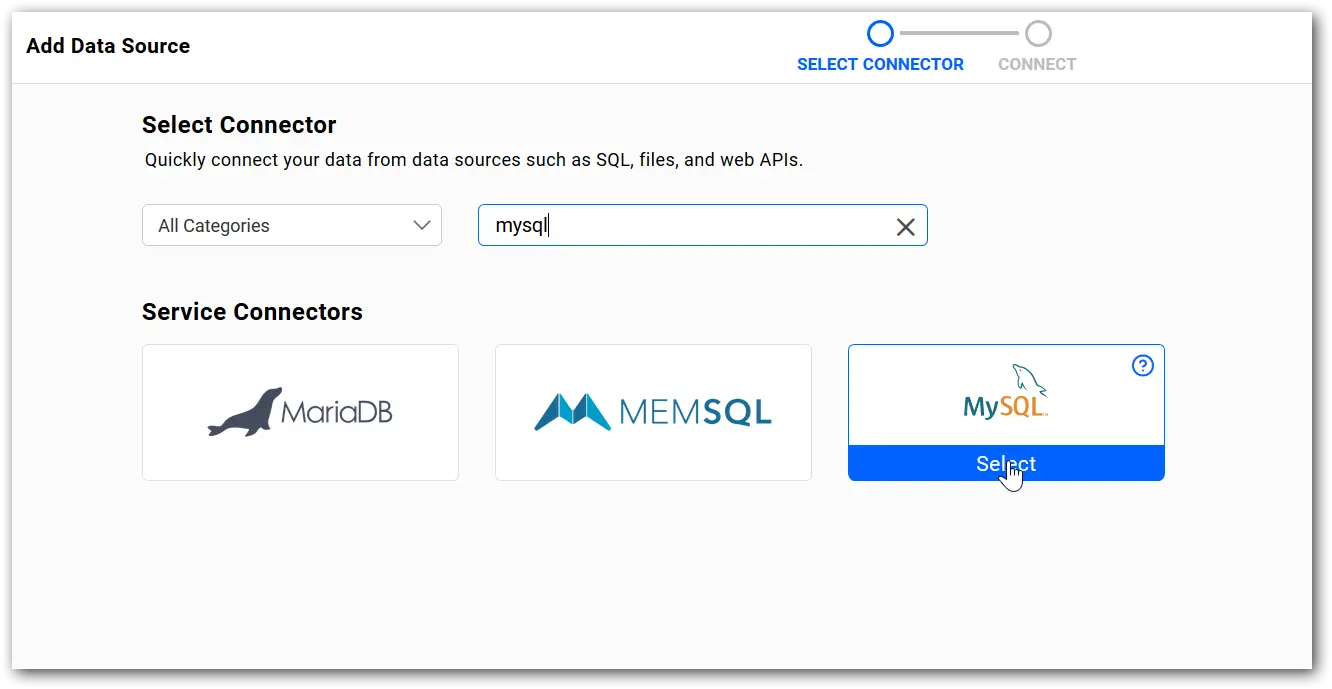
In your CData Connect Cloud, click the Google Sheets data source and create a virtual database by logging into your Google account.
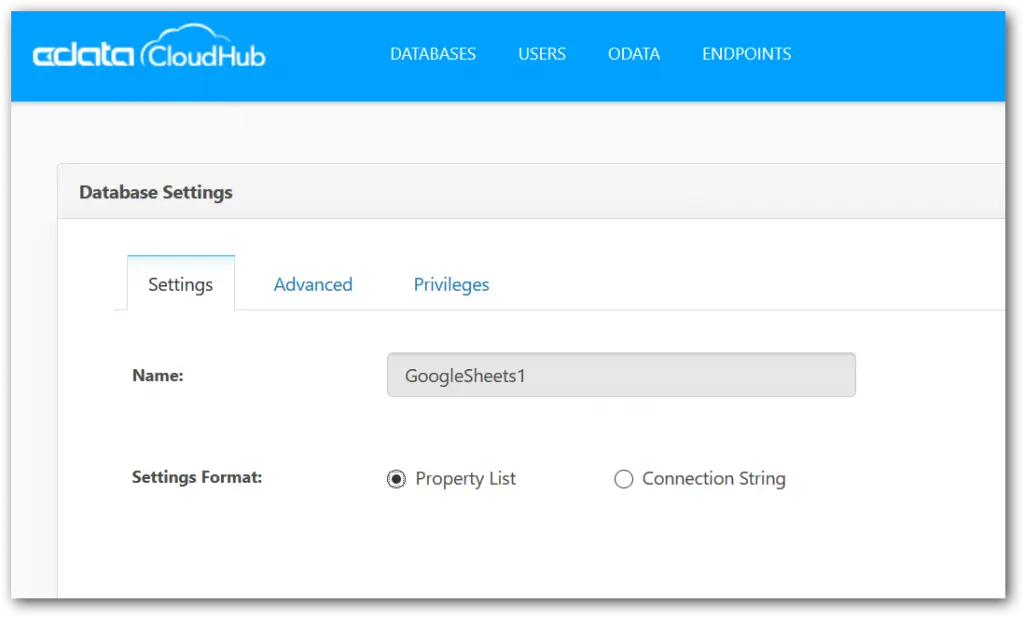
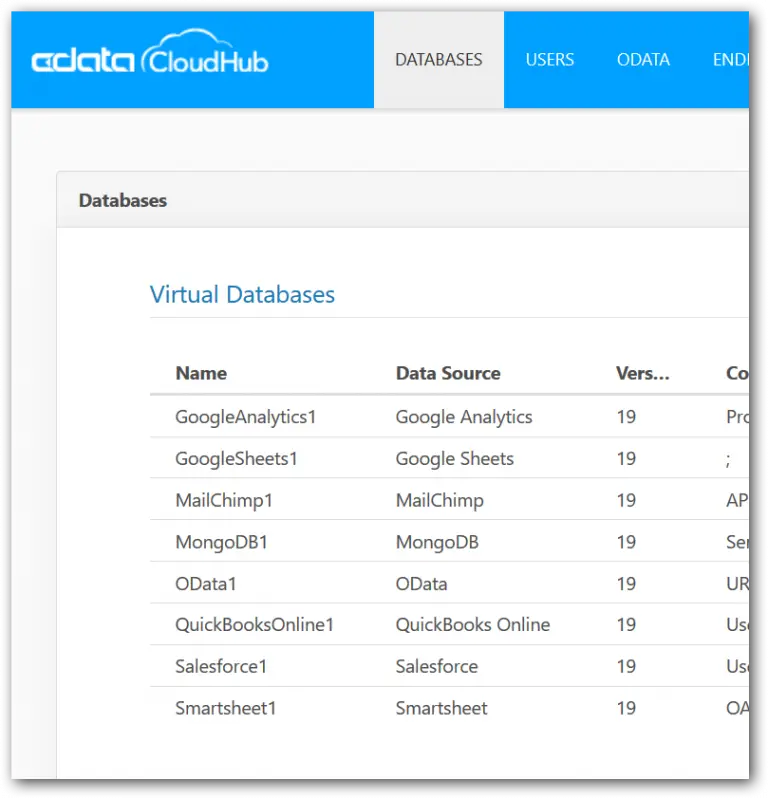
Once you’ve authenticated and saved the Google Sheets virtual database, you are ready to connect to Bold BI with the MySQL endpoint.
Creating a sales dashboard
If you are new to data source creation, refer to Introduction to Bold BI Data Sources.
To create your dashboard, first connect to the Bold BI MySQL data source with the CData Connect Cloud MySQL instance in live mode. Live mode fetches the data from the database server by executing the query every time. Hence the dashboard shows the latest metrics in real time for live connections.
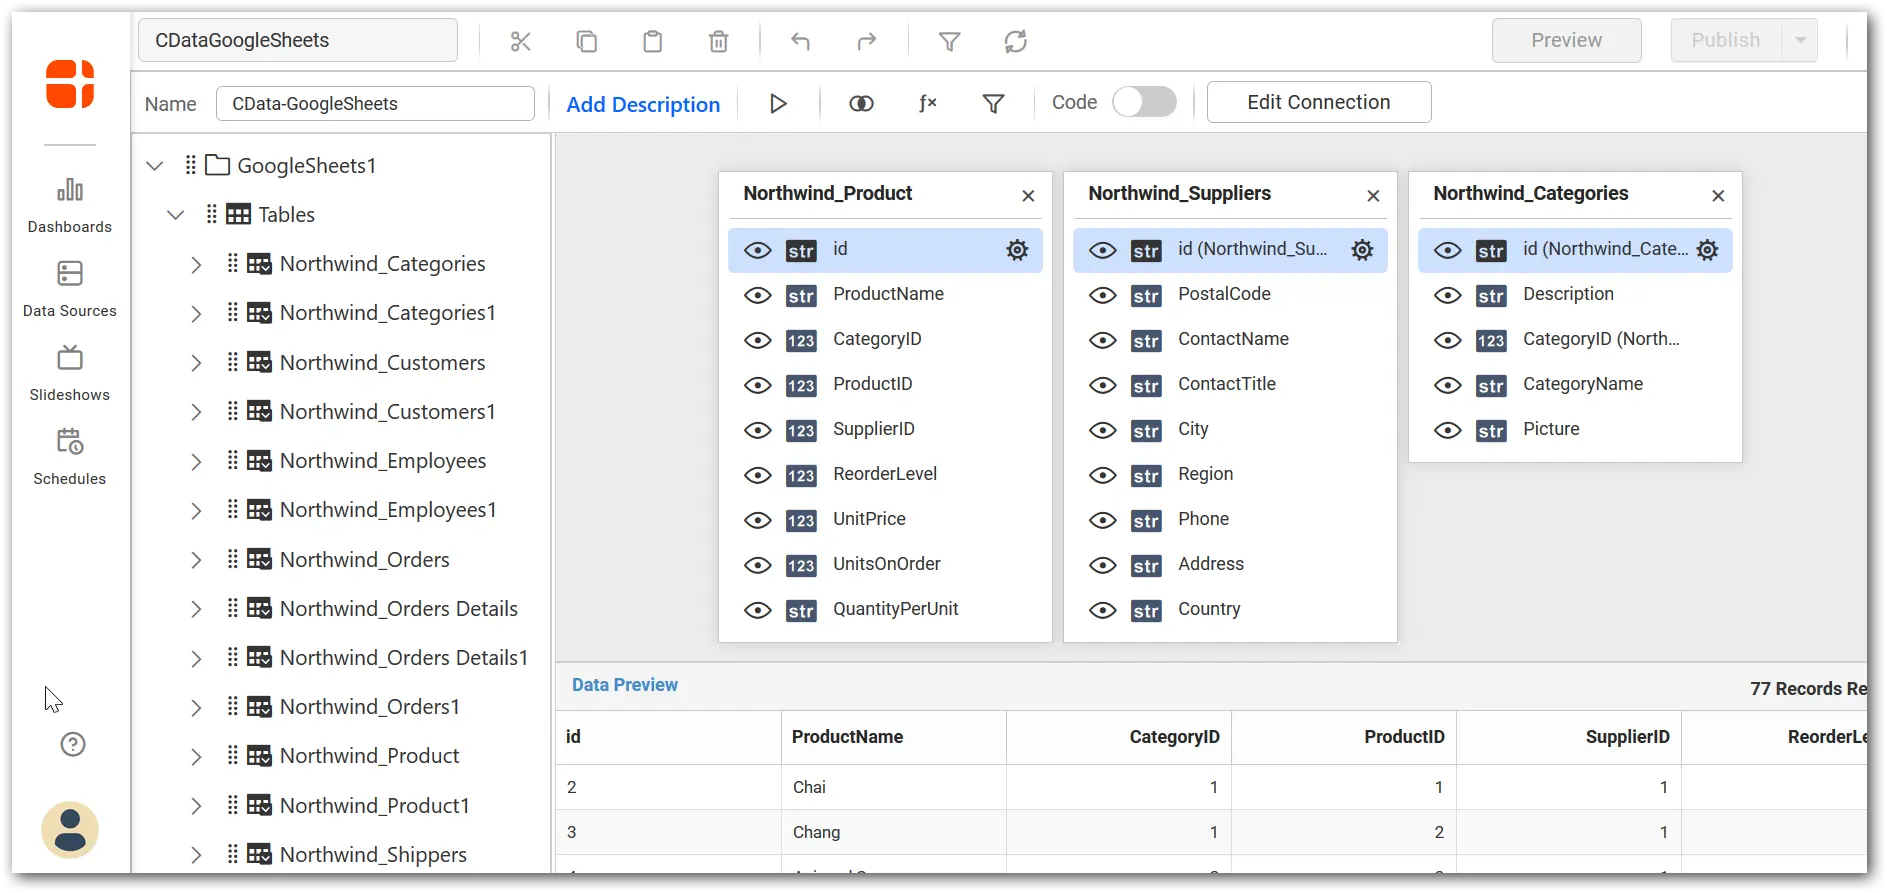
Once connected to the MySQL data source, the Google Sheets associated with your Google account will be shown as a table. Drag the required table to the canvas and save the data source.
Now you are all set to create a dashboard. Check out the How to Create a Dashboard video tutorial to get started with dashboard creation.
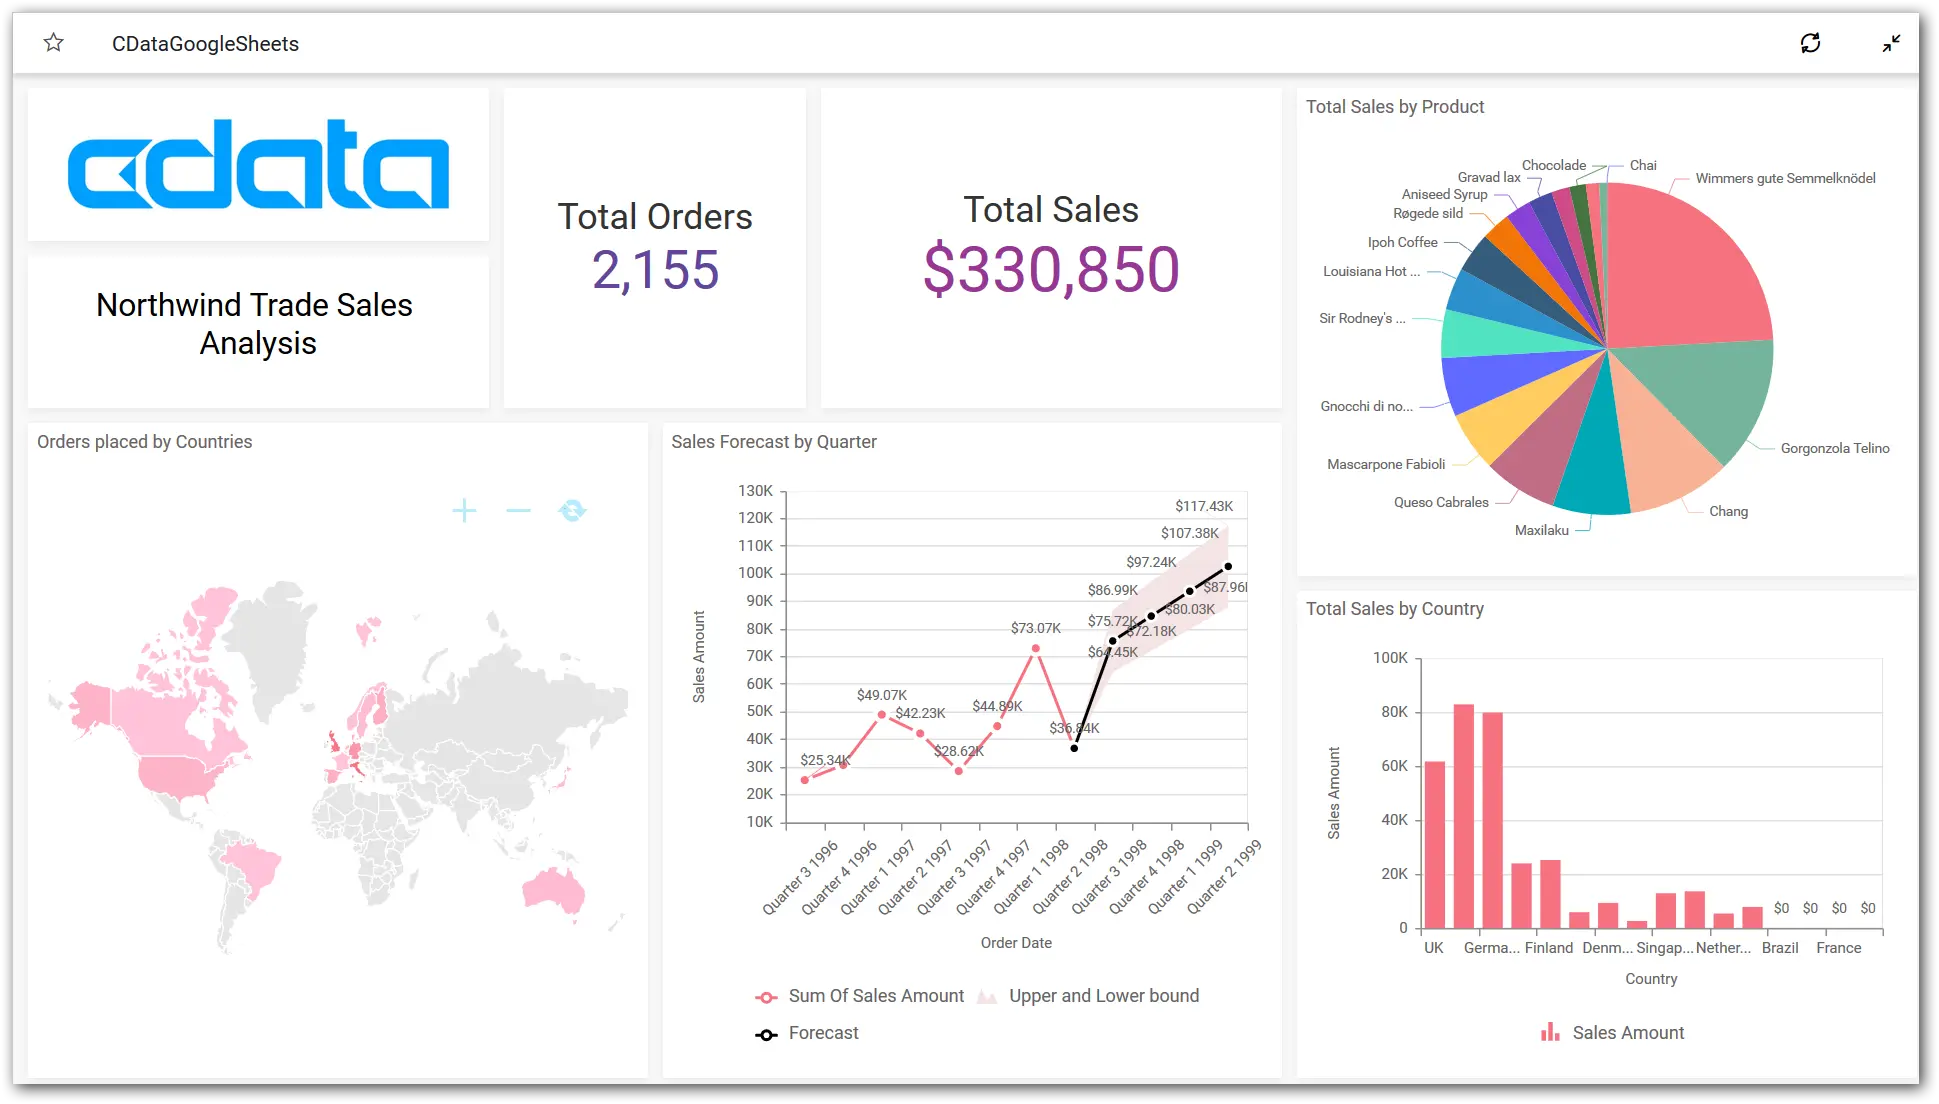
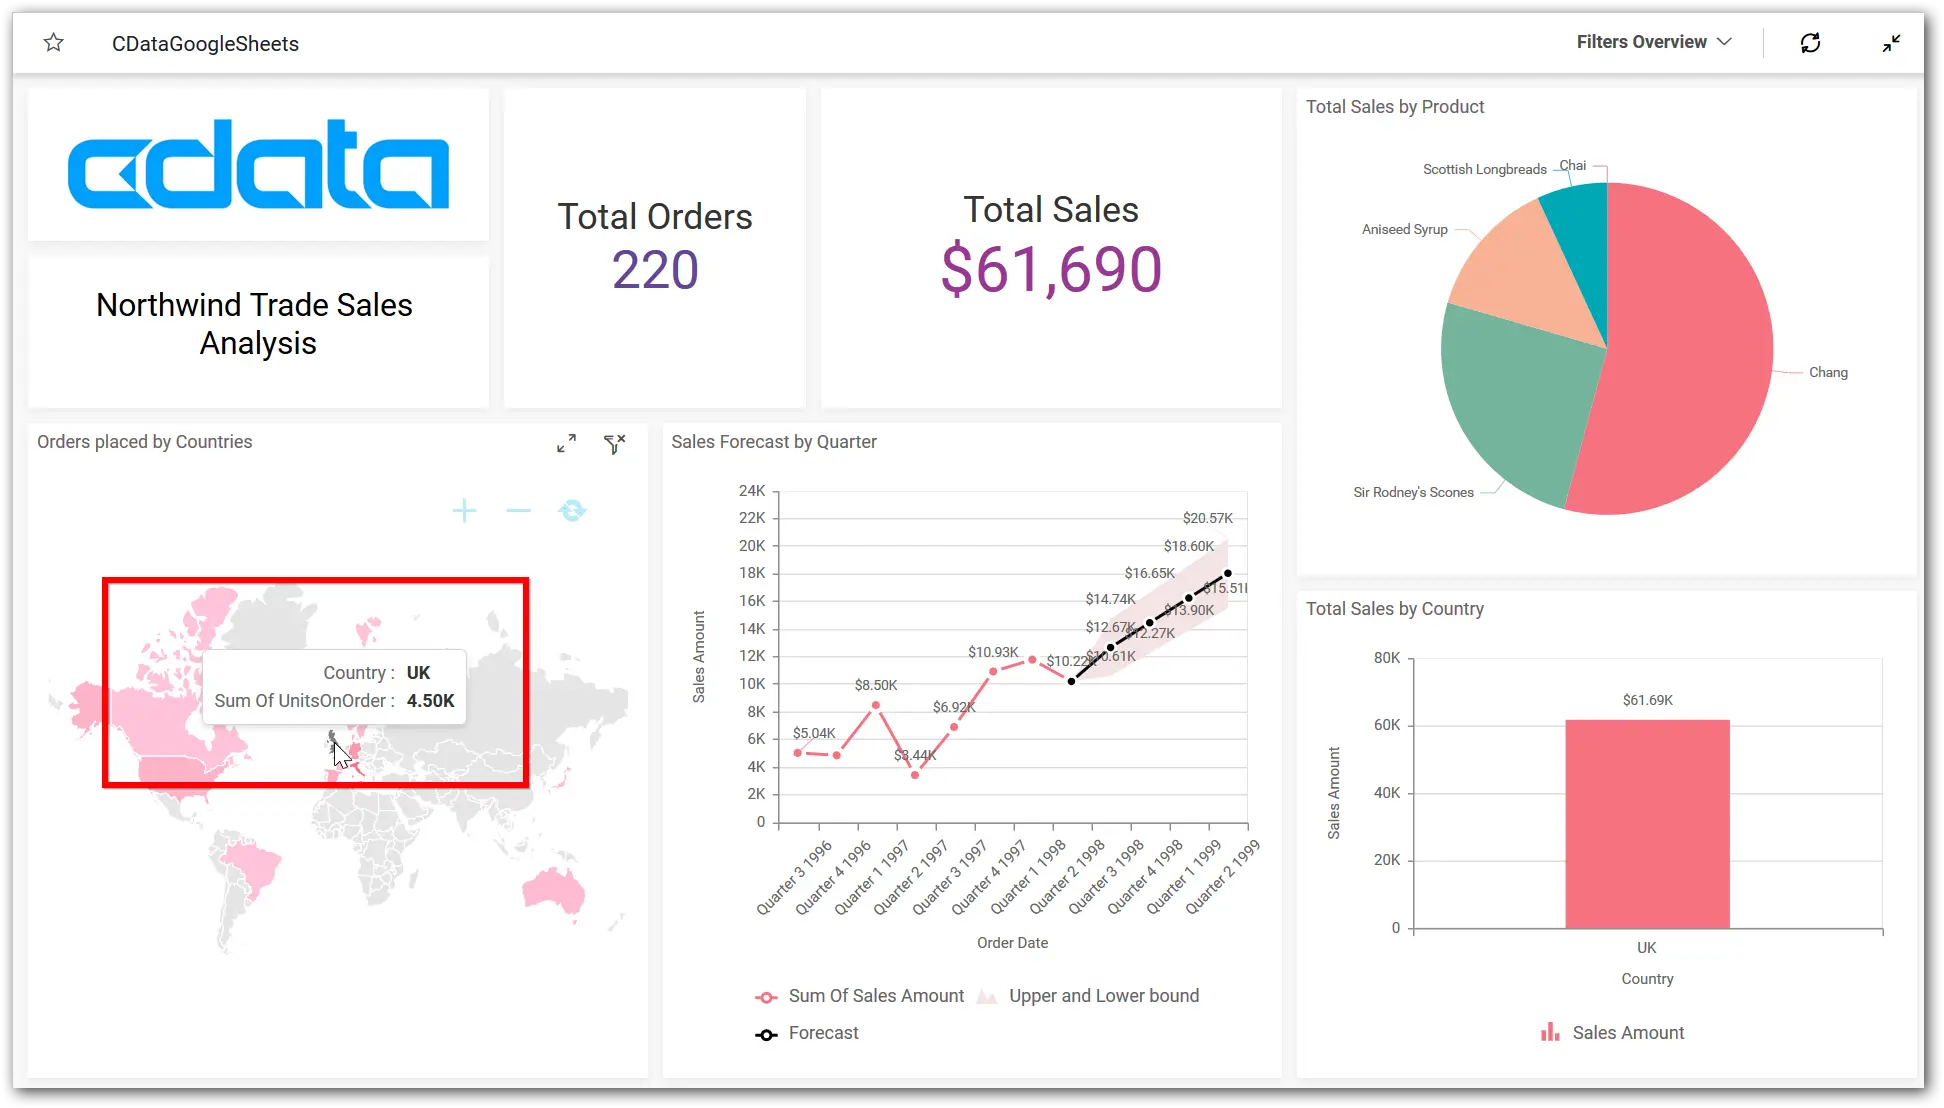
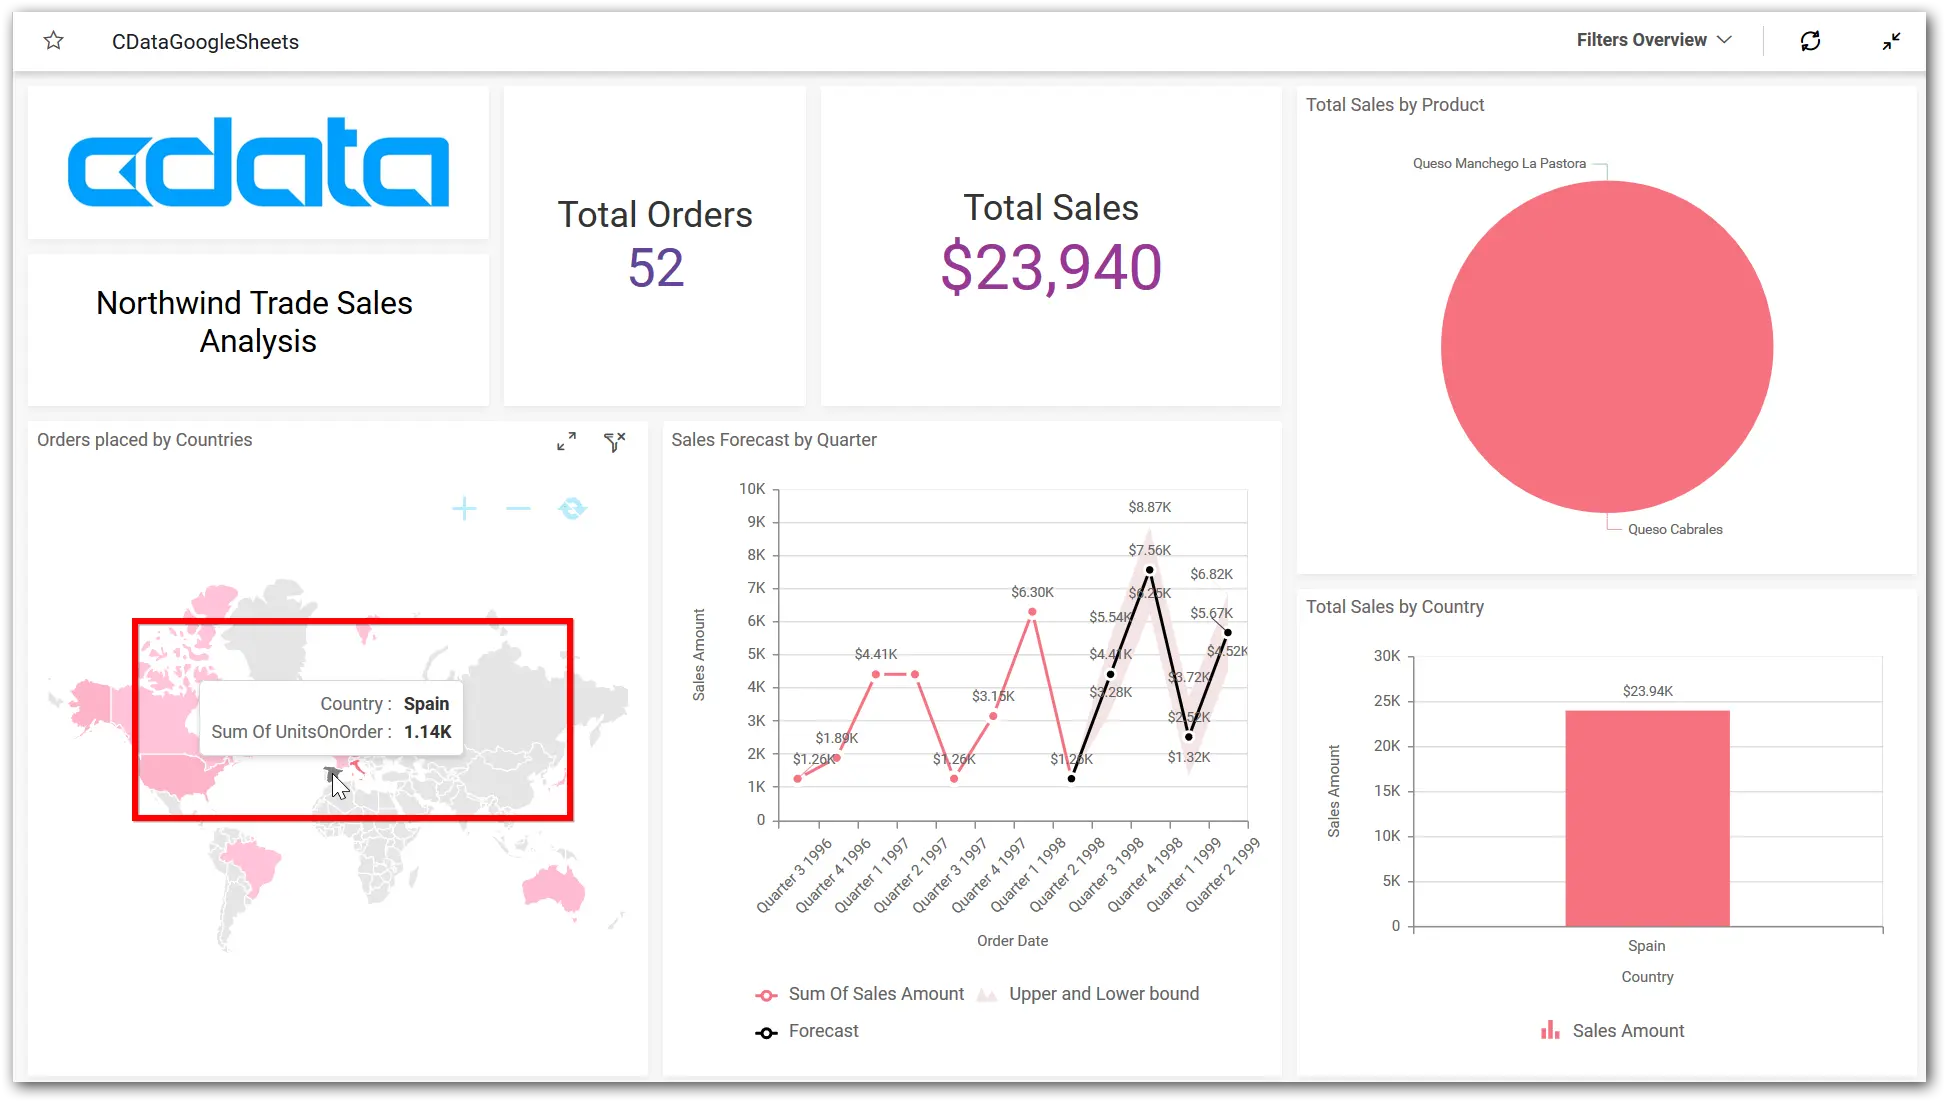
In the above sample dashboard, you can see the metrics of orders and total sales by country and product. You can also filter the data by selecting a specific country on the map widget. Now you can share your dashboard with your team and start to collaborate on the Bold BI® dashboard online.
If you have any questions on this blog, please feel free to post them in the following comment section. Get started with Bold BI by signing up for a free trial and create more interactive business intelligence dashboards. You can also contact us by submitting your questions through the Bold BI website or, if you already have an account, you can log in to submit your support question.


