


Introduction
The oil and gas industry plays a key role in this energy-hungry era. The processes and systems involved in producing and distributing oil and gas are highly complex and require state-of-the-art technology. Since the oil and gas demand is increasing, the competition is also increasing.
Embedded analytics helps business by presenting a company’s historical data with advanced BI tools for analyzing it in the company’s everyday work application. Those utilizing those tools gain insight into the strengths and weaknesses of different aspects of the business, helping them make knowledgeable decisions. In this blog post, I am going to give you an overview of embedded analytics and how it can help you enhance business in the oil and gas industry.
Contents:
- What is embedded analytics?
- Benefits of embedded analytics in the oil and gas industry.
- Bold BI’s oil and gas solution dashboard examples.
- How to embed analytical tools into oil and gas domain apps.
What Is Embedded Analytics?
Embedded analytics is the integration of analytical solutions and data visualization capabilities into a software application’s user interface to improve data comprehension and usability. Bold BI® helps you easily embed an analytics solution into your everyday work applications using a JavaScript SDK and server application. It also enables nontechnical people to monitor data sets with attractive dashboards and glean all the insights they need to improve organizational and workforce outcomes.
Benefits of Embedded Analytics in the Oil and Gas Industry
The oil and gas industry has a lot of data flowing through and collecting in all departments in every organization. Extracting insights from the data in real time is a tedious process. Embedding analytical dashboards in your websites gives you:
- Enhanced monitoring and decision making.
- Better inventory management.
- Reduction in production cost.
- Increased logistic efficiency.
Enhanced monitoring and decision making

Embedding analytics helps in tracking key metrics such as oil BOEPD, gas BOEPD, total production by state, and top oil-producing wells. By using predictive analytics with these metrics, you can analyze previous years’ data and predict future market trends. By monitoring these metrics, managers get a complete picture of the industry’s performance and market, and they can make data-driven decisions ahead of their competitors.
Better inventory management

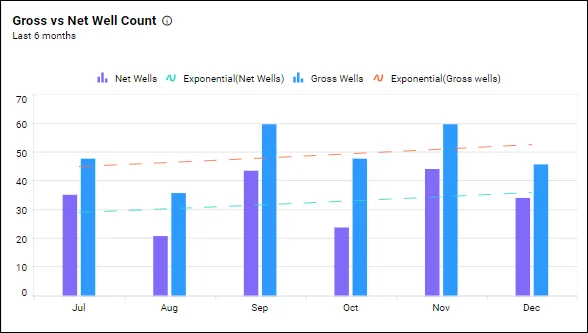
Embedding analytics in oil and gas company apps help in tracking key metrics such as gross vs. net well count and total production in the last four weeks. Tracking these metrics lets executives understand the performance of their oil wells and decide whether digging more oil wells would be beneficial.
The managers can also keep track of important metrics such as inventory turnover rate, stock to sale ratio, sell-through rate, and days-on-hand metrics. Monitoring these metrics helps managers know the progress of their inventory sales, letting them easily identify areas in need of change and improvement. Discovering these problem areas enable managers to implement process adjustments earlier to reduce risk of overselling and avoid problems of stock shortages and excess stock.
Reducing the production costs

Embedded analytics helps leaders of the oil and gas industry to optimize the cost of production and safety of extraction, as well as make energy more affordable by tracking important KPIs such as lease operating statements and cash flow. Monitoring these indicators helps leaders get a proper view of the operational costs involved in the production process and how they affect the cashflow performance of the company. This helps them make proper strategic plans to reduce replacement costs for equipment, to purchase only imminently needed equipment, and more, thus reducing production costs.
Increasing logistic efficiency

Embedded analytics lets leaders of the oil and gas industry track metrics such as transportation cost, delivery time, order accuracy, and shipping time, helping them visualize and optimize all relevant logistic processes. Analysis of these metrics gives you a clear picture of the overall expenses involved in producing and delivering gasoline from beginning to end and the supply chain performance. Using this information, managers can run their business operational processes more smoothly and reduce costs while maintaining high quality service to their customers, increasing the logistic efficiency. With industry-wide data, they can gain an insightful view of both internal company operations and external factors such as environmental accidents and injuries, changes in regulation and taxation, and the rise of alternative energy sources.
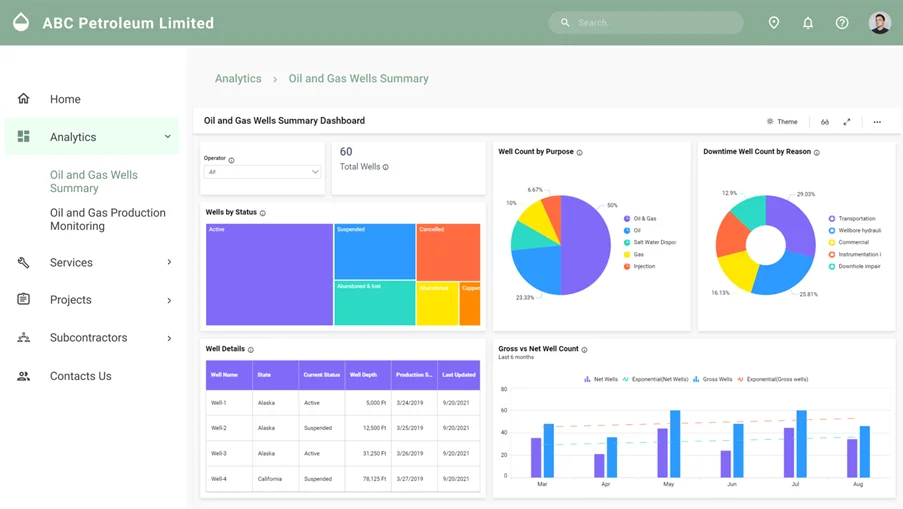
Bold BI’s Oil and Gas Wells Summary Dashboard
Embedding the Oil and Gas Wells Summary Dashboard example gives you a complete summary of the wells managed by operators with their current status, the purpose the wells, wells that are in down stage and gross, net wells count over the past 6 months, and more.
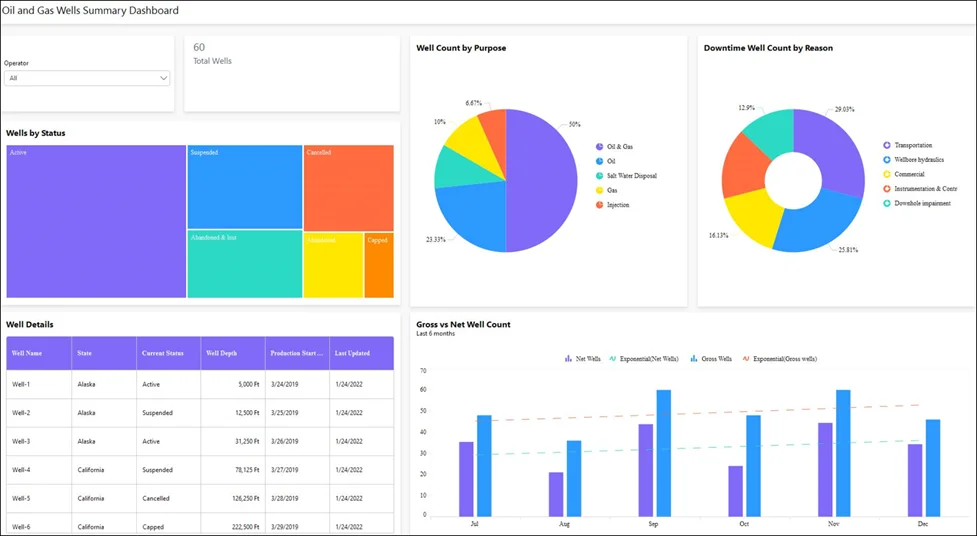
Key metrics and KPIs
Total wells
Shows the total number of wells owned by the selected operators.

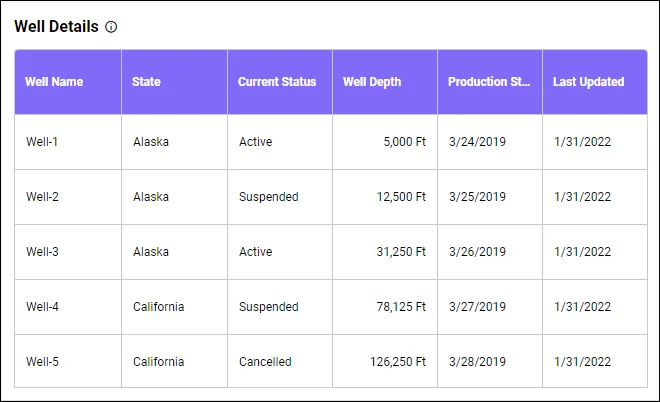
Well details
Shows the details of wells such as name, current status, depth, date when production was started, date when the well was last used, and the state where it is located.
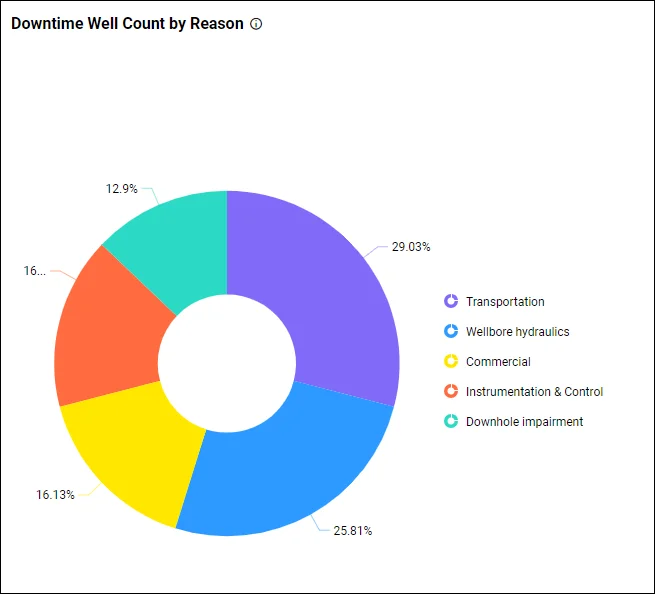
Downtime well count by reason
Shows drop in crude oil prices causing onshore oil production to slow, subsequently affecting the capital budget for onshore facilities.
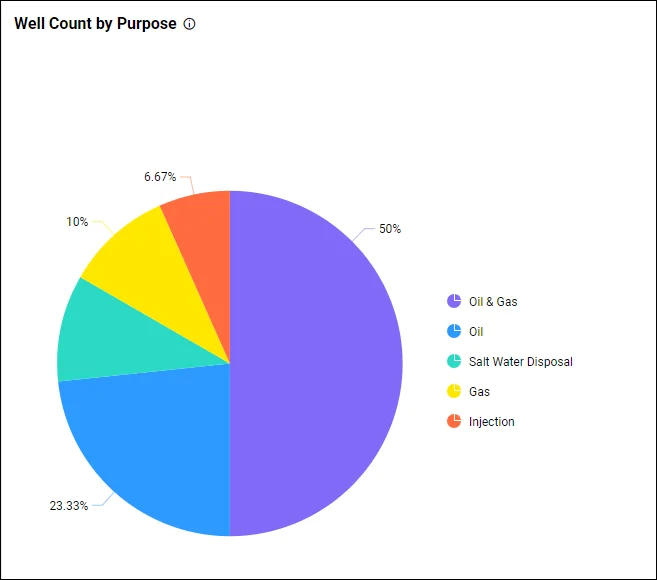
Well count by purpose
Shows the number of wells based on their purpose, such as oil and gas, gas, salt water disposal, and njection.
Gross vs. net well count
Shows gross well count and net well count over the last 6 months.
To learn more about the metrics and KPIs used in this dashboard demo, refer to Oil and Gas Wells Summary Dashboard Example.
How to embed analytical tools into oil and gas domain apps
Let’s see how analytics can be embedded into oil and gas web applications. Bold BI can embed your dashboards in more than 18 web platforms, including React with ASP.NET Core, React with Go, WinForms, Node.js, Vue with Go, and Vue with ASP.NET Core. I am going to provide a walkthrough specifically on embedding dashboards in ASP.NET MVC applications.
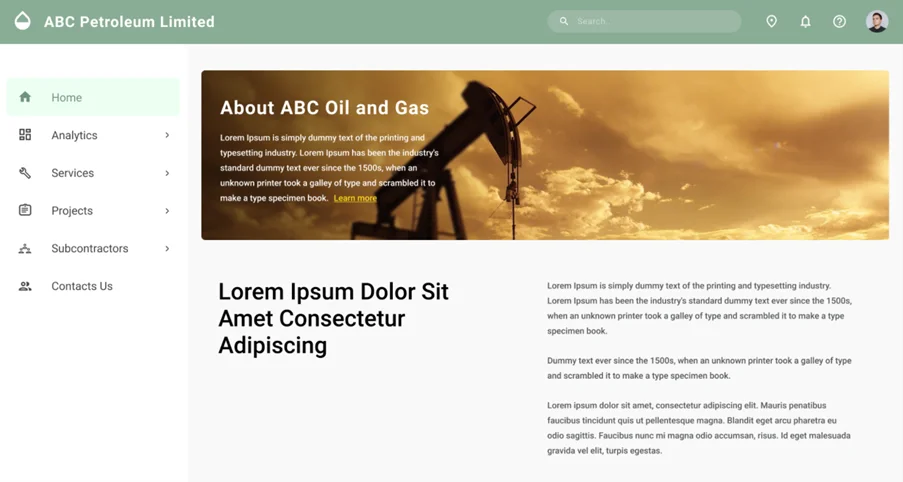
Suppose your oil and gas industry has a website like the one shown in the following image.
You can embed dashboards easily using Bold BI and avoid building an analytics or BI solution yourself. Follow these steps to embed your dashboard successfully.
Prerequisites
Download and install the Bold BI server on your local machine and create an enterprise-grade dashboard. You can find the installation and deployment instructions here.
Step 1:
To successfully embed a dashboard in your application, first you need to create an ASP.NET MVC application. Open Microsoft Visual Studio and click New Project. Then choose ASP.NET MVC Web Application, enter the project name, and click OK.
Step 2: Configure embed properties.
After the ASP.NET MVC web application is created, you need to create a model class called EmbedProperties under Models and provide the dashboard RootURL, SiteIdentifier, Environment, UserEmail, and EmbedSecret.
| Properties | Property Value Descriptions |
| RootUrl | Bold BI dashboard server URL. For example: https://localhost:5000/bi, https://dashboard.syncfusion.com/bi. |
| SiteIdentifier | For Bold BI, it should be something like “site/site1”.For the Bold BI Cloud Analytics Server, it should be an empty string. |
| Environment | Your Bold BI application environment. If using Bold BI Cloud Analytics Server, you should use “cloud.” If using Bold BI, you should use “enterprise.” |
| UserEmail | The Bold BI server will use an email address to authorize the authorization server. |
Step 3: Generate embed secret.
You have to set the EmbedSecret for authentication. You can get the embed secret from the Bold BI server. Then, navigate to the Settings icon in the left navigation bar and click the Embed tab. Click Enable embed authentication and then click the Generate Secret button to generate the embed secret. On clicking the button, a secret key will be generated, and you can paste it into the application. To learn how to do this in more detail, you can refer to this documentation link.
Note: Save the secret key, as it cannot be retrieved again. If you do not save it, you will have to generate a new one using the Reset Secret option.
Step 4: Create authorization server.
You need to implement an authorization server in the ASP.NET MVC application to get authenticated before embedding the dashboard from the Bold BI server. You can also configure the single sign-on (SSO)-based authorization server, which is an authentication endpoint that enables users to securely authenticate multiple applications using unique embed secrets. This prevents the need for the user to log into different applications separately.
Step 5: Create Bold BI instance.
Finally, create a Bold BI instance to load the dashboard using a JavaScript file. Reference required script files and CSS files in the HTML pages.
Step 6: Run the application to embed the dashboard.
After successfully creating the ASP.NET MVC application, you need to run it. It will be launched successfully with the dashboard details. Finally, you will see the dashboard created in the Bold BI server embedded in your web application.
By following the previous steps, you can successfully embed your dashboards into your ASP.MVC application.
To learn more about embedding dashboards into your applications, please refer to this blog. You can also download the sample codes mentioned in all these steps from our documentation.
Conclusion
Bold BI® helps you to integrate dashboard in your integration written in ASP.NET Core, ASP.NET MVC, ASP.NET, Ruby on Rails, and more. It will save your time, preventing you from doing unnecessary work. Click this link to explore its features.
Now that you have a better understanding of Bold BI and how it can help the oil and gas industry to be more successful, you can create a dashboard the way you like with Bold BI’s 35+ widgets and 150+ data sources.
Get started with Bold BI by signing up for a free trial and create interactive business intelligence dashboards. You can contact the Bold BI team by submitting questions through the Bold BI website or by logging into your the Bold BI account.


