


This blog contains the show notes for the June 11, 2020, webinar “Add Advanced Dashboard Interactivity Using the New Parameter Feature,” presented by Syncfusion developer Pravin Joshua D. Watch the recording on our YouTube channel or here:
Introduction
A parameter is a placeholder value such as a string, number, or date that can be dynamically changed on the fly when visualizing metrics in your Bold BI® dashboard.
Parameters can be inserted anywhere in your Bold BI dashboard, such as custom queries, calculated fields, and even conditional formatting to build a more interactive and dynamic report.
For example, you may build an expression that returns a sales commission amount, which is 2% of the total revenue. Instead of having the 2% as a constant value, you can insert a parameter whose value can be dynamically changed to calculate the commission amount.
Difference between filters and parameters
Filters are basically configured using a column in a data source. Filters are used to visualize a subset of the data by restricting it to one or more values. The filter value cannot be dynamically applied when visualizing the dashboard.
Parameters, on the other hand, are used to replace static or hard-coded values in your dashboard or data source. The user can apply any dynamic value when visualizing the dashboard.
Where can you use dashboard parameters?
Parameters can now be used in the following modules:
• SQL data connections (stored procedures, custom queries, etc.).
• Web API connections.
• Expressions for what-if analysis.
• Conditional formatting.
• User-based data access.
How to create parameters and dynamically change the values
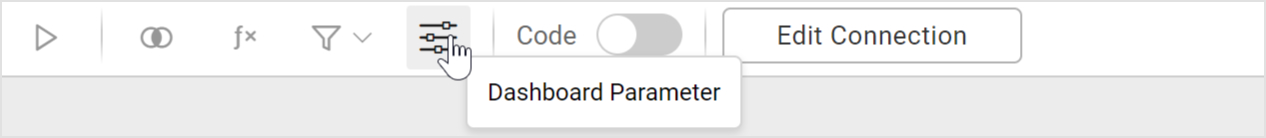
The parameters are an integral entity of the data source, rather than the dashboard itself. This will help you retain the parameters when you share the data source across multiple dashboards. Parameters can be created using the menu in the data source toolbar.
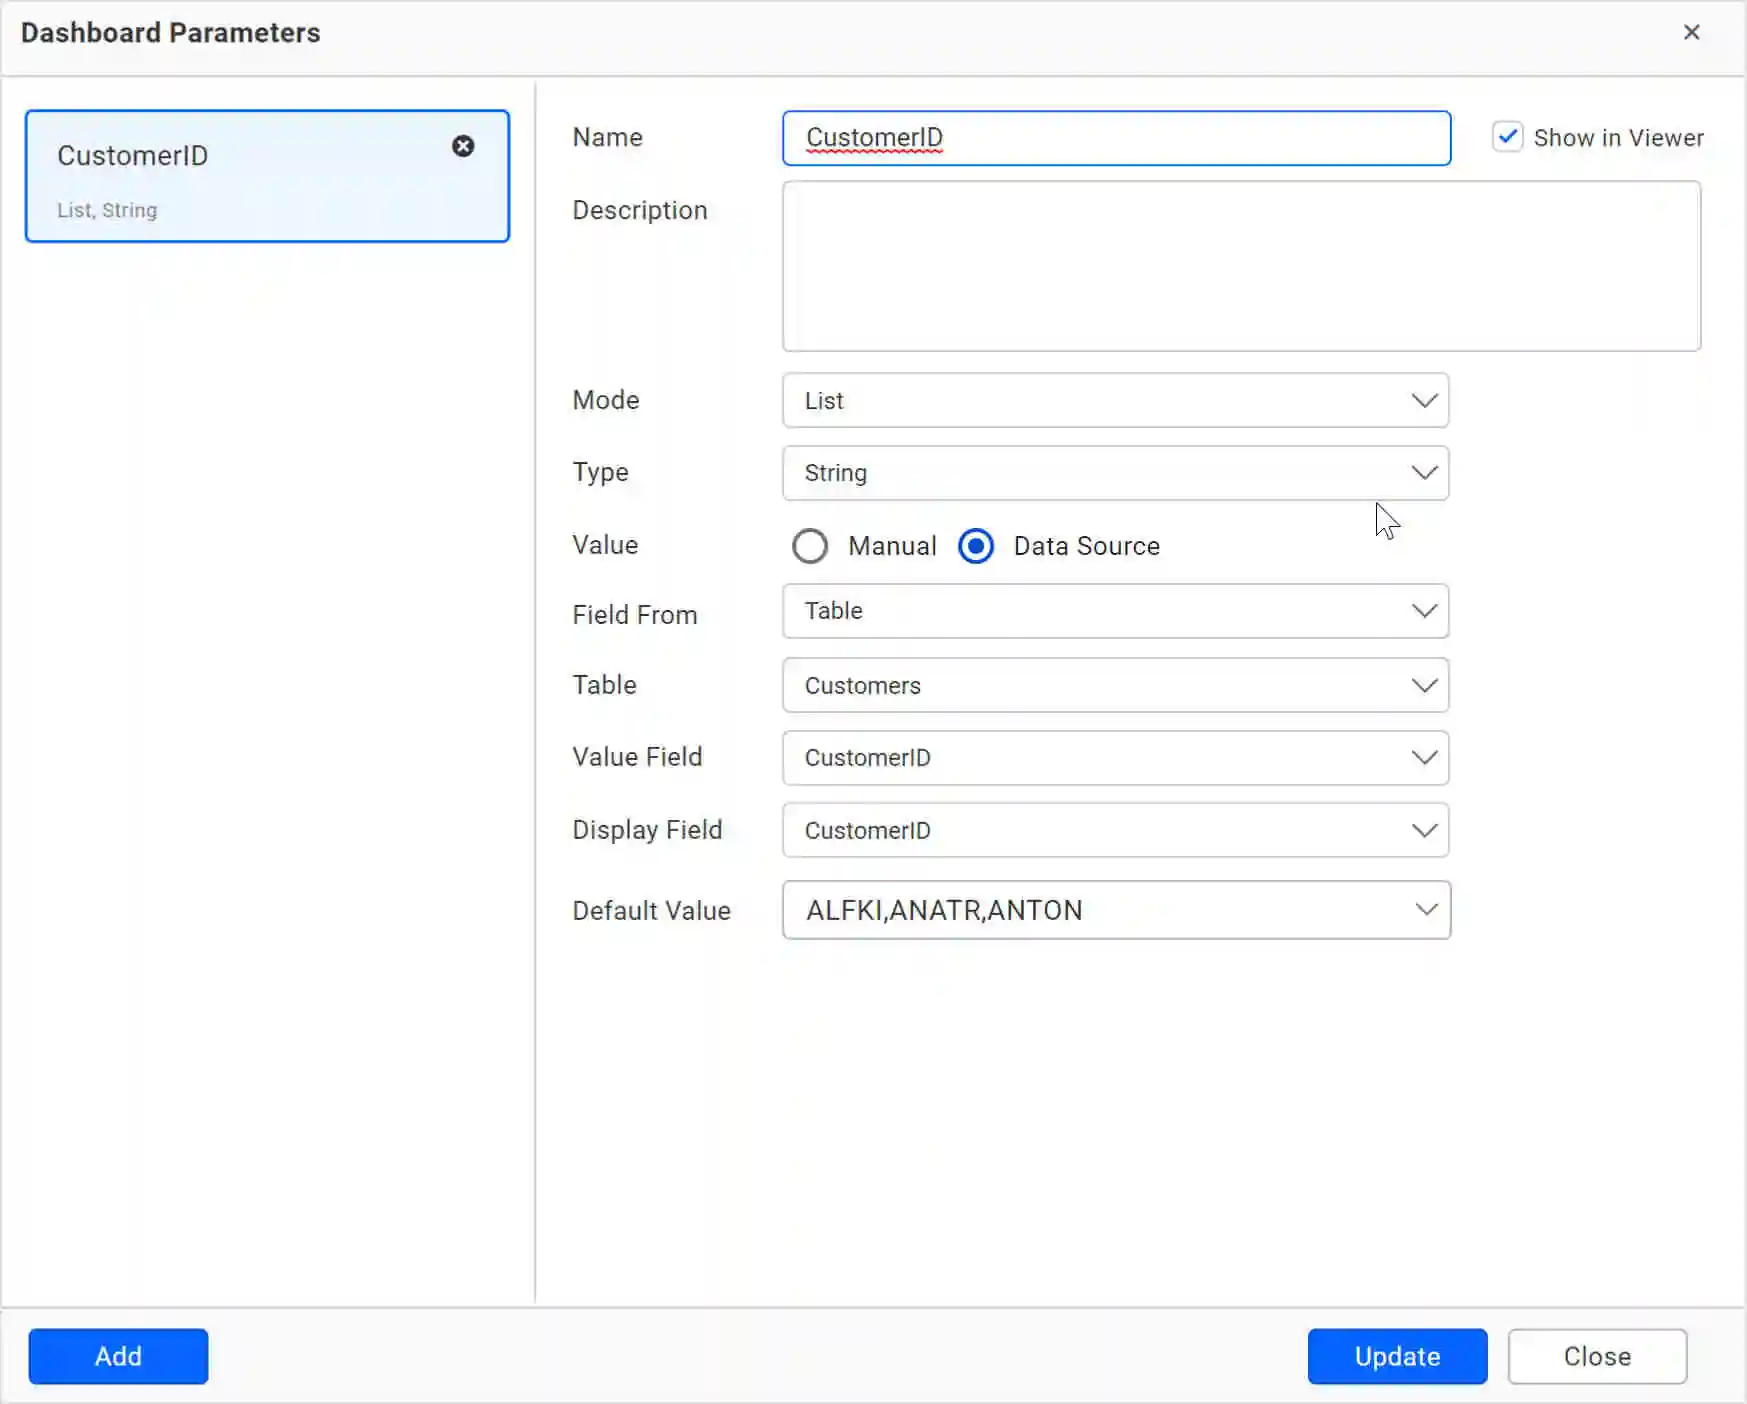
The parameters can be either literal or a list of values. The list of values can also be manually entered, or imported from a data table or an external data source.
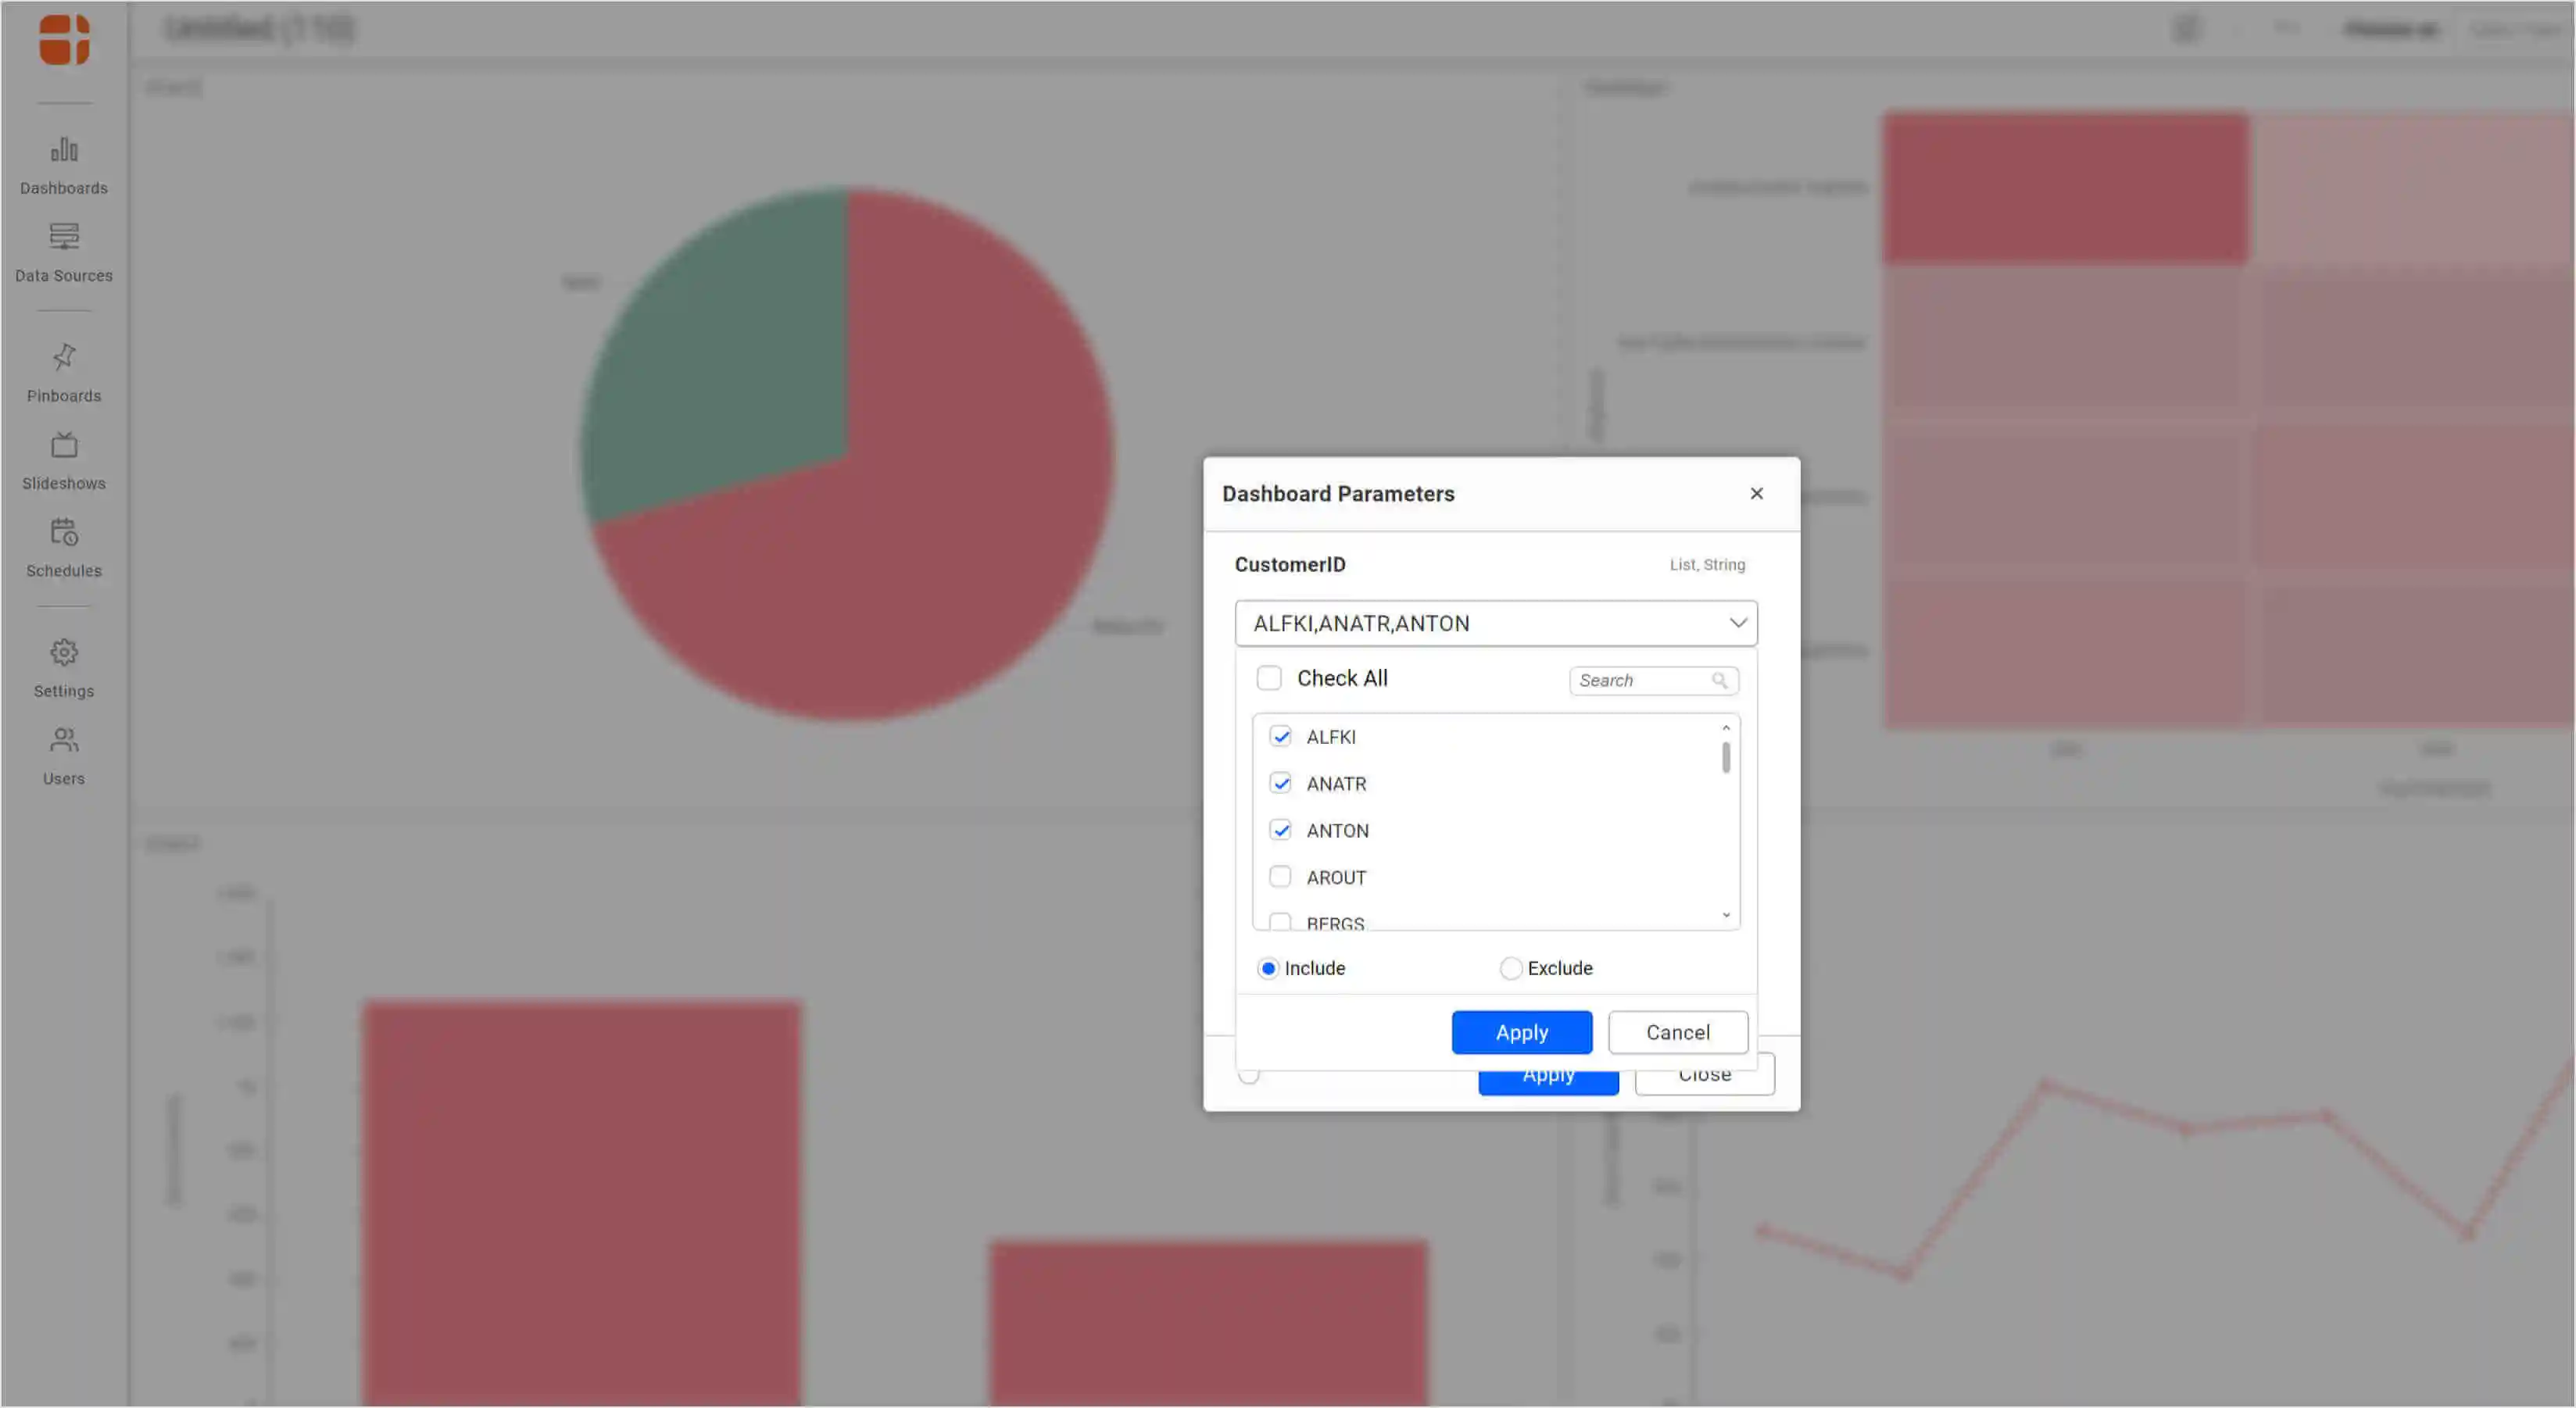
When you create a parameter and use it in any one of the these use cases, the value can be dynamically changed when visualizing the dashboard, as shown in the following.
Parameters in SQL connections
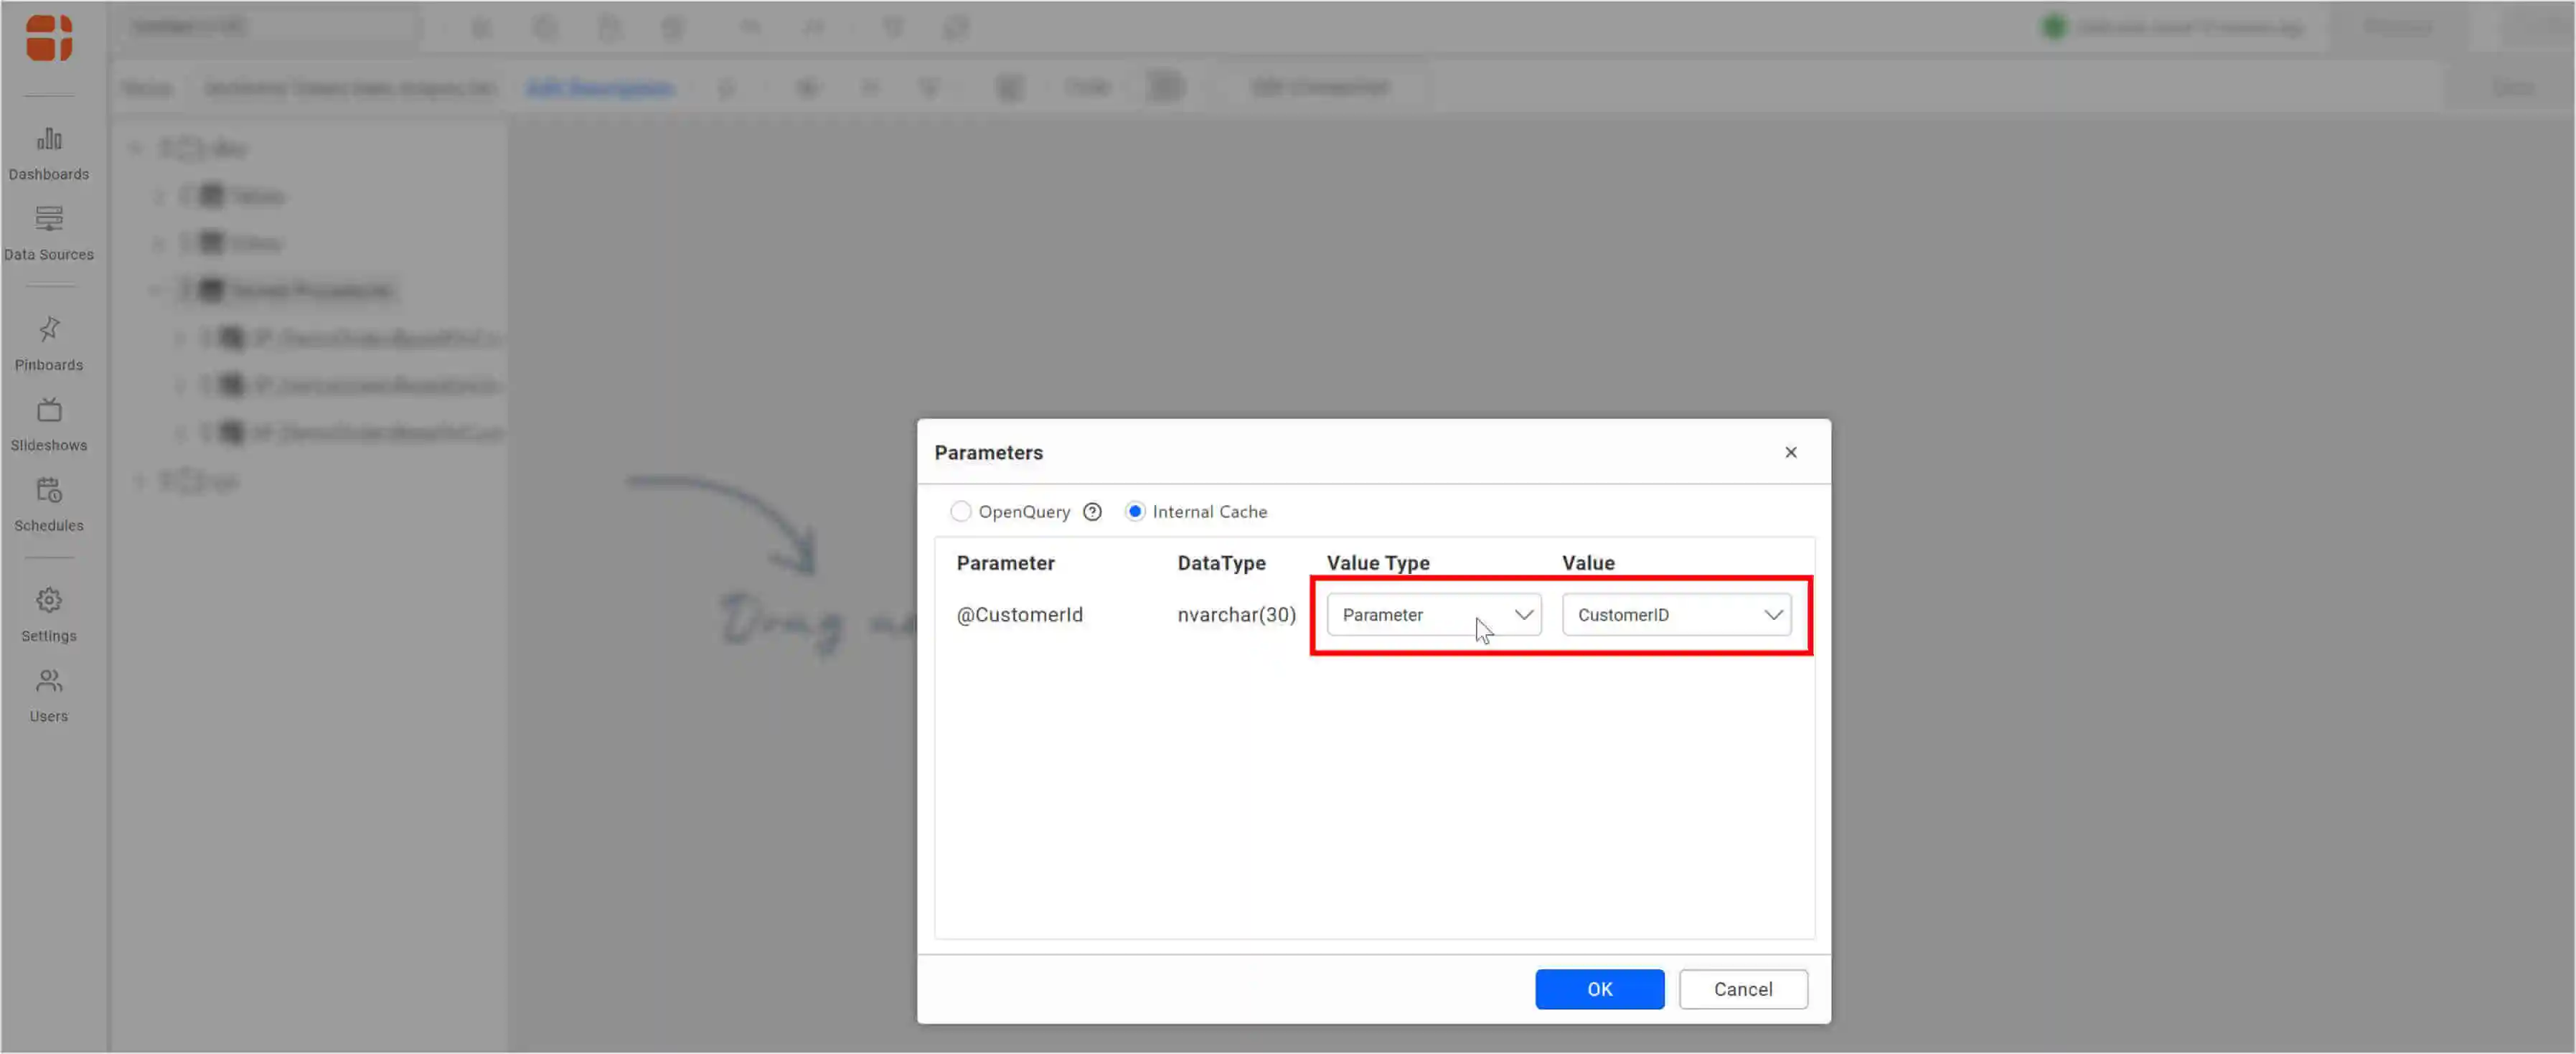
Parameters can be used to dynamically change values in your custom queries and parameterized stored procedures. A dashboard can be designed based on a default value of the parameter and then can be switched dynamically on the dashboard viewer.
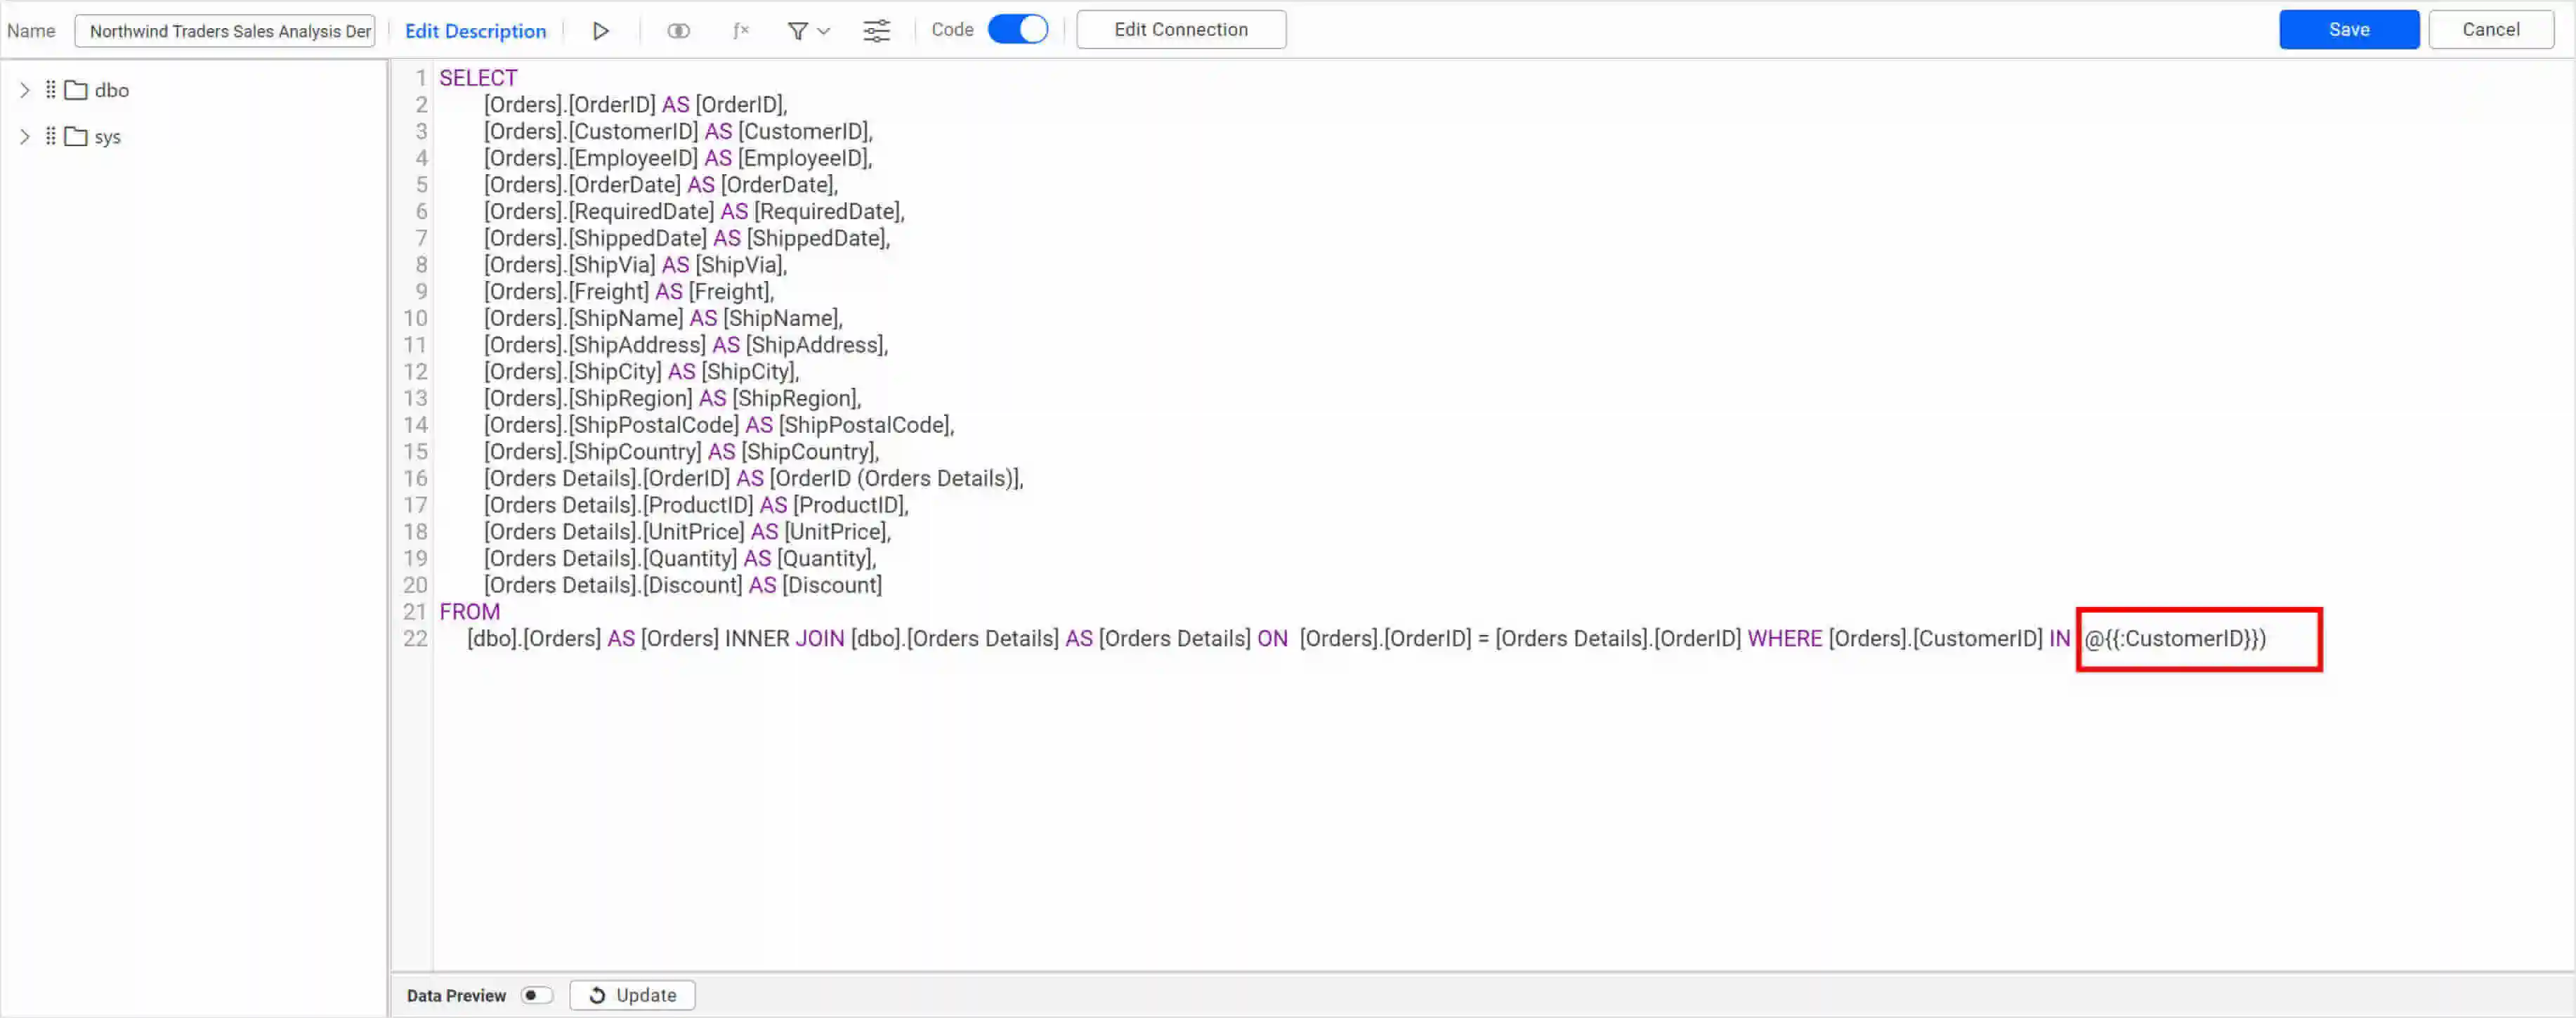
The following images show how to add a parameter to a stored procedure and custom SQL queries.
Parameters in a Web API connection
Parameters can be used in combination with the live web connector to fetch data from parameterized REST APIs.
The live web connector can fetch data from the REST API every time an interaction occurs in the dashboard. An extract connector source only acts on the extracted data that has been recently pulled.
The following image shows how a parameterized REST API is configured to dynamically fetch COVID-19 data based on region.
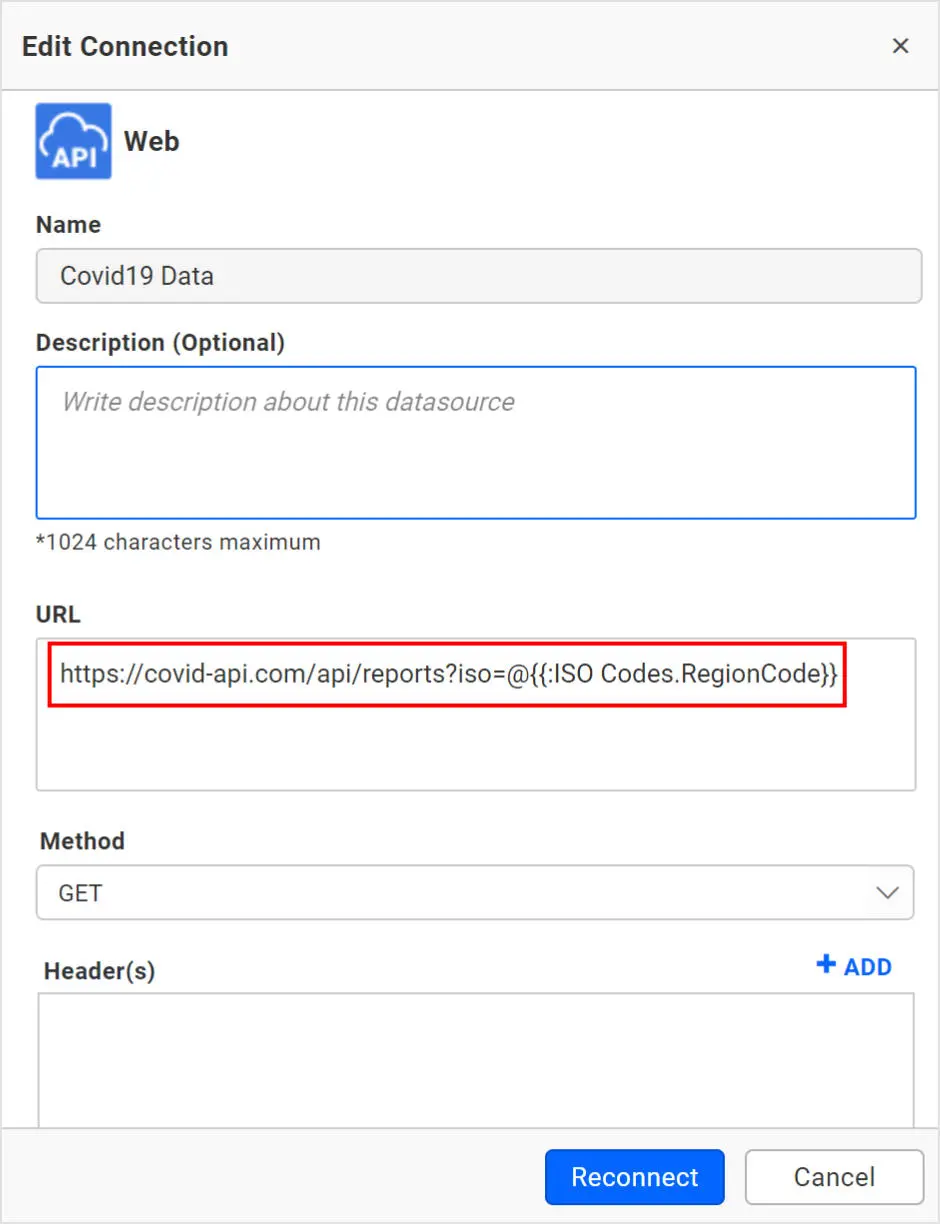
The ISO code of the region can now be switched dynamically when visualizing the dashboard.
What-if analysis using expressions
Parameters can be used in expressions wherever you would have a constant numeric value. This helps you modify the value without editing the dashboard and thus perform a what-if analysis.
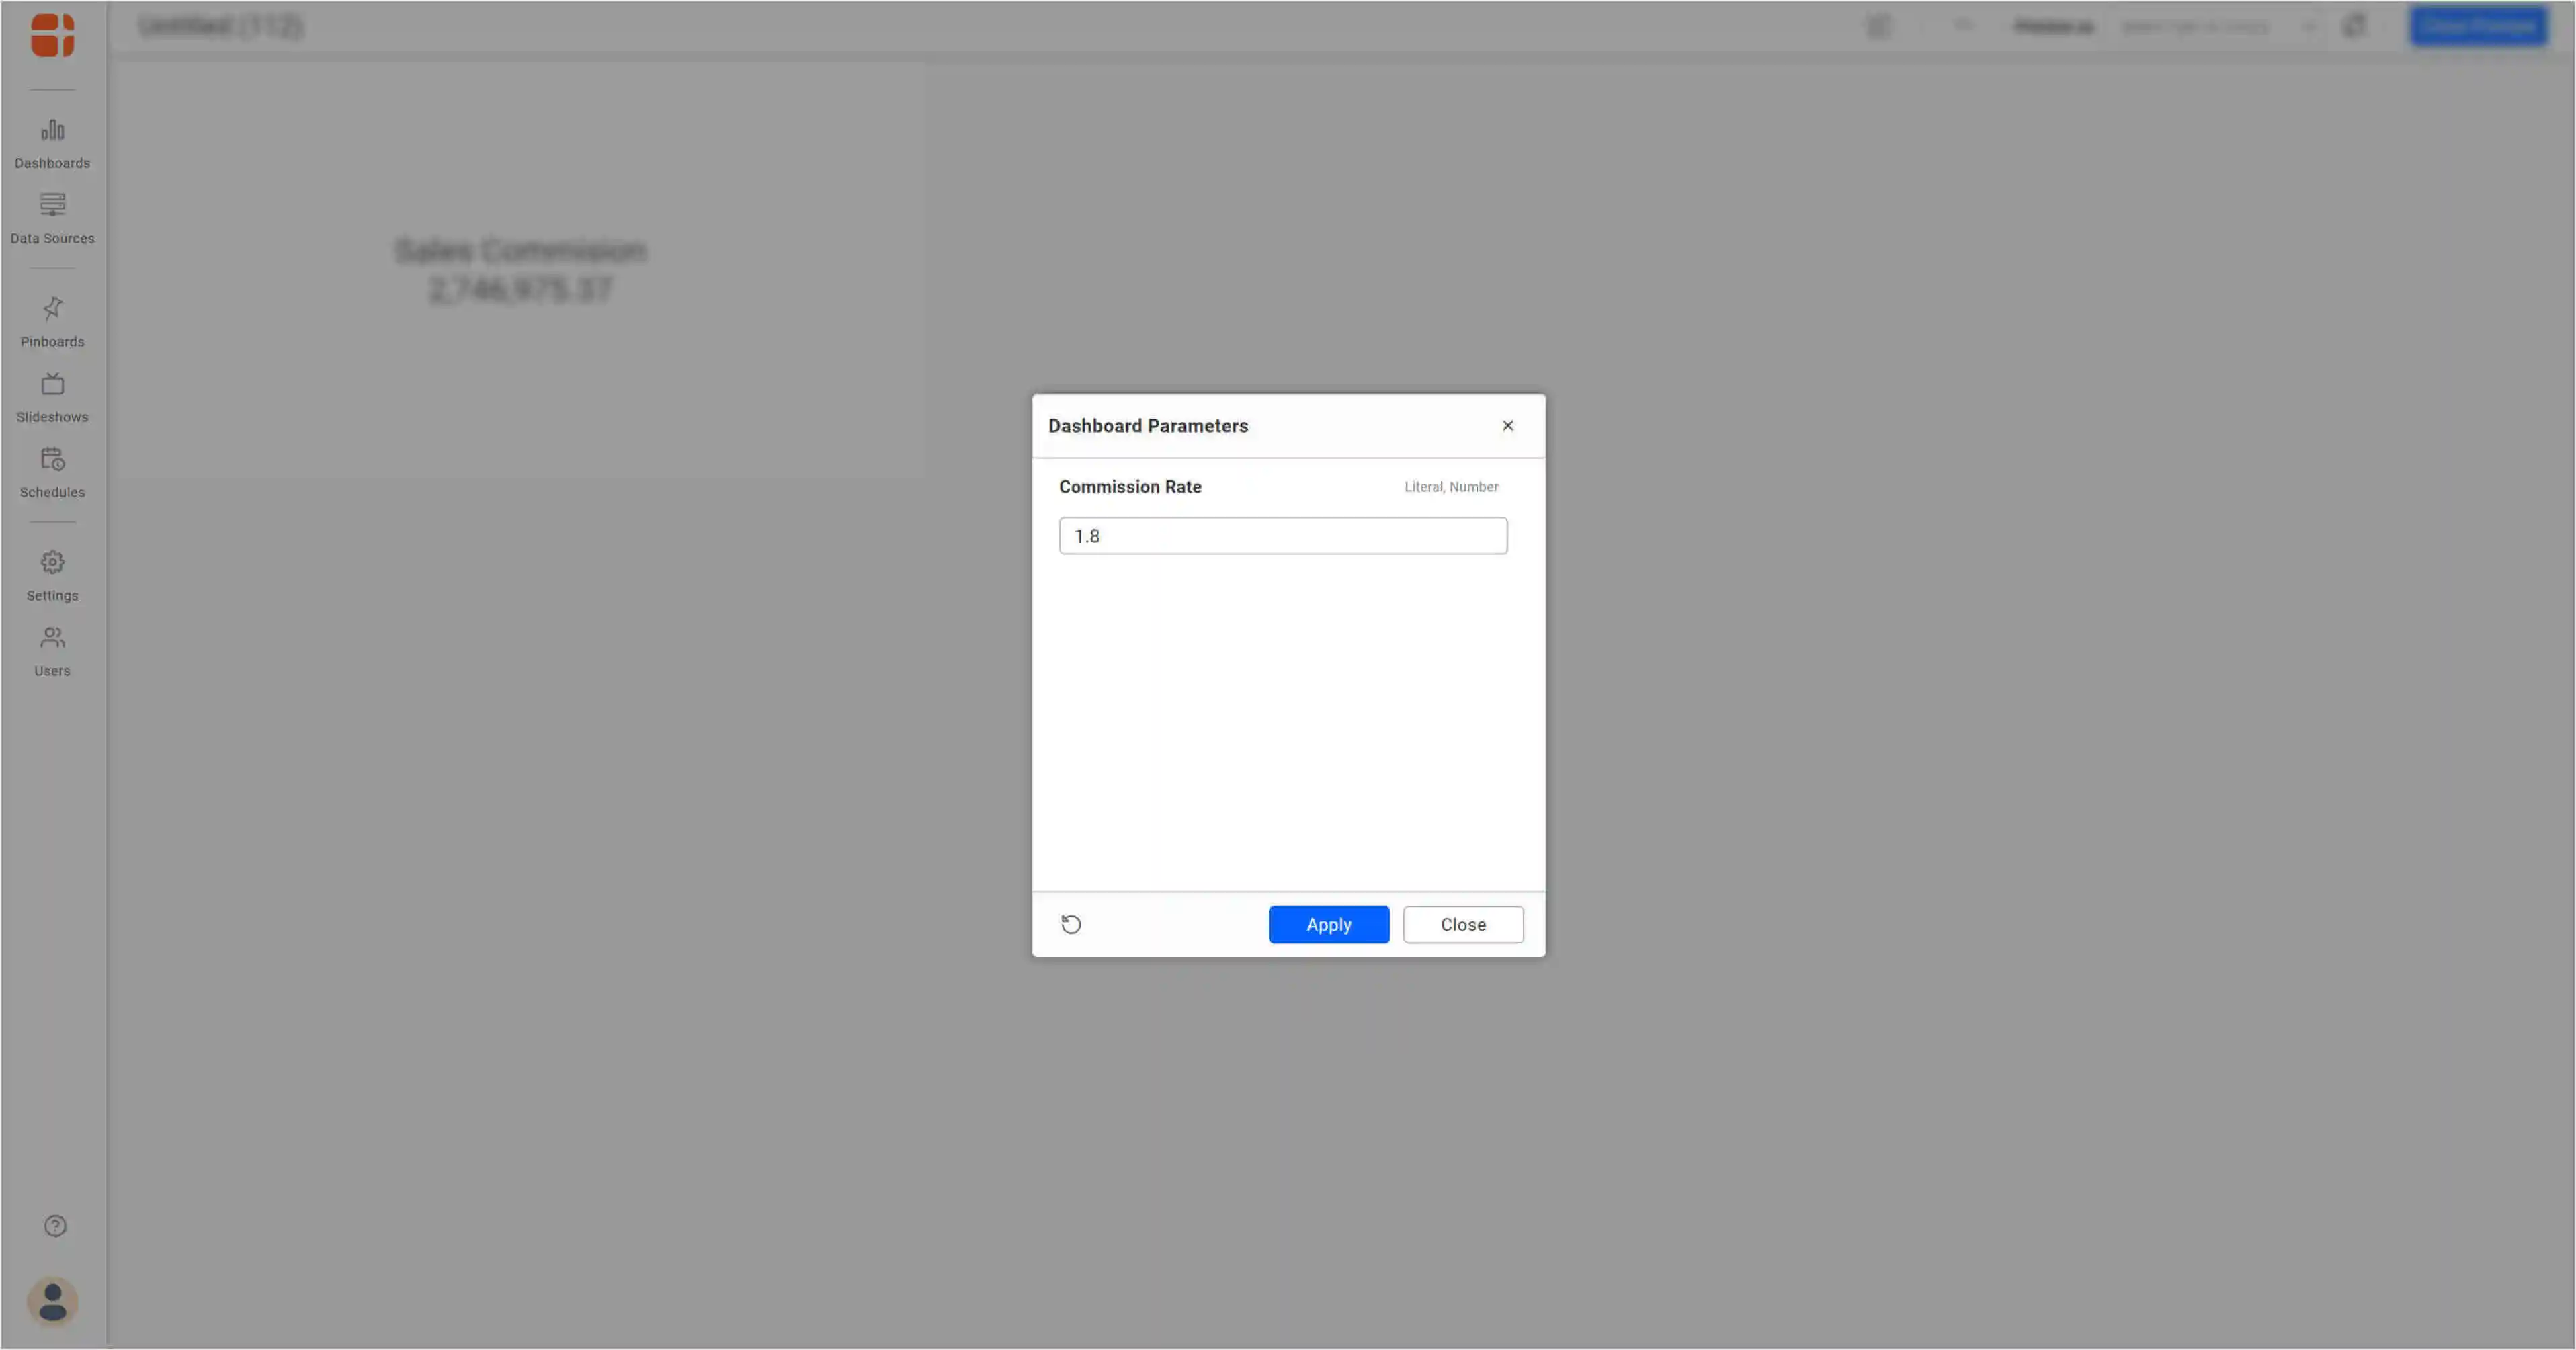
For example, a sales commission, which is now 2% of the total revenue of a company, can later be changed to a higher or lower value. The following image shows an expression field used to calculate the sales commission.
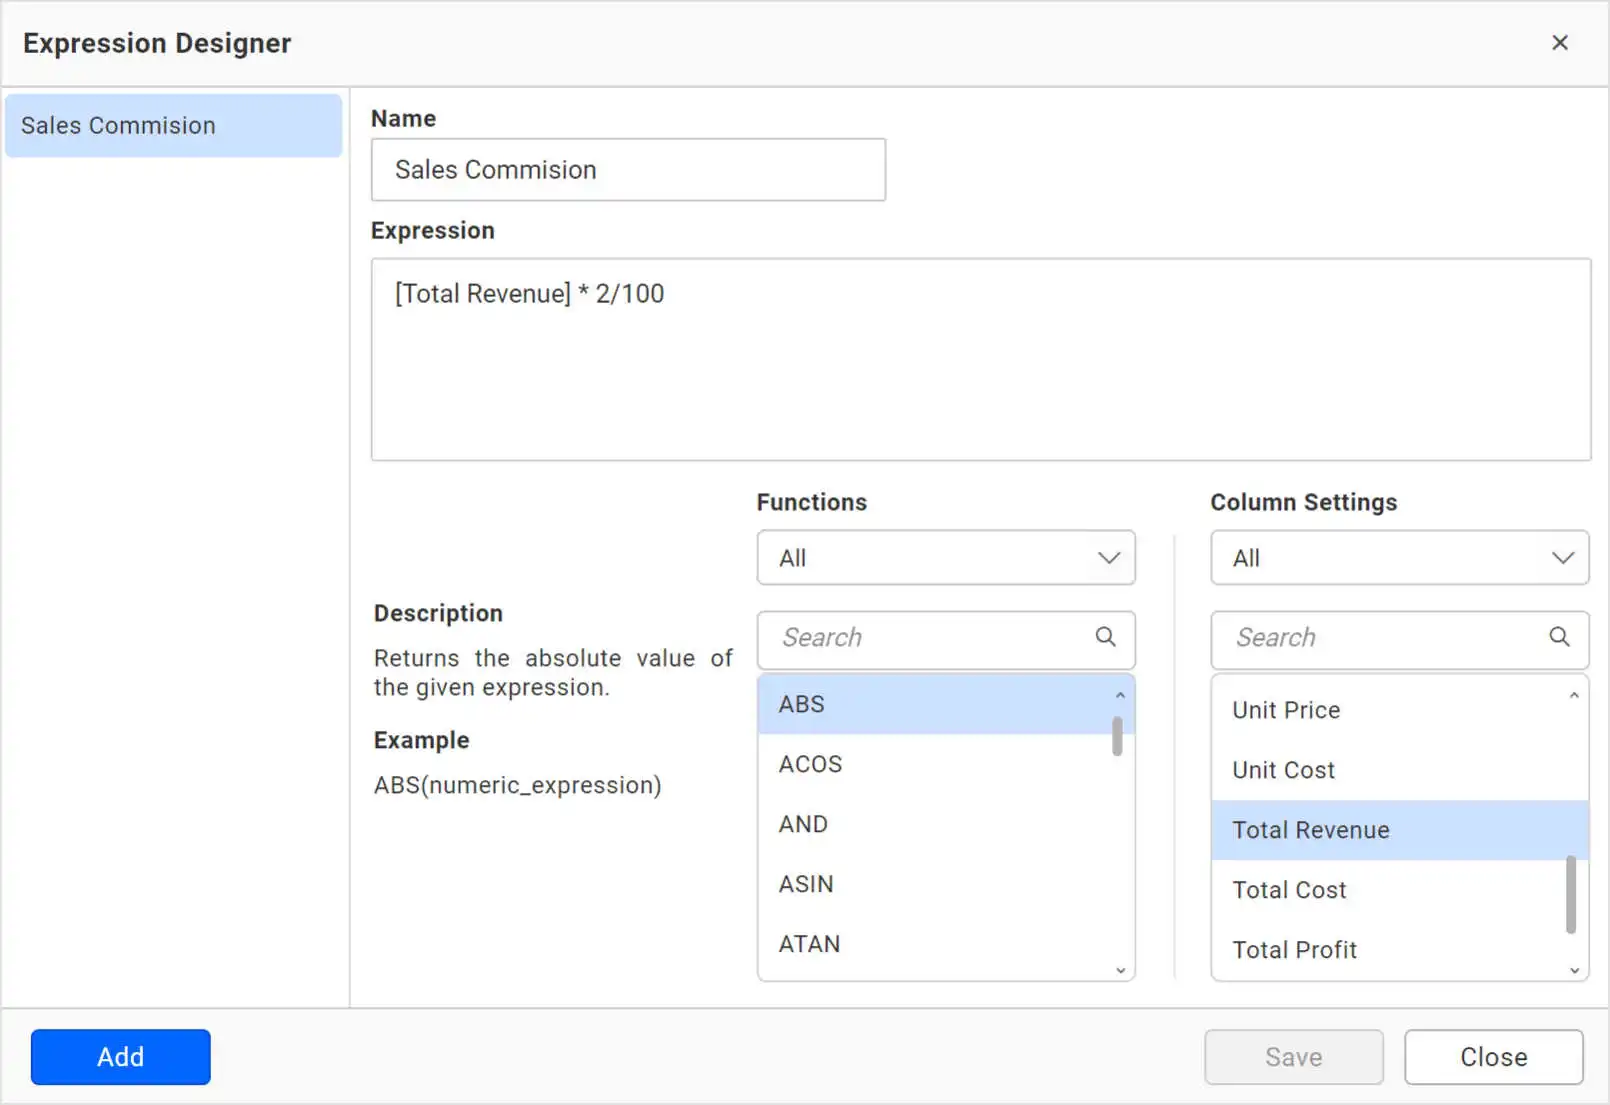
Now, instead of hard-coding the 2%, we can insert a parameter whose default value is 2%.
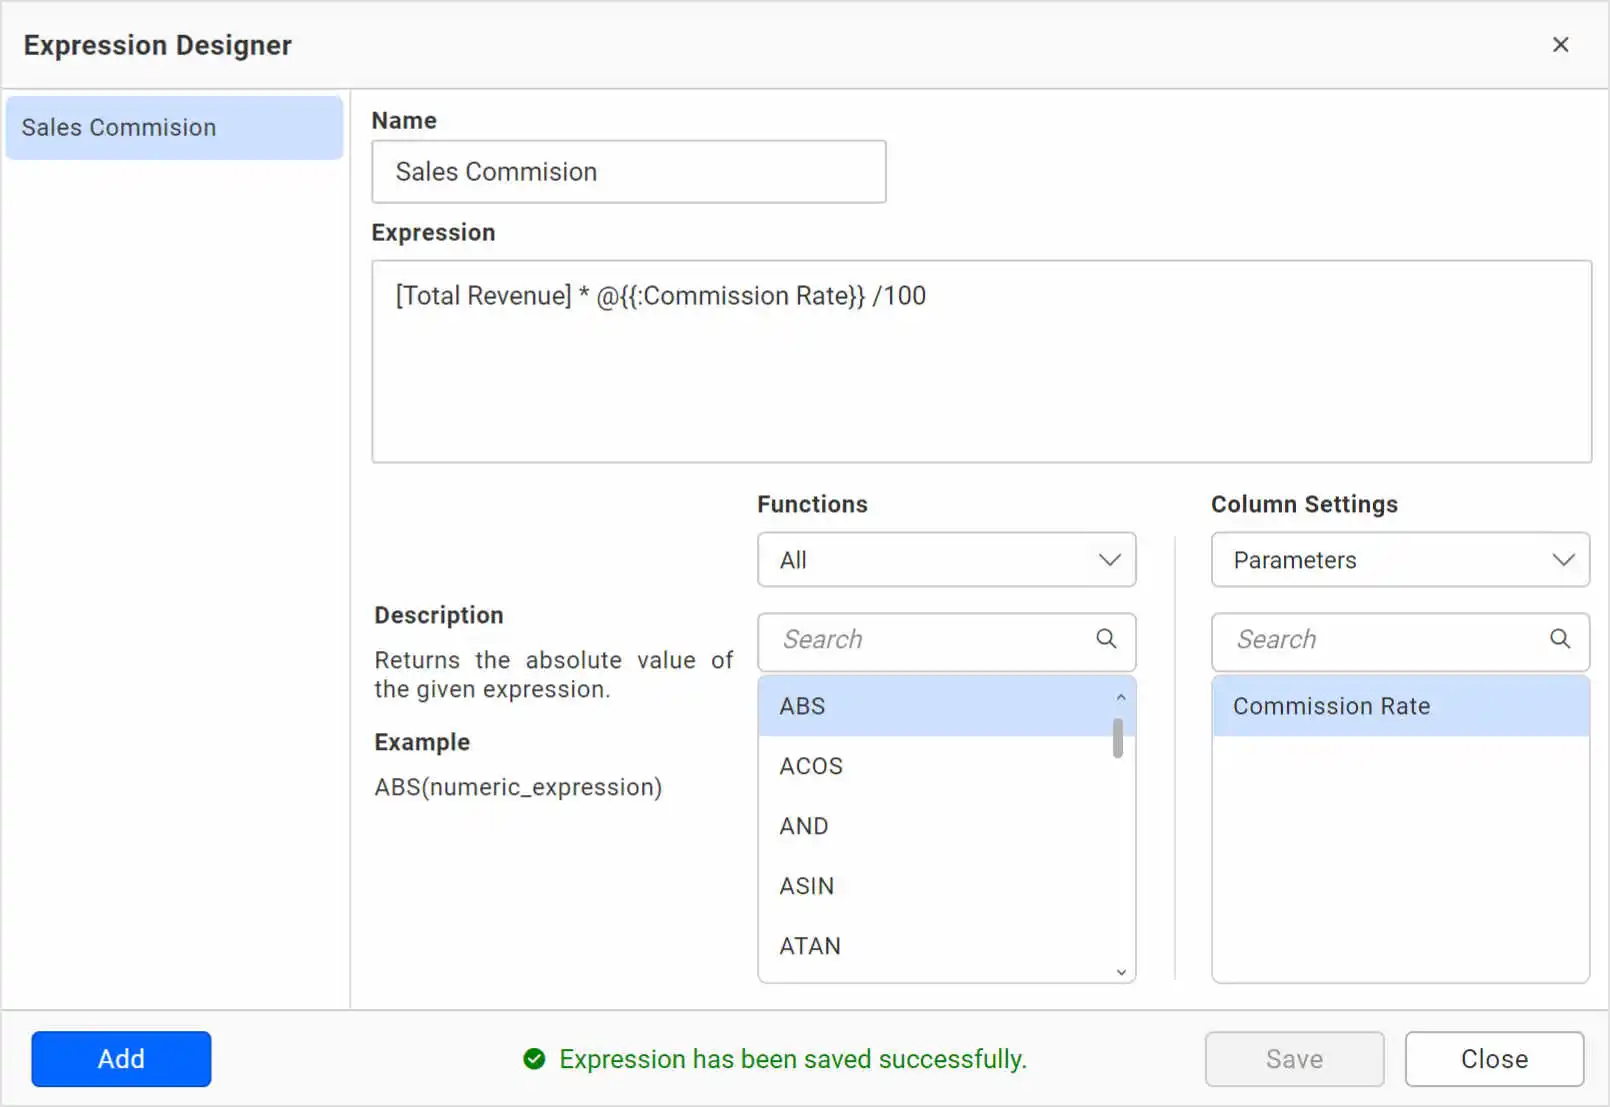
This parameter can be modified in the dashboard viewer to analyze what happens to the commission amount when the rate is increased or decreased.
Conditional formatting
Parameters can be used in combination with expressions to apply conditional formatting in widgets.
For example, I have a widget that shows a website bounce rate by month.
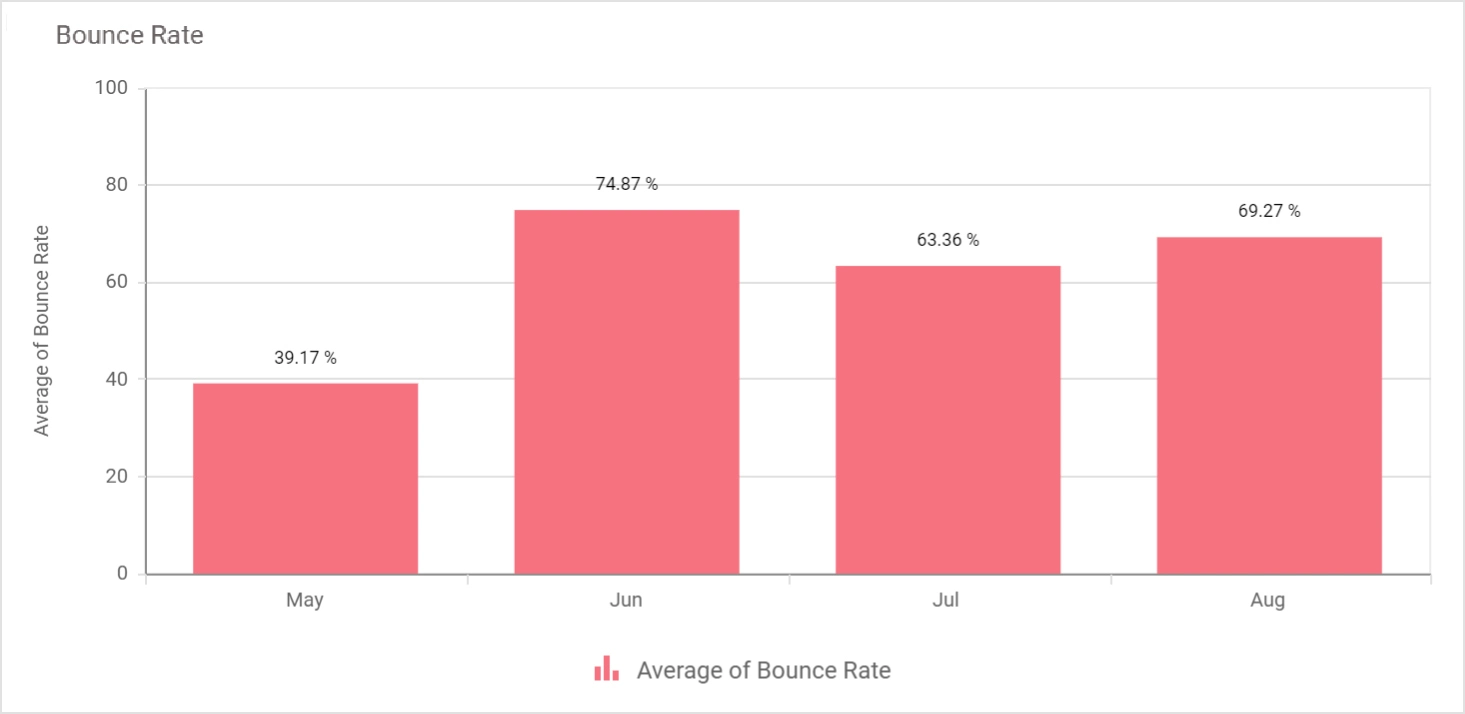
If I consider the bounce rate to be a safe zone between 40%– 65%, I can color-code the visualization:
<40% ~ Green
40% – 65 % ~ Yellow
>65% ~ Red
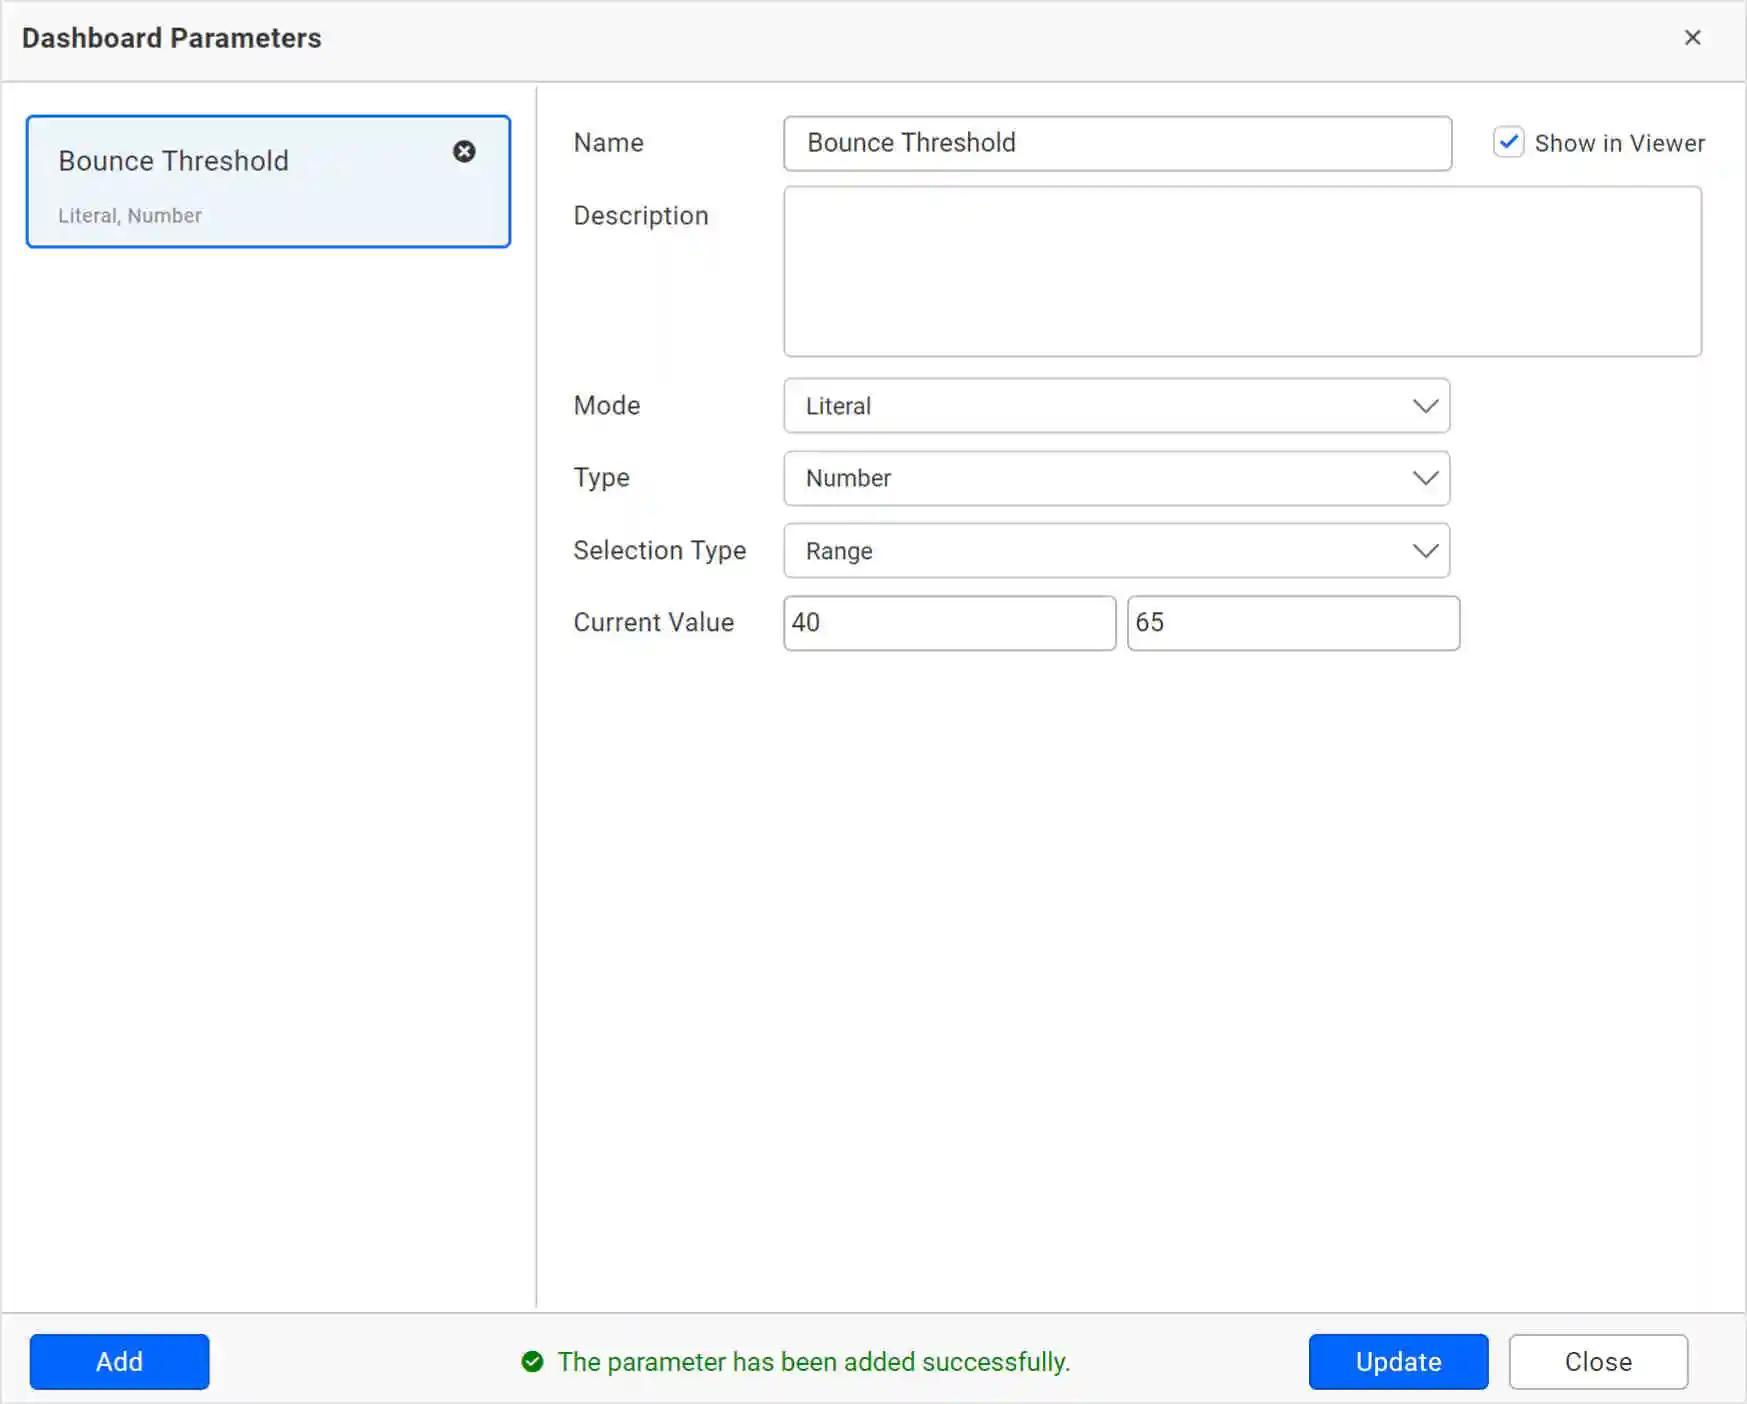
However, this threshold may change over time and you may want to change this from 40–65% to 30–40%. Now, instead of re-editing and changing the values everywhere in the dashboard, parameters can be used to change the threshold value on the fly and modify the colors accordingly. The following image shows the creation a dashboard parameter with a numeric range for the bounce rate.
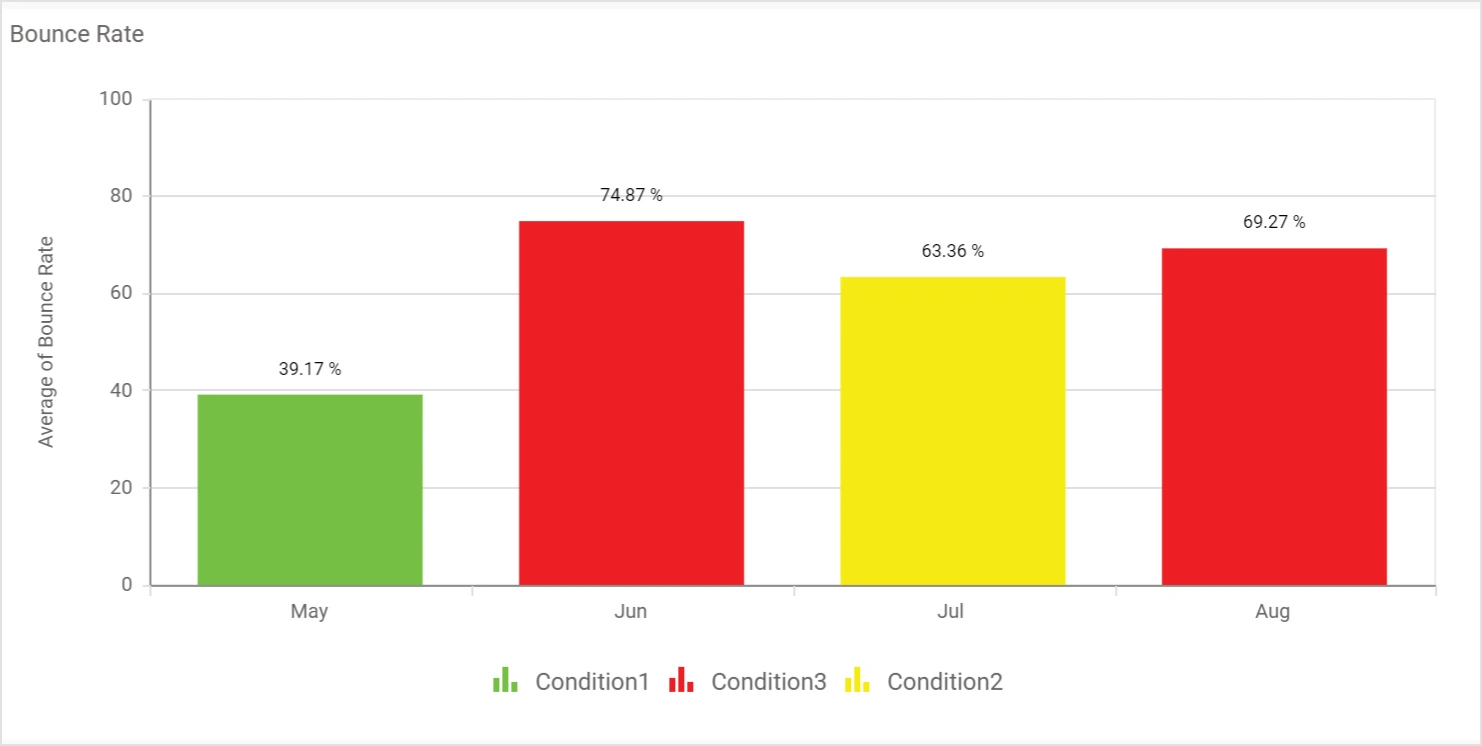
This parameter can be used in the expression to build a color. The numbers 0,1, and 2 represents green, yellow, and red, respectively.
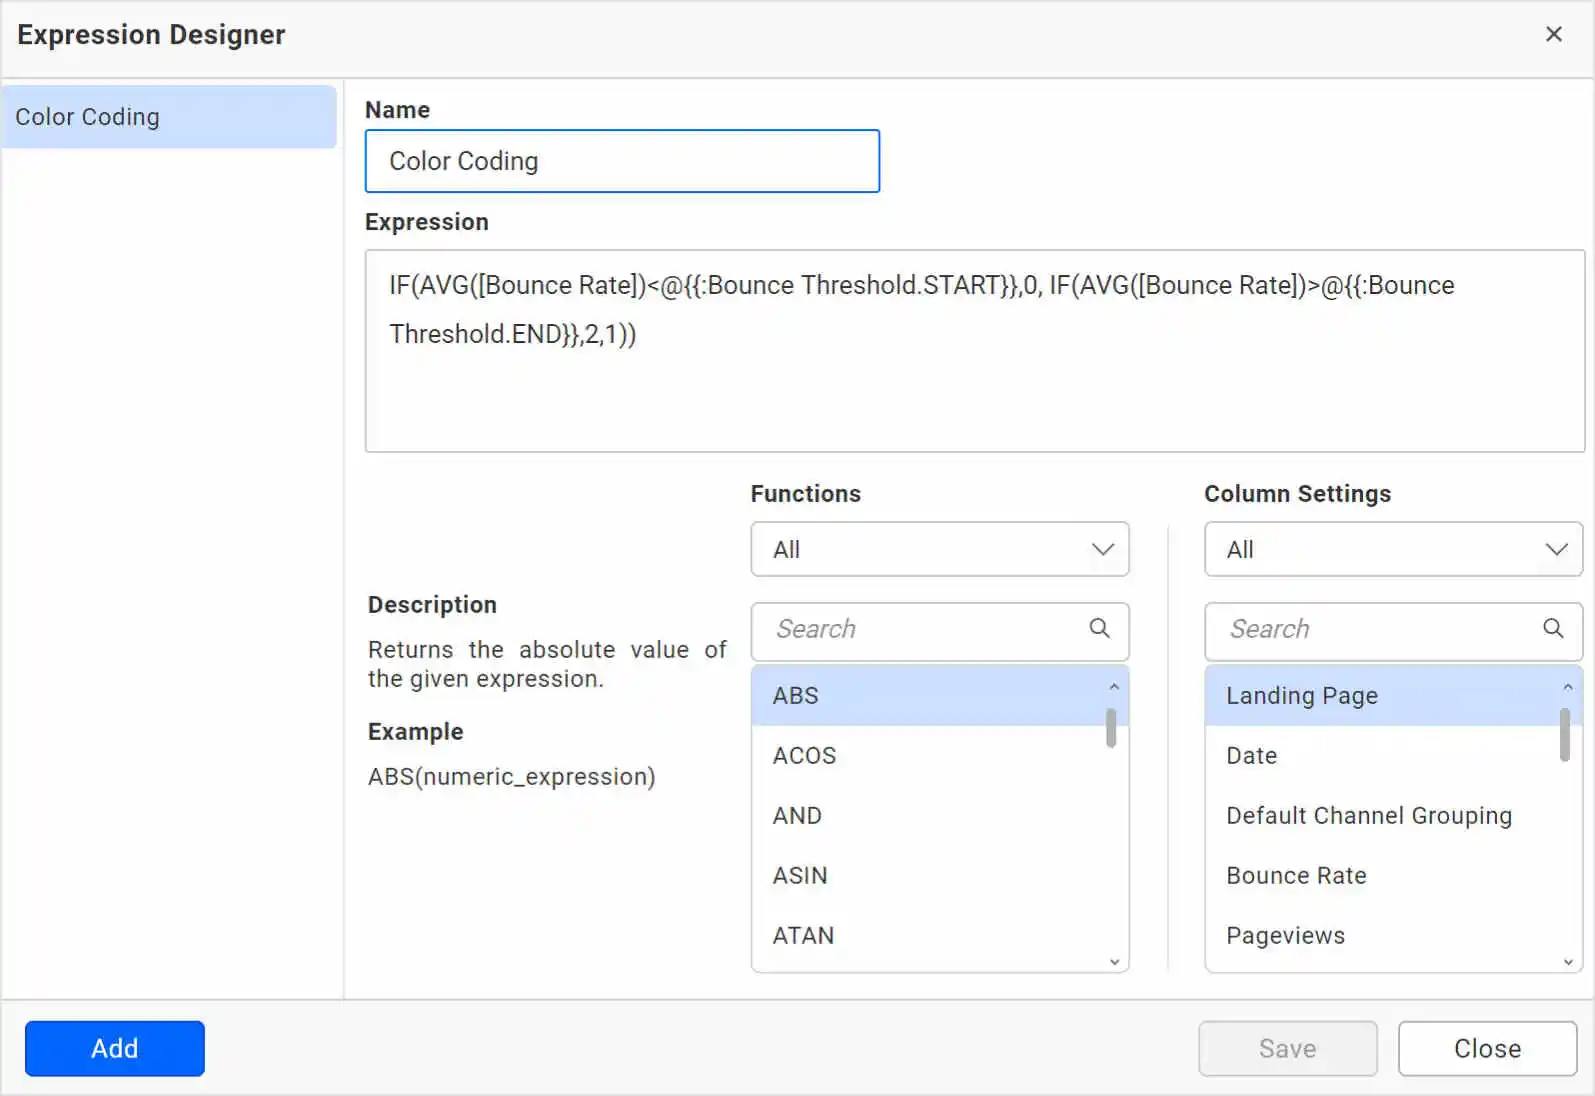
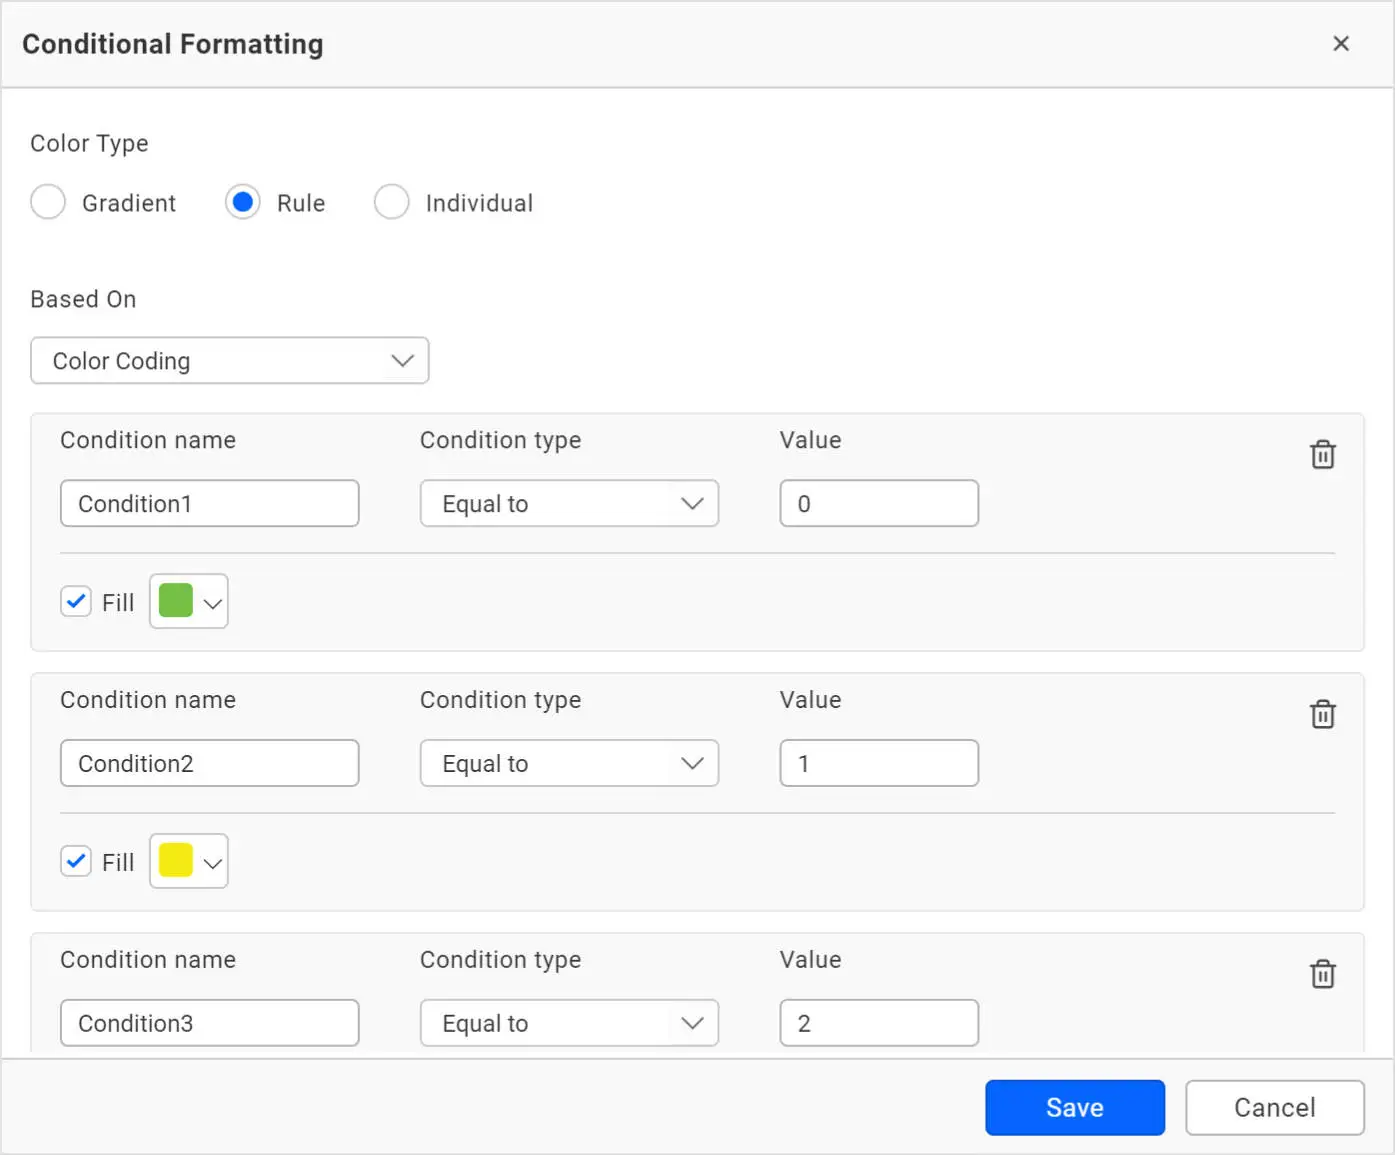
The expression field is then used in the conditional formatting.
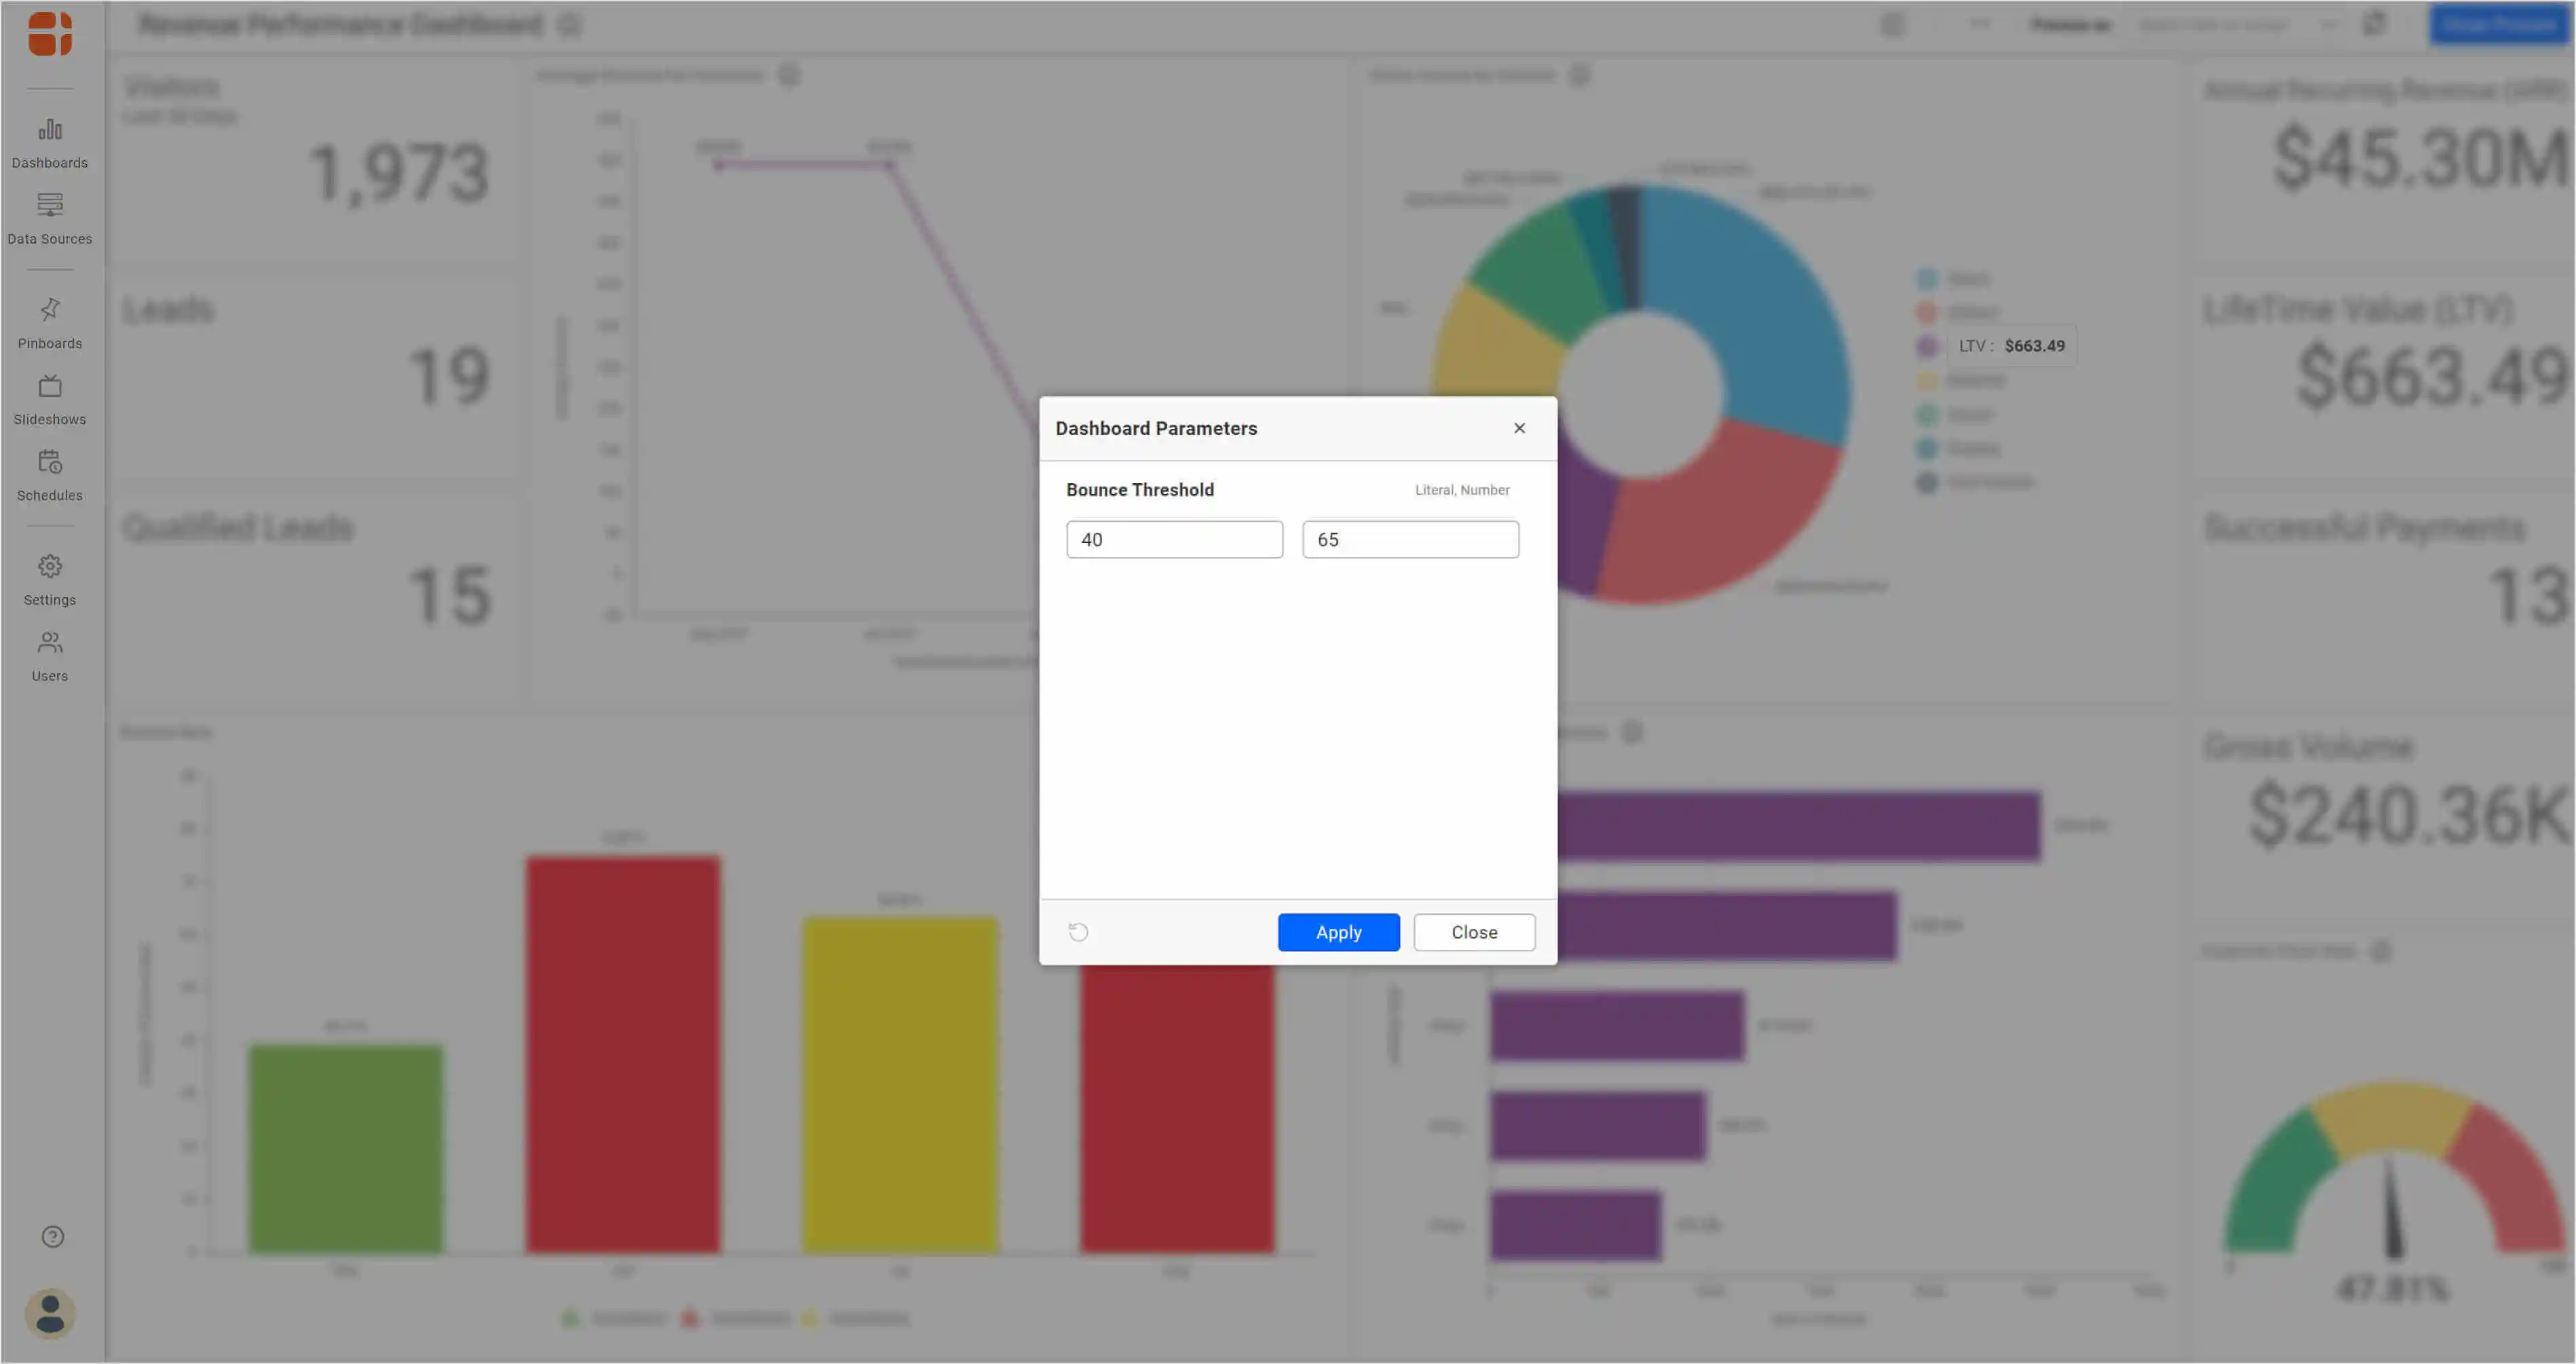
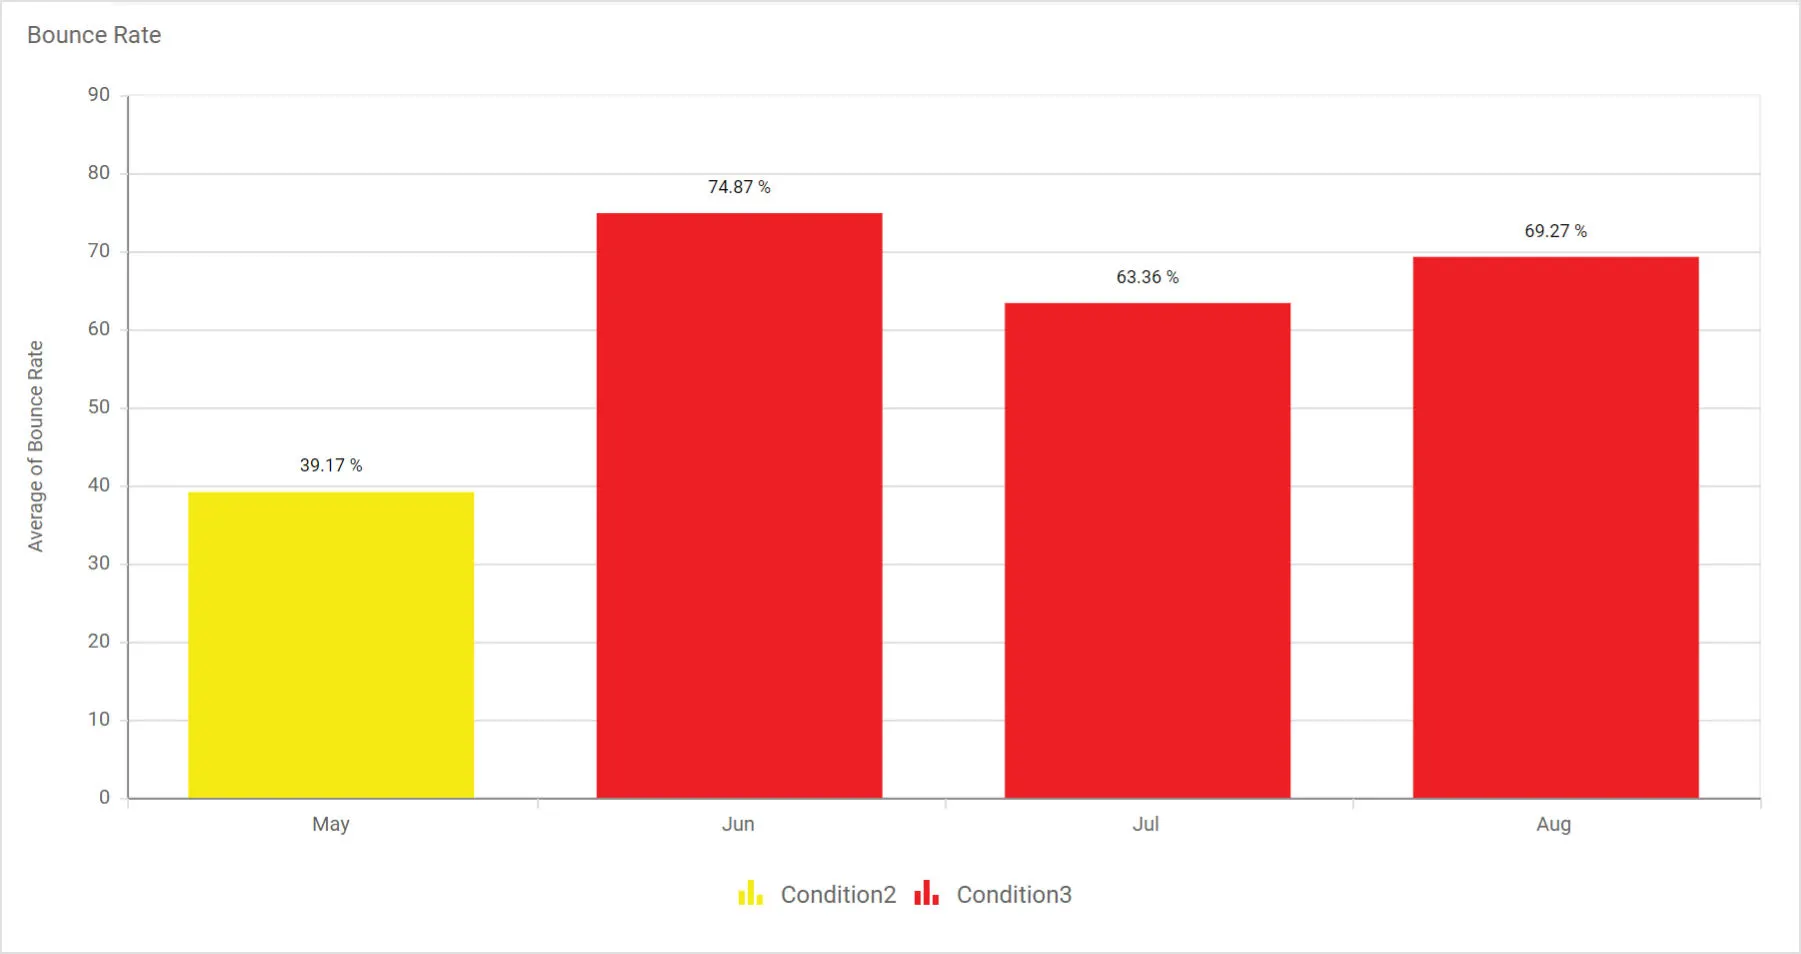
The following images show how the parameter is dynamically changed in the viewer and the color changes in the widget accordingly.
User-based data access
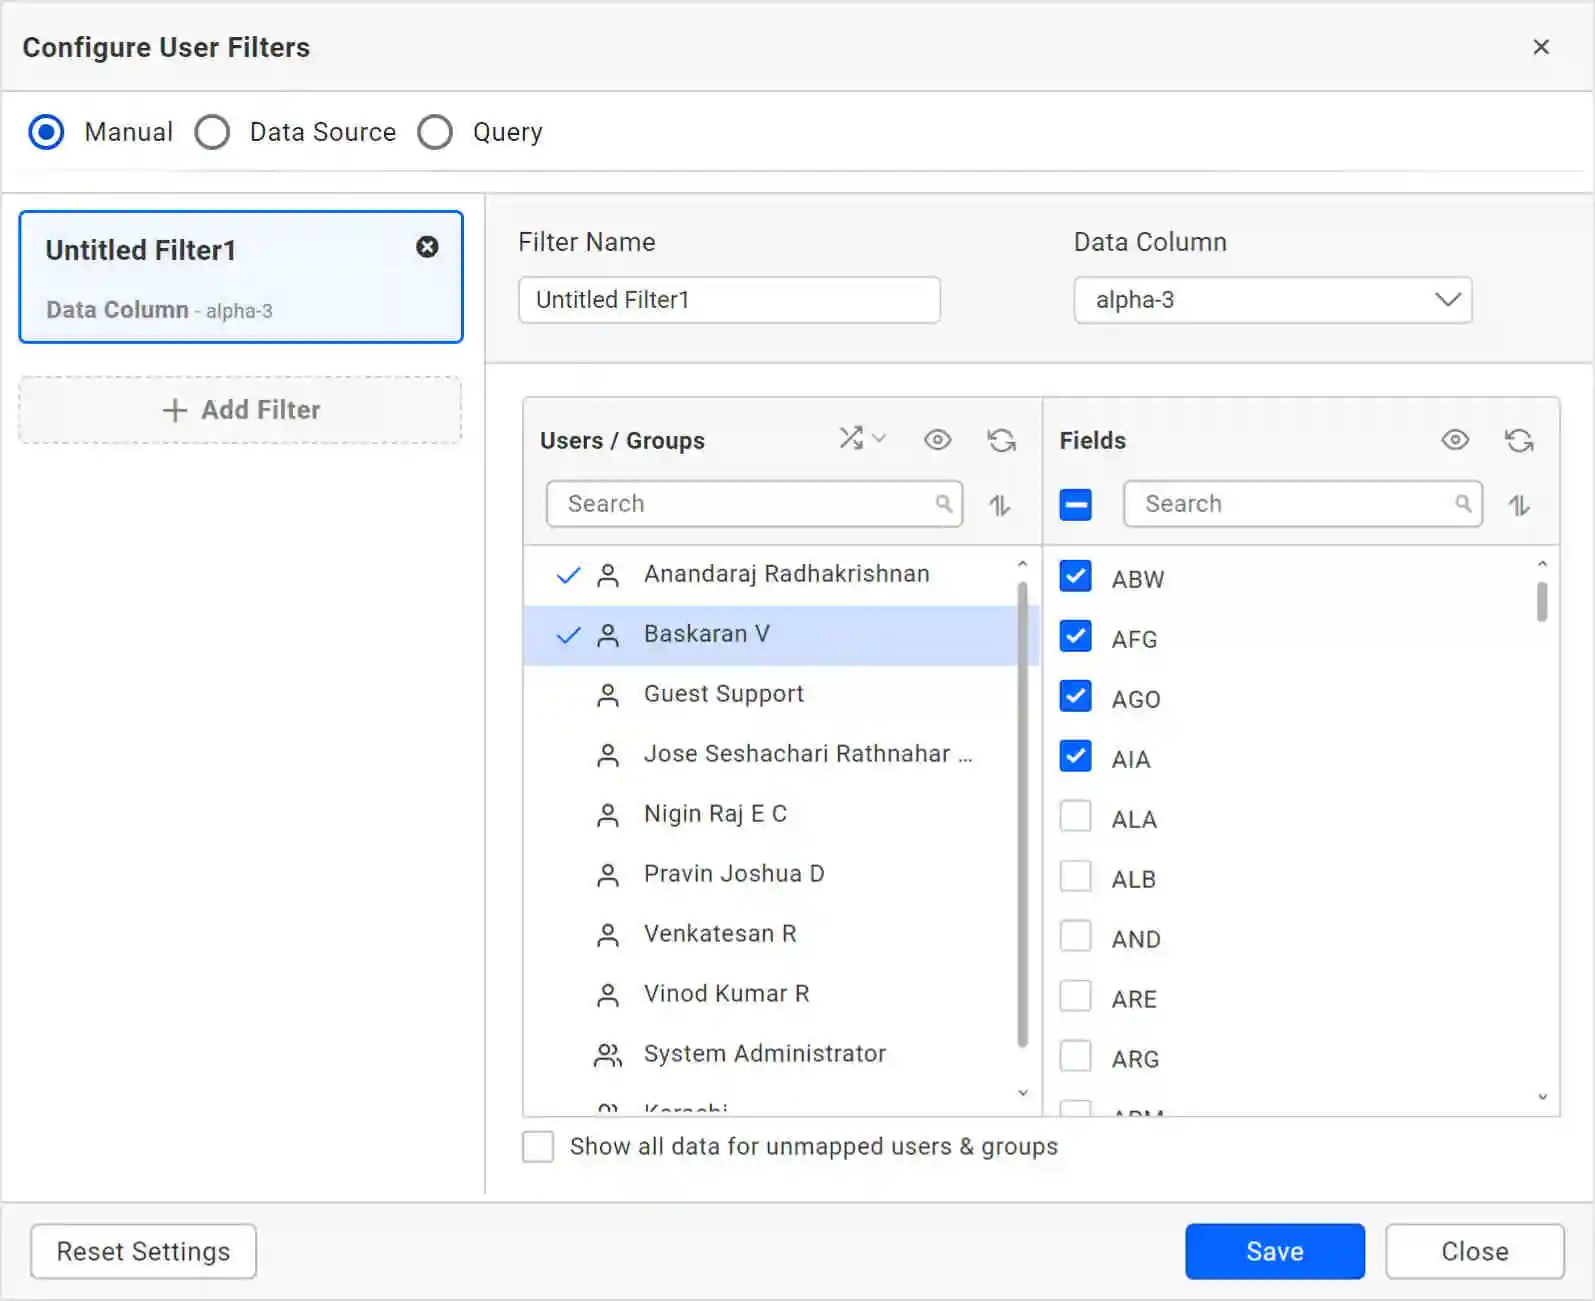
Parameter values can be restricted or assigned based on the logged-in user. This can be achieved when you import a list of parameter values from an external data source.
The following image shows how the column values of an external data source are mapped, which in turn will be applied as parameter values.
Conclusion
I hope this helped you in understanding how a dashboard can be made interactive and dynamic using parameters. We are looking forward to including parameters in more use cases, such as filtering and top N calculations, in the future.
Get started with Bold BI® by signing up for a free trial and create more interactive business intelligence dashboards. If you have any questions on this blog, please feel free to post them in the following comment section. You can also contact us by submitting your questions through the Bold BI website or, if you already have an account, you can log in to submit your support question.


