


Managing a company requires cooperation from every department, but the critical unit is the finance department, where most operations occur. Monitoring financial expenses has become a challenge for proper budgeting and running of the business.
Using a “profit and loss” dashboard in your daily operation provides managers with insight into the company’s financial status. With such insight into the business’ income and expenses, managers can predict trends and plan accordingly. This blog will highlight the following areas so you understand how to use Bold BI® as your operational application.
- What is embedded analytics?
- Benefits of embedded analytics in a “profit and loss” dashboard
- Bold BI’s profit and loss dashboard example
- How to embed analytical tools in financial domain apps
What is embedded analytics?
Embedded analytics includes integrating analytical solutions and data visualization capabilities into a software application’s user interface to improve data comprehension and usability. Bold BI helps you easily embed an analytics solution into your everyday work application using a JavaScript SDK and a server application. It also reduces dependency on IT teams and delivers all the insight you need to improve organizational and workforce outcomes.
Benefits of embedded analytics in a “profit and loss” dashboard
Embedded analytics provides the eyesight to manage your company’s financial expenditures, which enables you to easily run and monitor your business. In this section, I will take you through some of the key benefits of applying embedded analytics in your application. They include:
Customer growth

Customers are prominent in income generation. Embedded analytics helps a finance team track key KPIs such as customer growth, revenue generating countries, and more. This insight helps the finance team see their progress and where to work to attract more customers. It also enables team members to know their customers from different parts of the world and increase those customers by providing better quality services. This leads to improvement and expansion, as satisfied customers will market your business.
Increased net income

Using embedded analytics in your financial department helps you track key metrics such as income and expenses, net profit margin, accounts payable turnover, days sales outstanding, interest coverage, overall profit margin, and more. This helps managers see the outcome of the input they put into the business. By learning these metrics, they increase their performance in collaboration with other teams to increase their productivity for higher sales, increasing net income. This also helps them monitor their expenditure and cut costs in work redundancy, which increases the company’s interest coverage.
Accurate investment management

Embedded analytics helps managers track key metrics and KPIs such as working capital, earnings per share, selling, general and administrative ratio, budget creation cycle time, accounts receivable, and more. It enables the management team to easily plan and strategize business operations for better performance. By monitoring these metrics, managers can manage finance expenditure to improve revenue. It also enables them to create more markets for their products for higher profits, proving the significancy of the investment.
Better forecasting

Embedded analytics in your finance department helps team leads track key KPIs such as the top five expenses by category, revenue for the last six months, return on sales, sales growth, gross profit margin, and overall outstanding revenue. This allows team leads to better forecast monetary flow. Such insight guides a financial budget that reduces expenses and increases marketing to gain more profits. This will also help team leads manage and clear outstanding bills for better revenue.
Bold BI’s “profit and loss” dashboard example
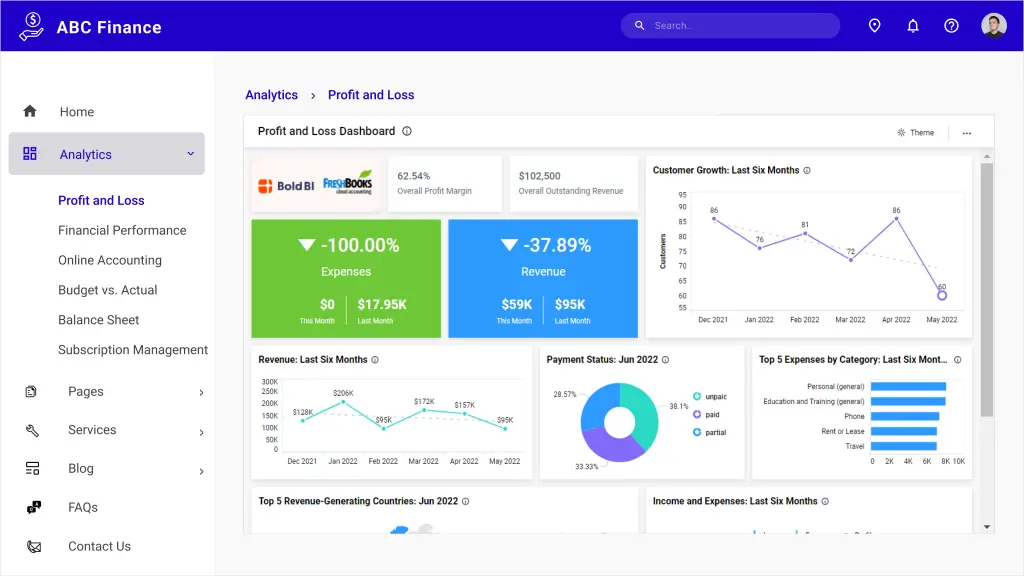
Embedding a FreshBooks “profit and Loss” dashboard provides a detailed view of business finances for analyzing revenue and expenses, customer growth, and payment status.
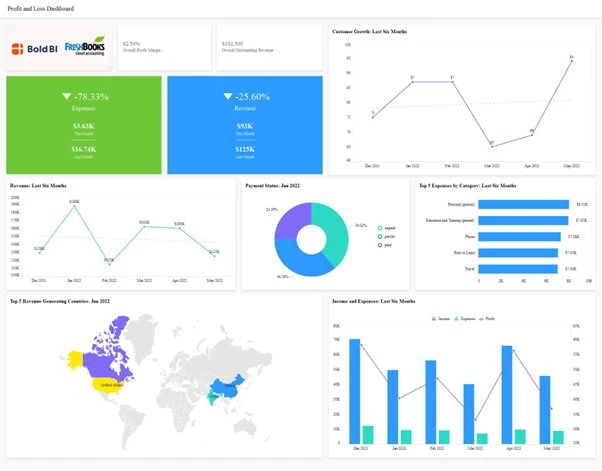
The following metrics and KPIs are visualized in the dashboard:
- Overall profit margin
- Overall outstanding revenue
- Expenses
- Revenue
- Customer growth: last six months
- Revenue: last six months
- Payment status
- Top five expenses by category: last six months
- Top five revenue-generating countries
- Income and expenses: last six months
Overall profit margin

This card widget shows the percentage overall profit margin gained in a selected month. It gives a company’s net profit after expenditure and deductions are done.
Overall outstanding revenue

This card widget shows the overall outstanding revenue amount for a selected month. It indicates outstanding payments the organization needs to pay.
Expenses
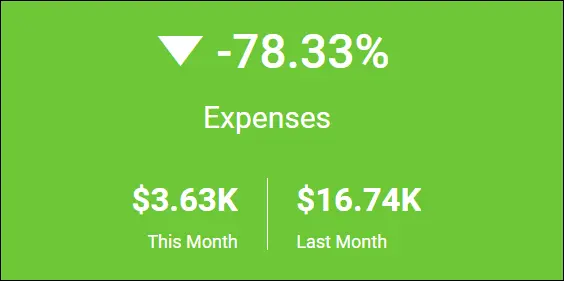
This number card shows expenses in percentage for previous and current months. It shows how a business is being run in terms of expenditure.
Revenue
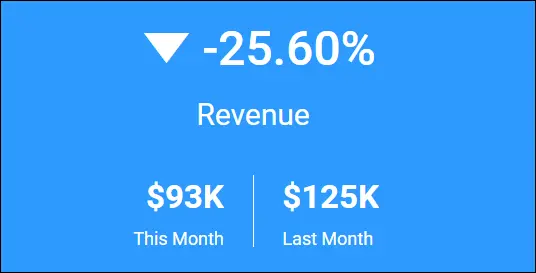
This number card shows revenue in percentage for previous and current months. It indicates the financial status of a company on a monthly basis.
Customer growth: last six months
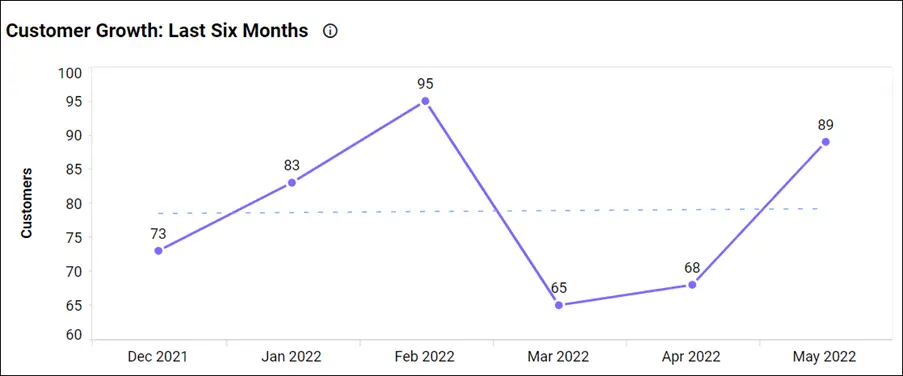
This line chart shows the analysis of the distribution of growth in the number of customers over six months. It helps team leads gain insight into their performance by observing trends and marking the months they have higher customers.
Revenue: last six months
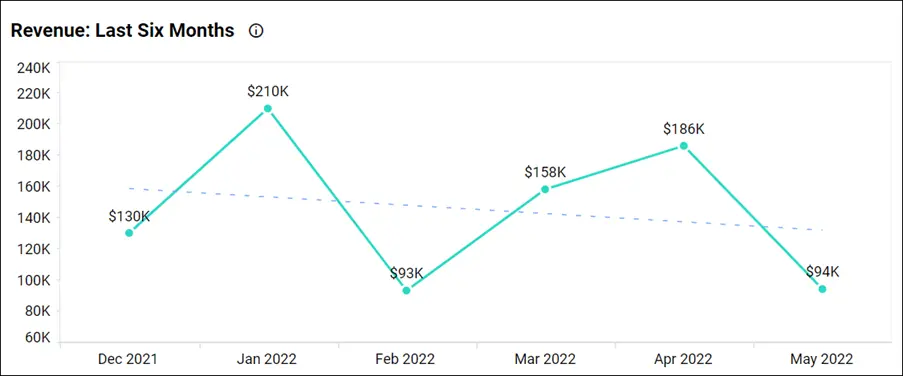
This line chart shows revenue for the last six months. This helps managers gain insight into monthly revenue, which enables them to invest wisely for higher returns.
Payment status
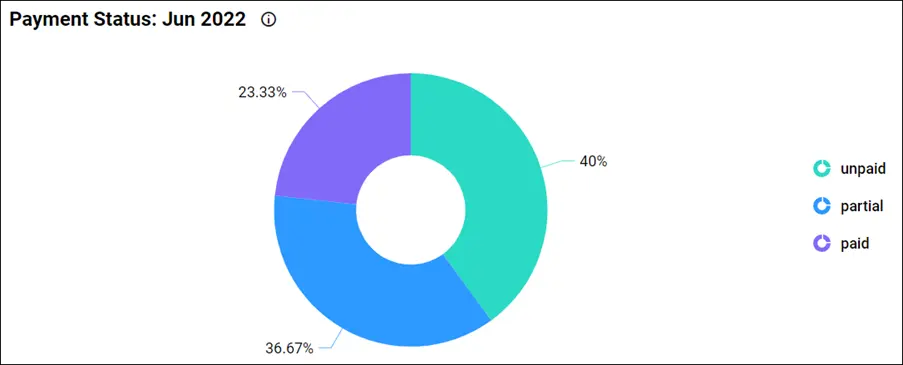
This doughnut chart tracks payment statuses for the current month: paid, unpaid, and partially paid. This helps the administration know the status of their payments and work to clear outstanding payments in time.
Top five expenses by category: last six months
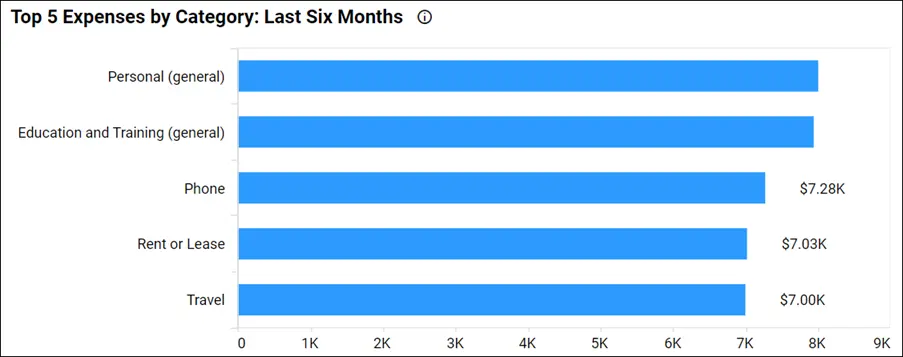
This bar graph shows the largest expenses based on category. This helps the finance team have all the data on their expenses, enabling them to predict and create a proper plan for the following budget period.
Top five revenue-generating countries
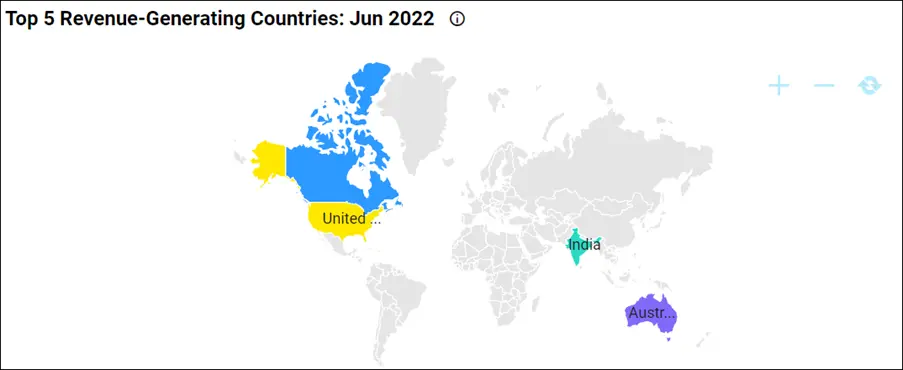
This map chart shows highlighted countries that generated the most revenue. This help the sales team know where their customers come from and market products to those countires.
Income and expenses: last six months
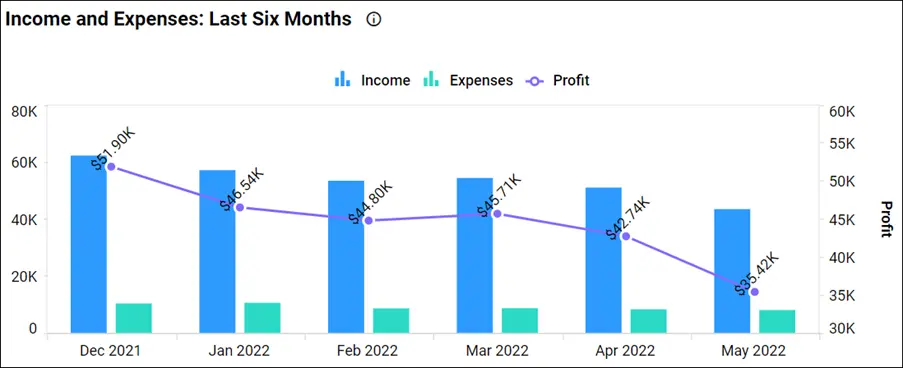
This combo chart shows income, expenses, and profit for the last six months. This helps stakeholders observe how a company is progressing monthly. It also lets them see the interest they gain by putting more capital into developing other sectors to improve operations.
To learn more about the metrics and KPIs used in this dashboard example, refer to the Profit and Loss Dashboard demo.
You can learn key accounting and financial metrics in FreshBooks and monitor them through a Bold BI dashboard to improve your business. Also, you can explore how to fetch FreshBooks data and create a FreshBooks dashboard through a built-in dashboard template. To learn more, refer to this link: Key Metrics for Your Business Growth with FreshBooks.
How to embed analytical tools in financial domain apps
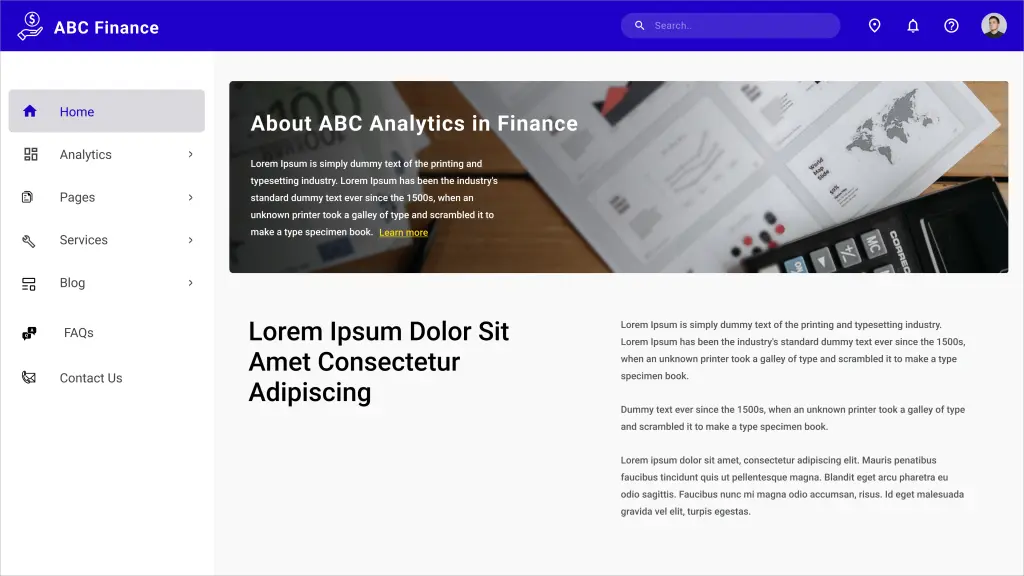
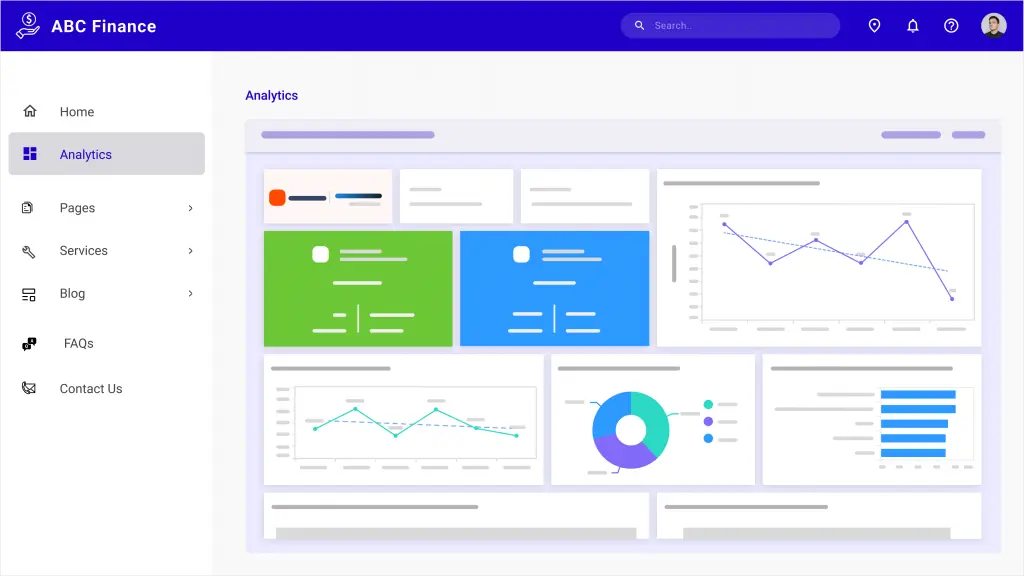
Let’s see how analytics can be embedded into finance web applications. Bold BI helps you embed dashboards in more than 18 web app platforms, including React with ASP.NET Core, React with Go, WinForms, Node.js, Vue with Go, Vue with ASP.NET Core, and more. In the remainder of this blog, I am going to explain how to embed dashboards into your Angular applications. Consider a scenario where your finance department has a website like the one shown in the following image.
Prerequisites
Download and install the Bold BI server in your local machine and create a dashboard. You can find the installation and deployment steps here.
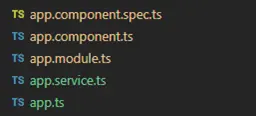
Step 1: Create an Angular application.
To successfully embed a dashboard in your application, you first need to create an Angular application. Create a new Angular project in Visual Studio Code and add the necessary TS files to the project as shown in the following image.
For more guidance, refer to the sample code in the Bold BI documentation.
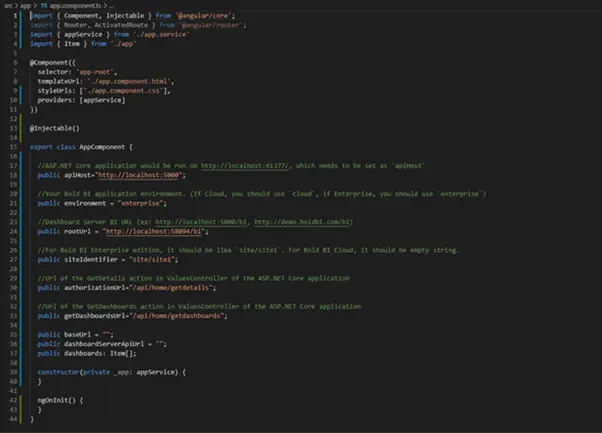
In this demonstration, the Angular application acts as a client, and an ASP.NET Core application acts as a server. You need to add several properties in the app.component.ts file as shown in the following table and screenshot.
| Properties | Property Value Descriptions |
| RootUrl | Bold BI dashboard server URL. For example: https://localhost:5000/bi, |
| SiteIdentifier | For Bold BI, it should be something like “site/site1.”For Bold BI Cloud Analytics Server, it should be an empty string. |
| Environment | Your Bold BI application environment.If using Bold BI Cloud Analytics Server, you should use “cloud.” If using Bold BI, you should use “enterprise.” |
| User Email | The Bold BI server will use an email address to authorize the authorization server. |
import { Component, Injectable } from '@angular/core';
import { Router, ActivatedRoute } from '@angular/router';
import { appService } from './app.service';
import { Item } from './app';

@Component({
    selector: 'app-root',
    templateUrl: './app.component.html',
    styleUrls: ['./app.component.css'],
    providers: [appService]
})

@Injectable()

export class AppComponent {

    //ASP.NET Core application would be run on http://localhost:61777/, which needs to be set as "apiHost"
    public apiHost = "http://localhost:5000";

    //Dashboard Server BI URL (ex: http://localhost:5000/, https://demo.boldbi.com/bi/)
    public rootUrl = "http://localhost:5000/bi";

    //For Bold BI Enterprise edition, it should be like 'site/site'. For Bold BI Cloud, it should be empty string.
    public siteIdentifier = "site/site1";

    //Url of the GetDetails action in ValuesController of the ASP.NET Core application
    public authorizationUrl = "/api/home/getdetails";

    //Url of the GetDashboards action in ValuesController of the ASP.NET Core application
    public getDashboardUrl = "/api/home/getdashboards";
    public baseUrl = "";
    public dashboardServerApiUrl = "";
    public dashboards: Item[];
    constructor(private _app: appService) {
    }
    ngOnInit() {
    }
}
After adding these properties, we need to create the Bold BI instance.
Step 2: Create a Bold BI instance.
After the Angular web application is created, you need to create a Bold BI instance to communicate between the server side (any web application) and the client side (Angular application), which allows us to embed a Bold BI dashboard in the Angular application.
Step 3: Create an authorization server to authenticate the Bold BI server.
Every application that embeds a Bold BI dashboard or widget must be authorized with the Bold BI server. This authentication step requires sending confidential information to the Bold BI server, such as users’ email addresses, group data, and embed signatures. So, in your server application, implement this authentication flow and provide the URL for connecting to your server in the Bold BI instance.
Step 4: Run the Angular application to view the embedded dashboard.
In the Angular application, update the authorization URL and dashboard URL that were defined in the ASP.NET Core application. Finally, you can see that the dashboard created in the Bold BI server is embedded in your web application.
By following the previous steps, you can successfully embed your dashboard into your Angular application.
To learn more about embedding dashboards into your Angular applications, refer to this blog. You can also download the sample code used in the previous steps from our documentation.
Conclusions
Bold BI® helps you integrate dashboards in your applications written in ASP.NET Core, ASP.NET MVC, Angular, ASP.NET, and Ruby on Rails. It will save you time and prevent you from doing redundant work. Click this link to explore its features. To learn more about embedding dashboards into your applications, refer to this blog and our help documentation.
I hope you now have a better understanding of Bold BI and how it can help profit and loss in a finance department. You can create any kind of dashboard you like with Bold BI’s 35+ widgets and 150+ data sources.
Get started with Bold BI by signing up for a free trial and create interactive business intelligence dashboards. You can contact us by submitting questions through the Bold BI website or, if you already have an account, you can log in to submit your support questions.


