


We are excited to announce our June 2019 Bold BI® product update. This release brings several enhancements and new features to Bold BI widgets and data sources. These major changes and improvements provide you the best experience with Bold BI dashboards.
Here are the new updates:
Widget updates
- Choropleth and Bubble maps now support United States counties.
Data source updates
- Support for Excel tables with Microsoft Excel Open XML Format Spreadsheet file (.xlsx) format.
- Support for ServiceNow built-in template.
- Support for DateDiff expression and WITH query support.
In this blog, we will explore in detail the new features and enhancements for widgets and data sources in Bold BI.
Widget updates
US maps support in choropleth and bubble maps
We have added support for showing United States counties in our choropleth and bubble map widgets. The following figure is a sample dashboard that shows the population by county of Alabama, New York, Washington, and Montana.
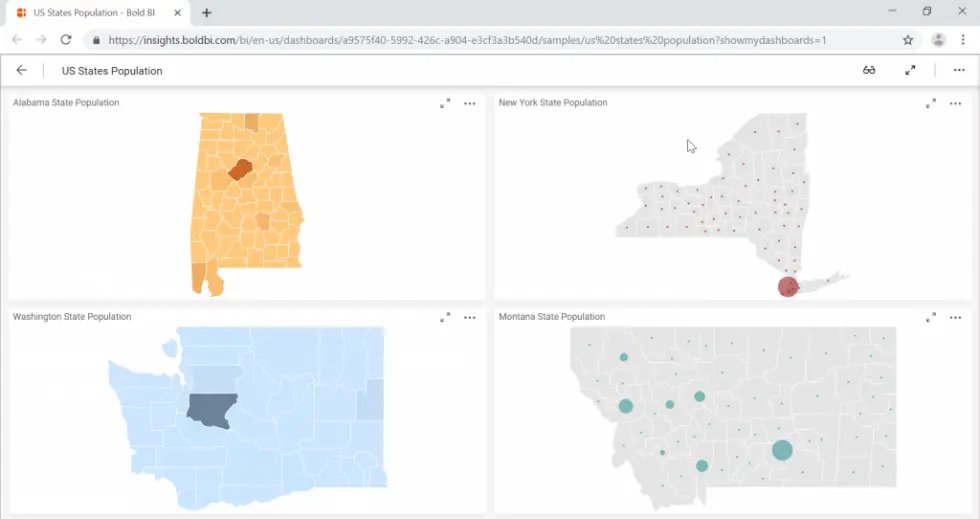
Previously, we had support only for continents, a worldwide map showing all countries, and a few maps of individual countries. Now we have added maps of all states and their counties in the US.
Data source updates
Table support in Excel data sources with .xlsx format
With Excel data sources, you can now import an entire spreadsheet or only selected tables into Bold BI. Once imported, you can explore the information and prepare dashboards to see the story that lives in your data.
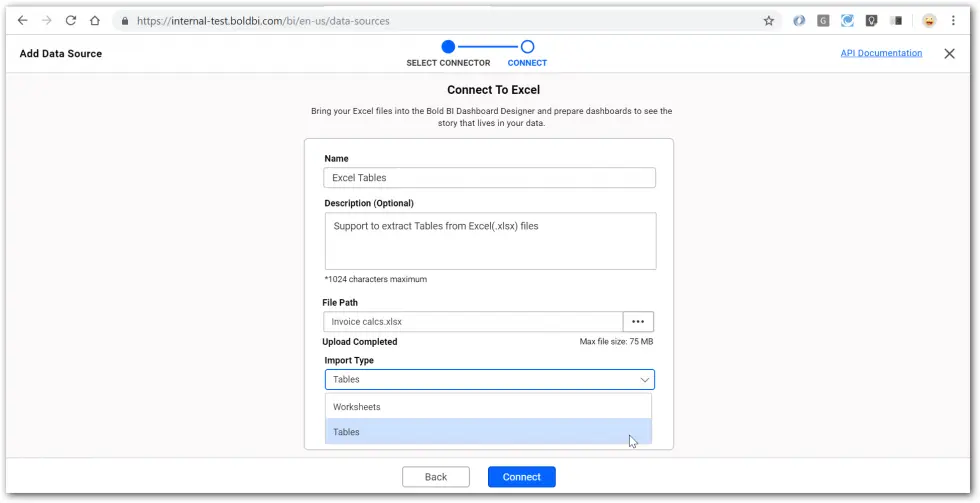
Previously, we had support only for importing an entire spreadsheet. Now, we support connecting Excel tables in Microsoft Excel Open XML Format Spreadsheet file (.xlsx) format.
ServiceNow built-in template support
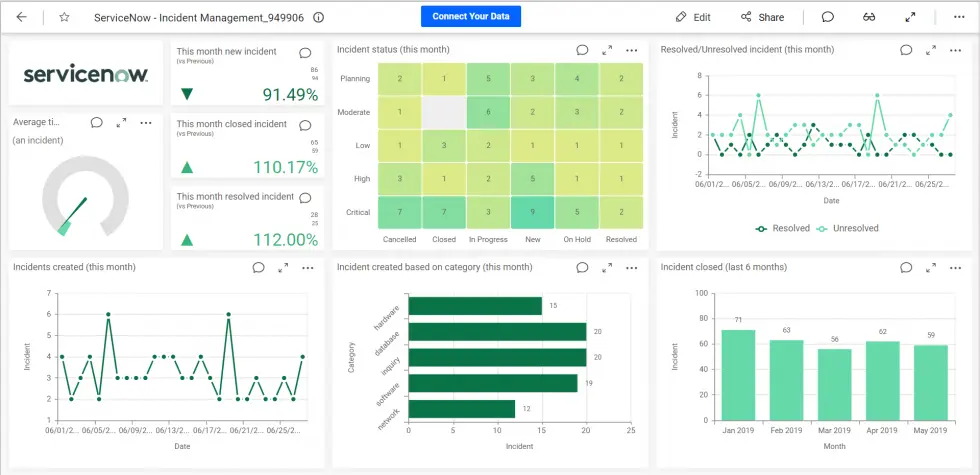
We have added support for the ServiceNow Web API in our built-in dashboard templates for quickly creating dashboards. You can connect your own ServiceNow data by updating your credentials and easily build a dashboard in just a few clicks.
The following image is a sample template dashboard that uses ServiceNow. The dashboard is used to monitor incident details over a period of time. It provides accurate information regarding average resolution time for an incident and the status of incidents based on category and priority.
DateDiff expression and WITH query support
The data source designer now supports the DateDiff expression and WITH clause for connecting with custom SQL queries.
DateDiff
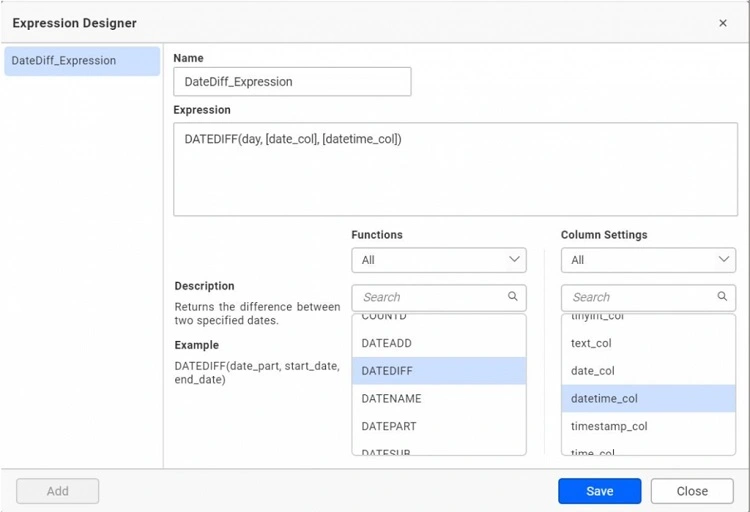
The DateDiff function has been included to return the difference between two specified dates. The following screenshot shows the Expression Designer supporting the DateDiff function.
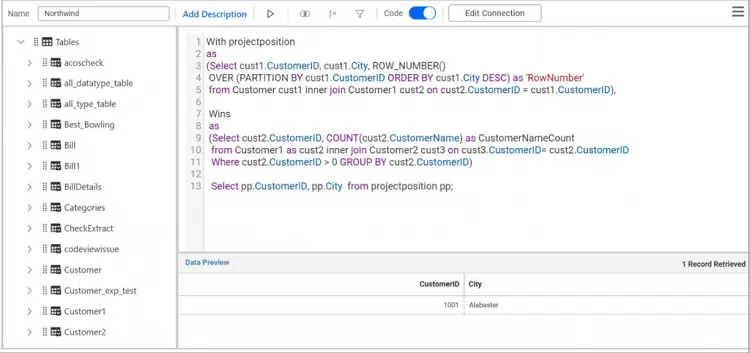
WITH clause in query
The WITH clause in custom SQL code provides a way to write auxiliary statements for use in a larger query. These statements, which are often referred to as common table expressions or CTEs, can be thought of as defining temporary tables that exist just for one query.
The following screenshot shows the data source designer supporting the WITH clause in the code view.
What’s next
Excited to try these features?
Get started with Bold BI® by signing up for a free 30-day trial and create more interactive business intelligence dashboards. If you have any questions on this blog, please feel free to post them in the following comment section. You can also contact us by submitting your questions through the Bold BI website or, if you already have an account, you can log in to submit your support question.


