


Data sources are the building blocks of the dashboards that power data visualization. A data source can be a file, a database on a DBMS, or even a live data feed. In this article, we are going to see how to create data sources from different connection types and how to manage and share them with other users in the Bold BI application. If you are new to the Bold BI Dashboards, sign up for a free 30-day trial on our website. At the end of the registration process, you will reach the following page view.
What data sources are supported in Bold BI?
Bold BI supports a wide range of data connections from Excel files to the Azure SQL data warehouse. The following are the different types of data connections supported:
- Files on your computer, like: CSV, Excel, JSON.
- Cloud file-sharing services, like: Google Drive, Dropbox, OneDrive.
- SQL databases, such as: MySQL, PostgreSQL, Amazon Redshift.
- Cloud applications with REST API, such as: JIRA, Google Analytics, Salesforce.
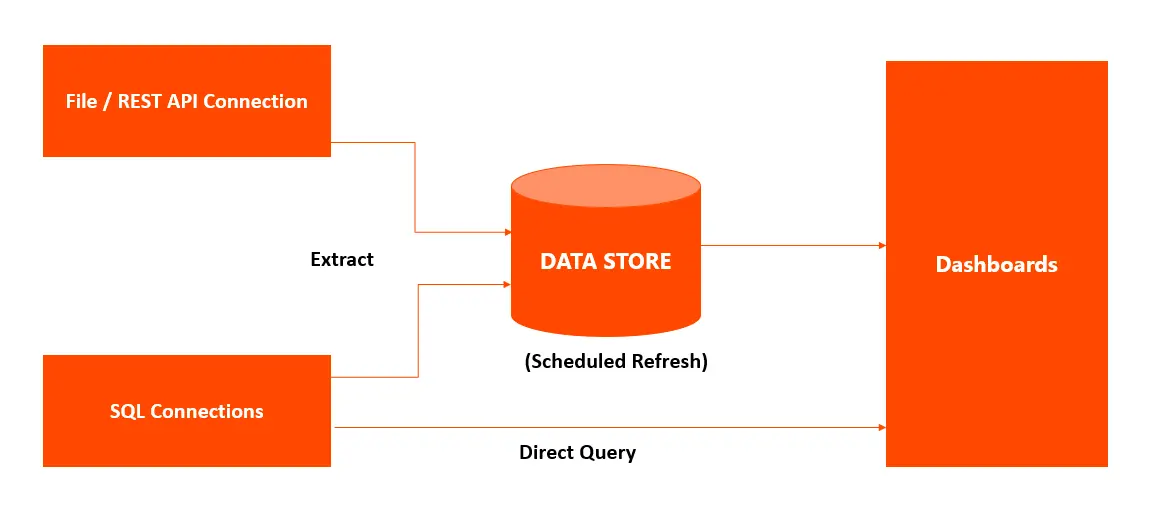
Bold BI has an internal data store where you can import data to build your dashboard. All the NoSQL databases, files, and REST API connections work in the extract mode, where the data is extracted and moved into the data store. You can configure refresh settings so that the data is periodically updated in the data store. The SQL databases, on the other hand, can work in both extract and live mode.
How do I create a data source?
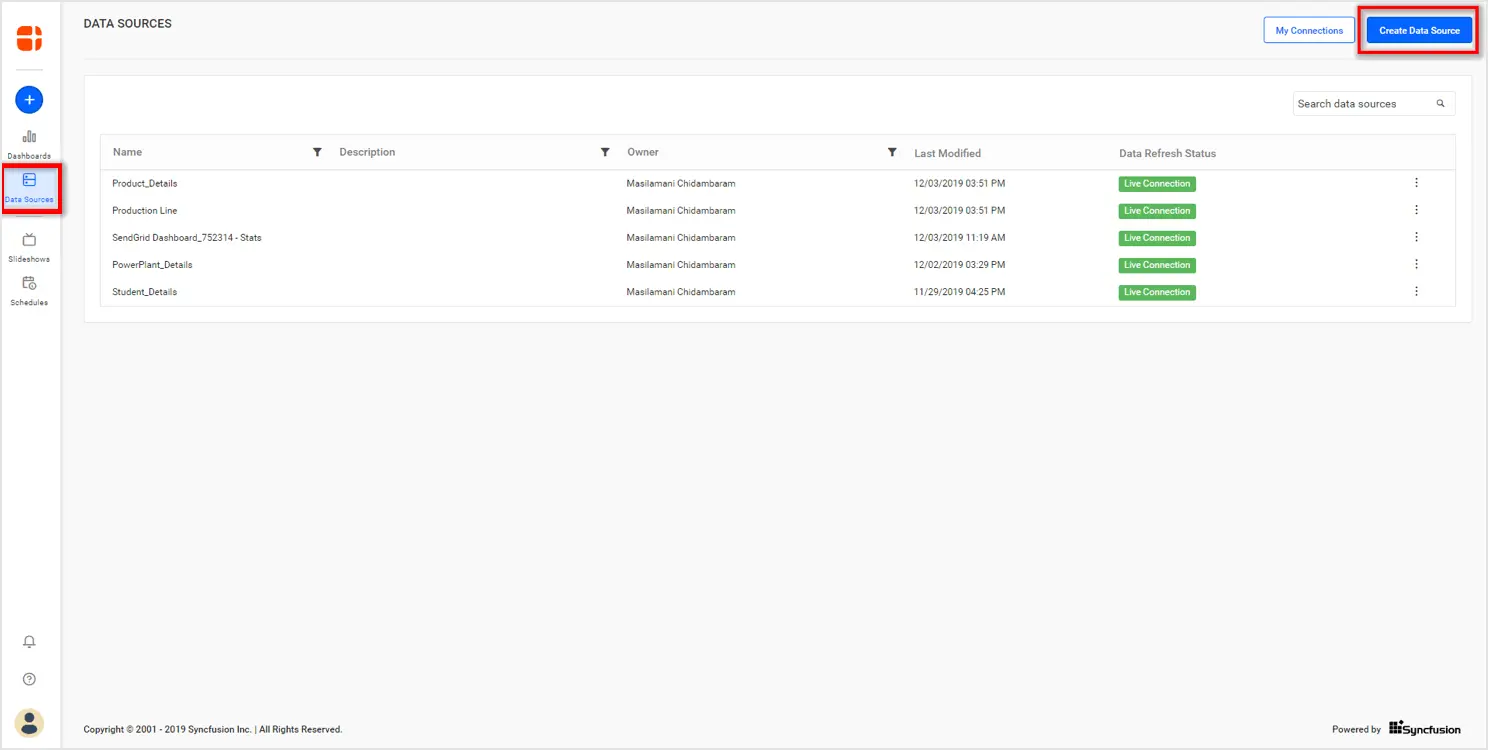
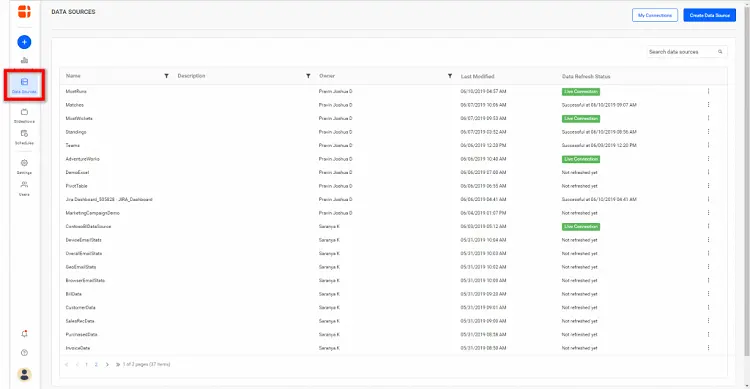
You can create a new data source from the home page, data sources listing page, or from the dashboard designer itself.
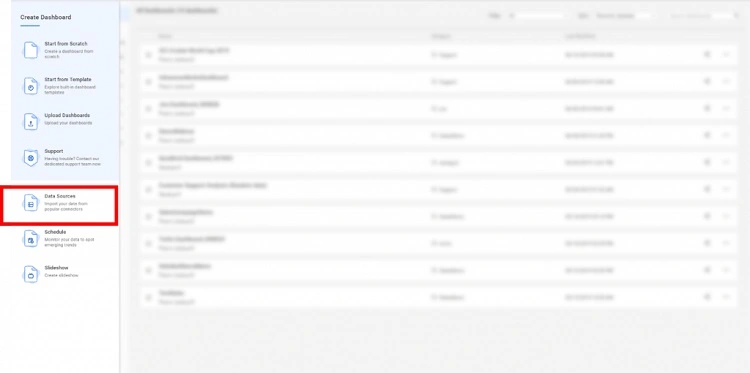
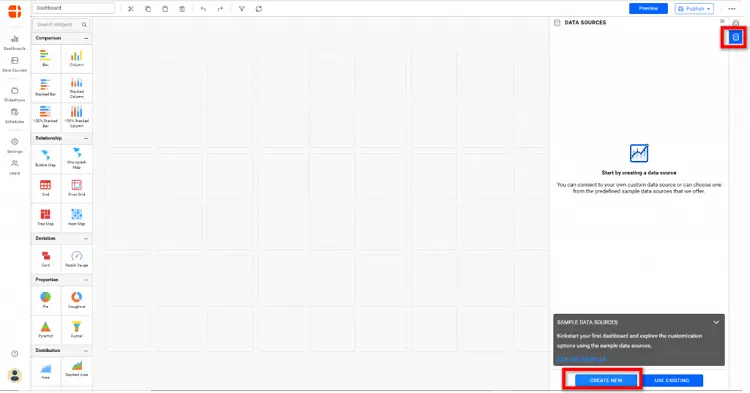
In the home page, click Create and select Data Sources to open the list of connections. Bold BI supports more than 80 different data connections, as shown in the following image.
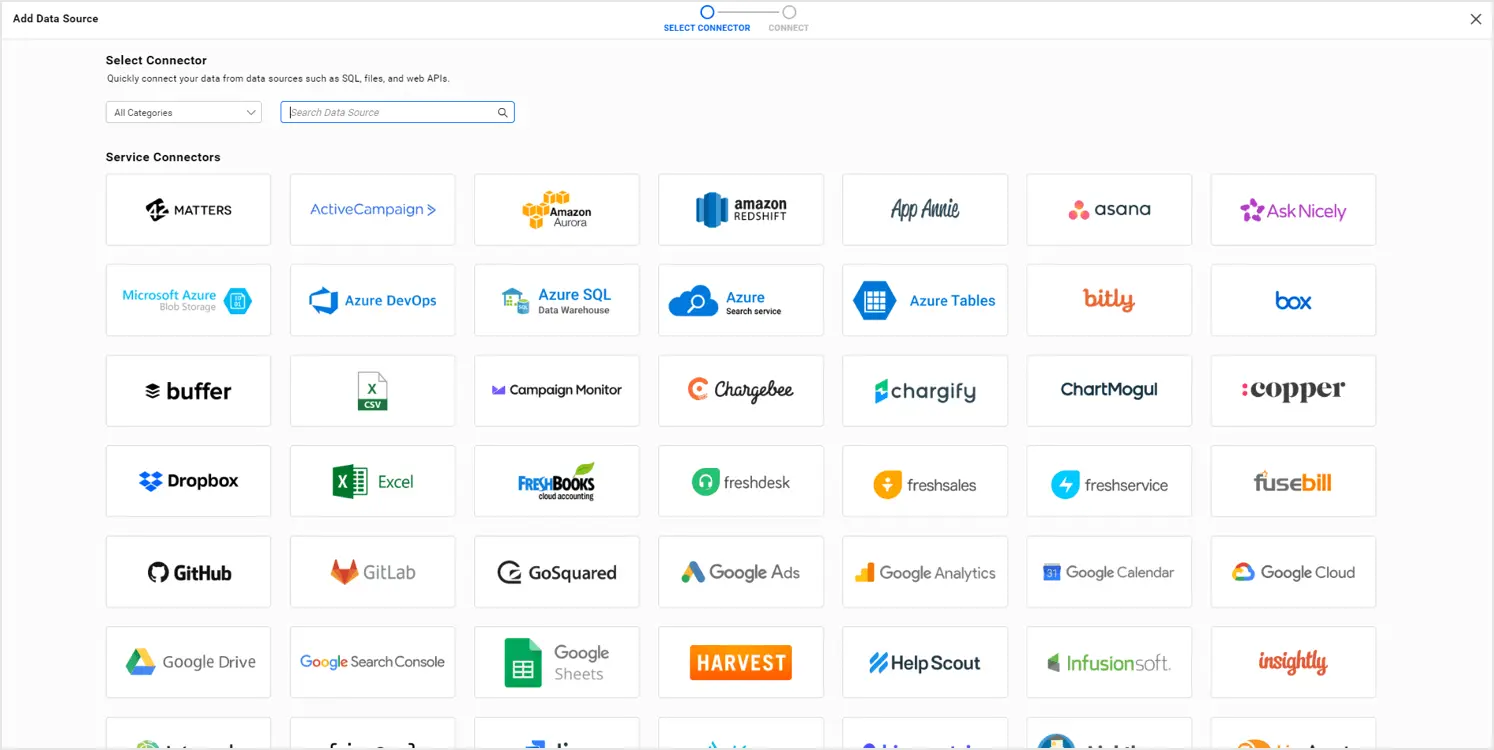
Choose one of the connections in the list and provide the connection and the authentication details in the connection wizard, as shown in the following.
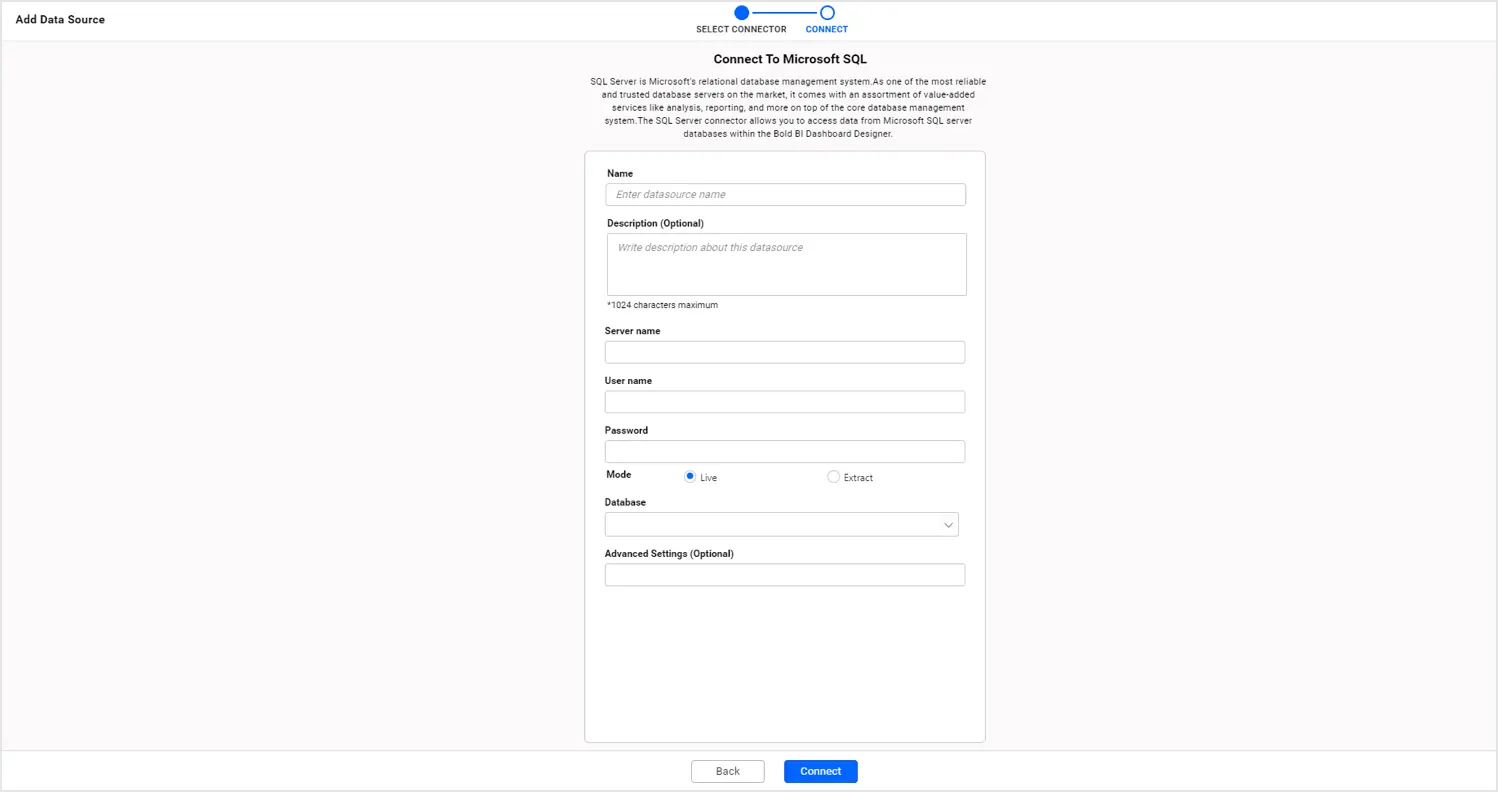
Click Connect to establish the connection. Upon successful connection, the application will navigate to the data source designer page.
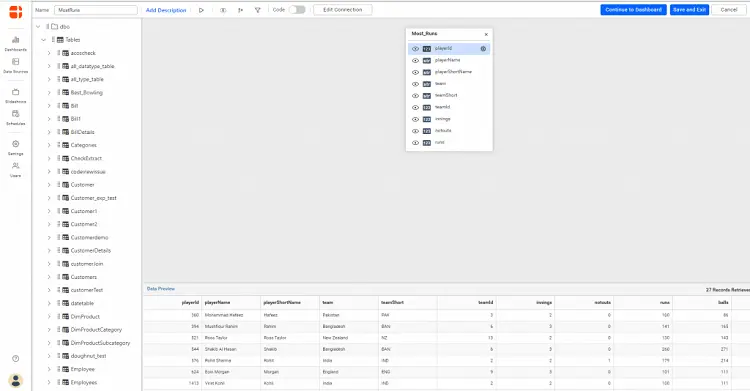
The data source designer is where you can add simple transformations to your data and format them for use in visualizations. The following transformations are supported:
- Join tables in your database with conditions.
- Create calculated fields based on an existing field.
- Format
- Filter your data based on conditions.
Drag and drop at least one table, apply transformations if required, and then save the data source by clicking the Save and Exit option. All your saved data sources can be found on the data source listing page.
The created data source can then be used in building your custom business dashboards. Now let’s see how to work with the different connection types in detail.
Creating a file connection
While adding a file connection, the data is extracted and moved to the built-in data store for advanced data processing. The size of the data store may vary based on your subscription plan. The following file types are supported in the application.
- Text
- Microsoft Excel
- CSV
- JSON
- XML
To create a static file connection, upload your file (limited to 75 MB) through the connection wizard and click the Preview & Connect option. In the case of Excel, each sheet is represented as a separate table, as shown in the following preview pane.
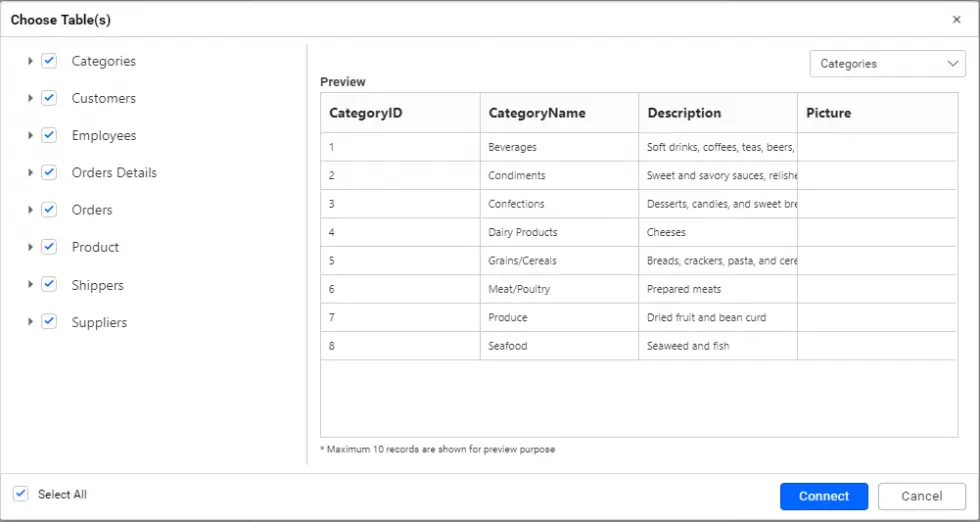
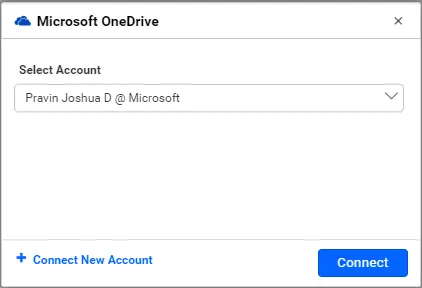
Choose only the tables and columns you will be using in the dashboard and then click Connect. The selected tables and columns will be extracted to the data store. To use files with dynamic content, use one of the cloud file-sharing services like Google Drive or Dropbox. In the data connections list, choose your connection (OneDrive in the example) and authenticate the connection.
From the file picker, choose a file from one of the supported file formats and configure the refresh settings as shown in the following image. For CSV files, choose the delimiter (comma, tab, semicolon).
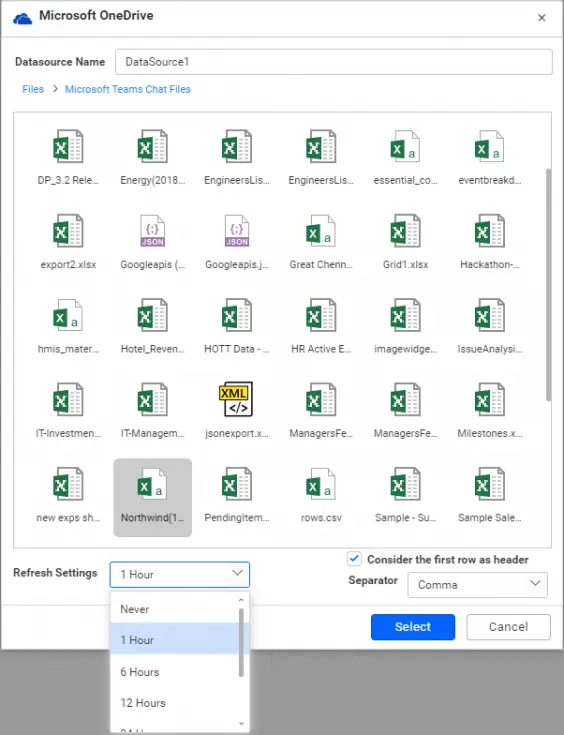
When the refresh settings are configured, the data will be updated in the mentioned refresh cycle to help you keep your dashboard updated with the latest data.
Creating a SQL database connection
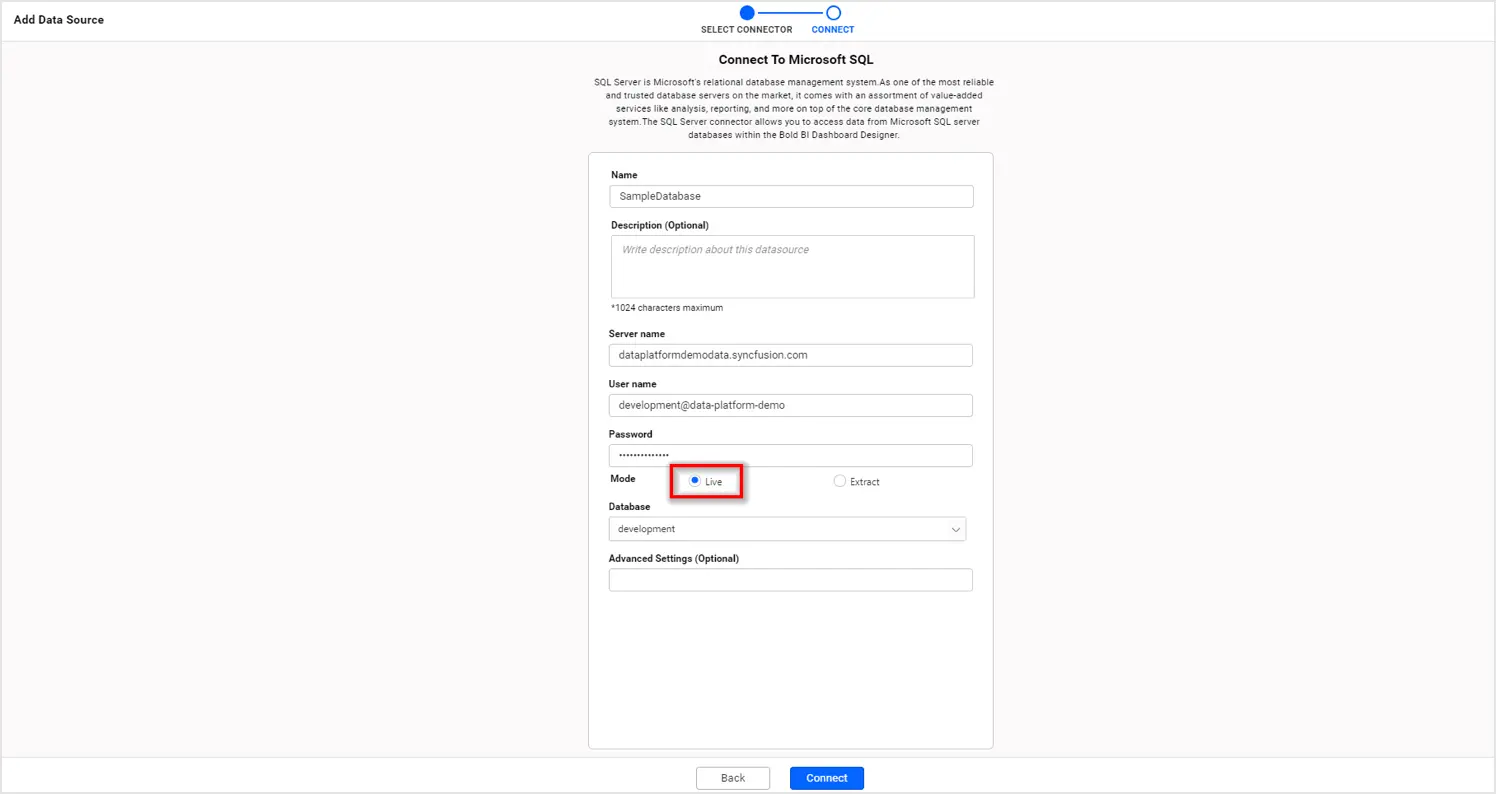
You can create dashboards from the data on your enterprise server by selecting the required connection from the list. The SQL connections can work for both live and extracted modes. By default, the SQL connections work on the live mode as shown in the following image. You can add the server details and authentication, and then connect with the database. Please make sure to white list the following IP addresses to avoid service disruptions:
- 52.234.209.94
- 52.234.228.143
- 52.234.230.214
- 52.234.224.254
- 52.234.225.60
- 52.234.231.3
- 52.234.229.253
- 52.234.228.68
When connected in live mode, the dashboard always shows the live data when you open or refresh the dashboard.
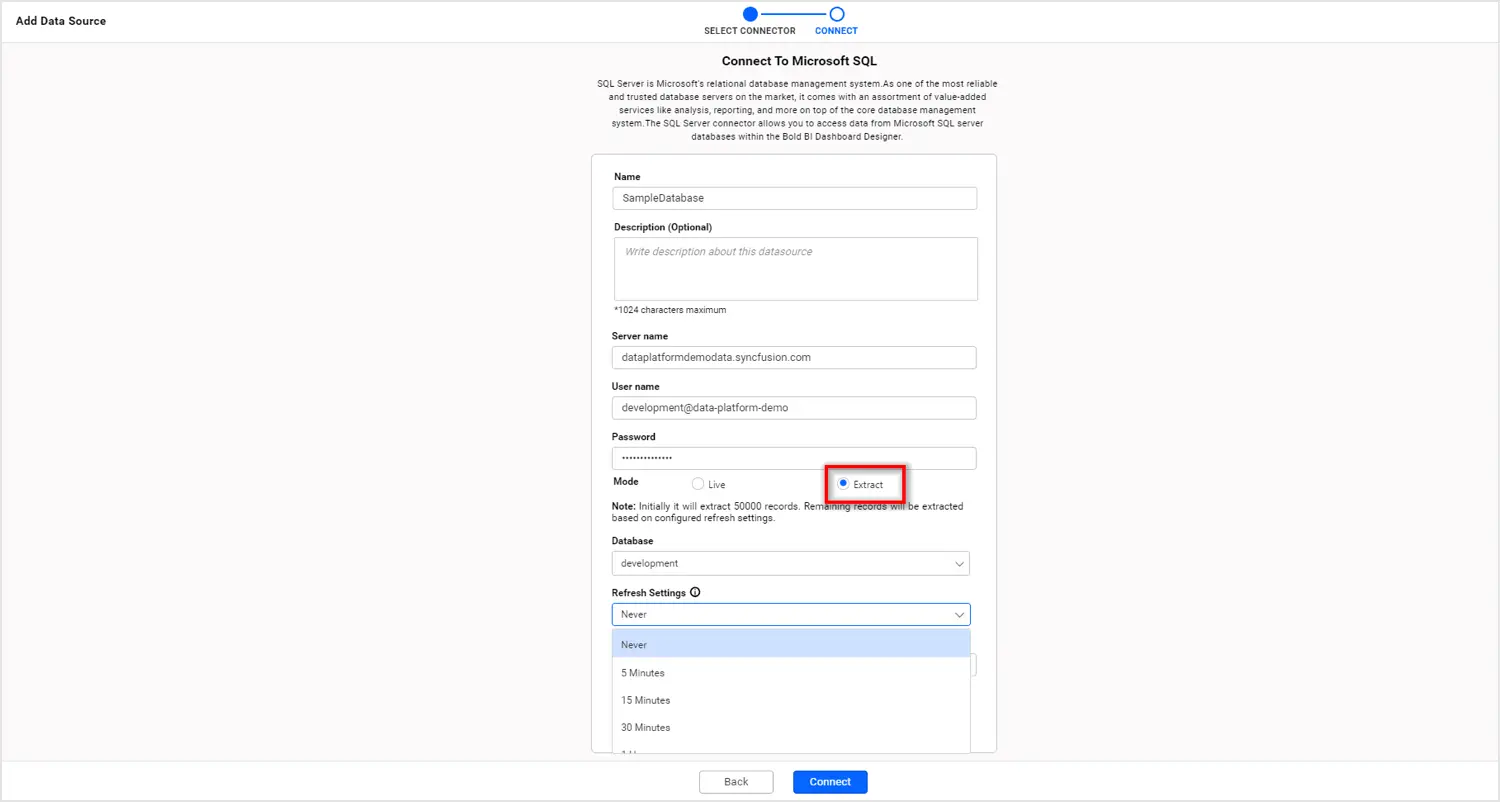
You can also extract the data from your SQL databases, move it to the data store, and build the dashboard from it. To connect in extract mode, select the Extract radio button and connect to your database. You can also choose the refresh time interval to move the latest data into the data store in periodic intervals.
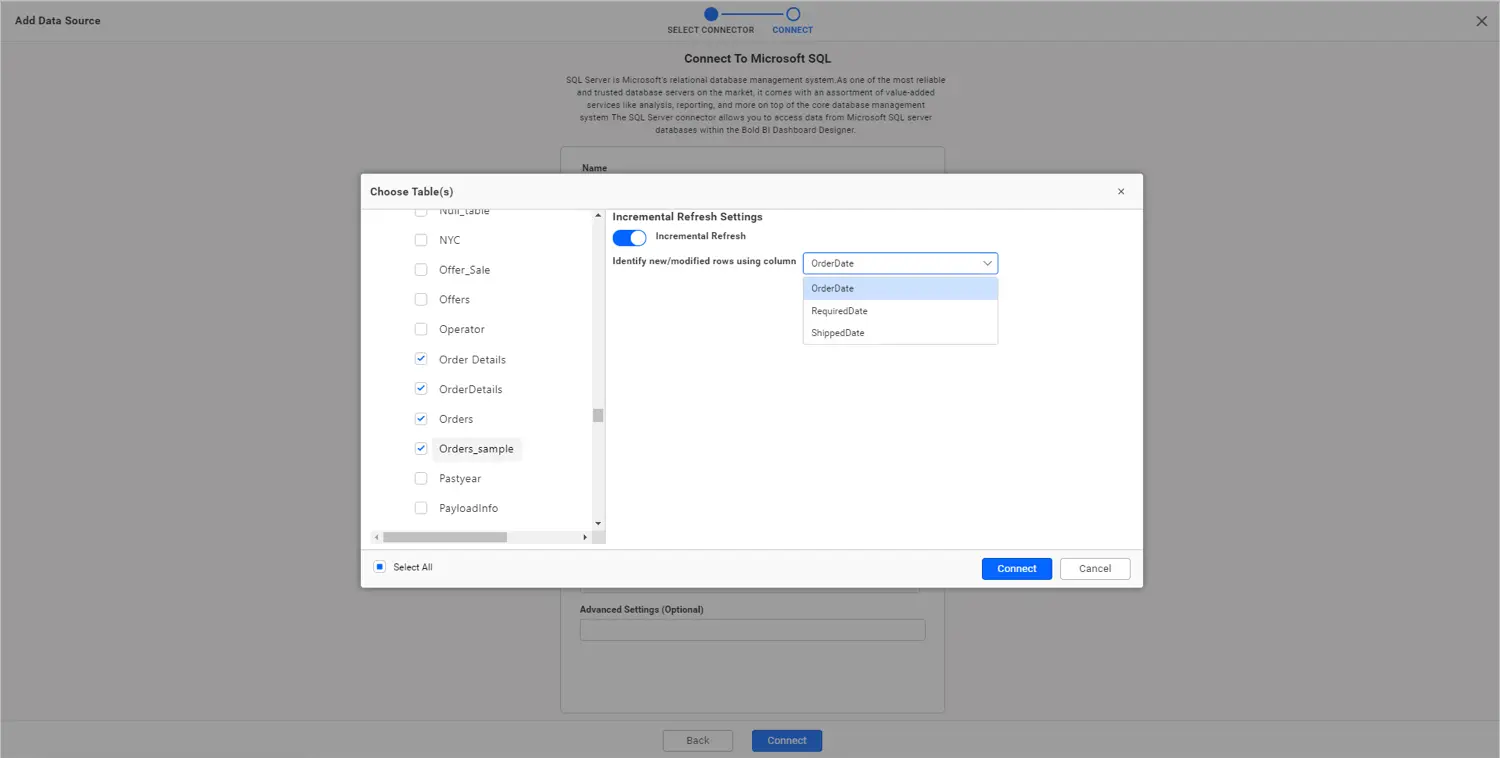
In the extract mode, during every refresh cycle the selected tables will be dropped and the data will be freshly pulled from the database and moved into the data store. You can also configure incremental refreshes to fetch only the modified or new rows into the data store. This could highly reduce the time taken to refresh the data. To configure incremental refreshes, select the column with the timestamp as shown in the following image.
Once configured, click Connect to take you to the data source designer where you can transform and save the data source.
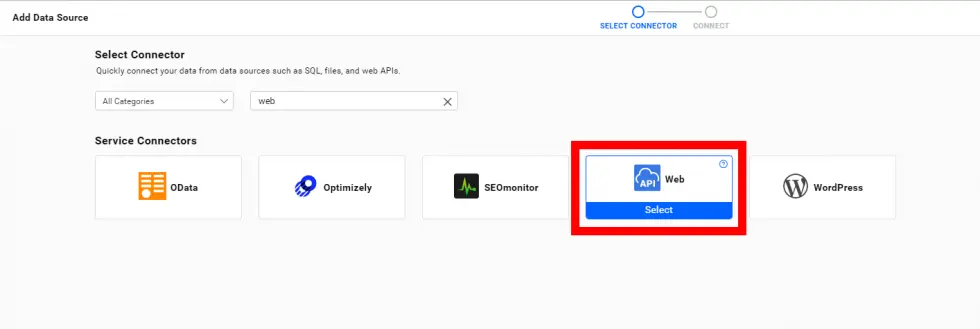
Creating a Web API connection
You can connect to any web data source using RESTful APIs. Bold BI has a generic Web API connector you can use to connect to the web data sources using GET/POST methods. The connector also allows you to add request headers and parameters.
The connector lets you retrieve responses in JSON, CSV, or XML formats and allows basic HTTP authentication or open connections through No Authentication mode.
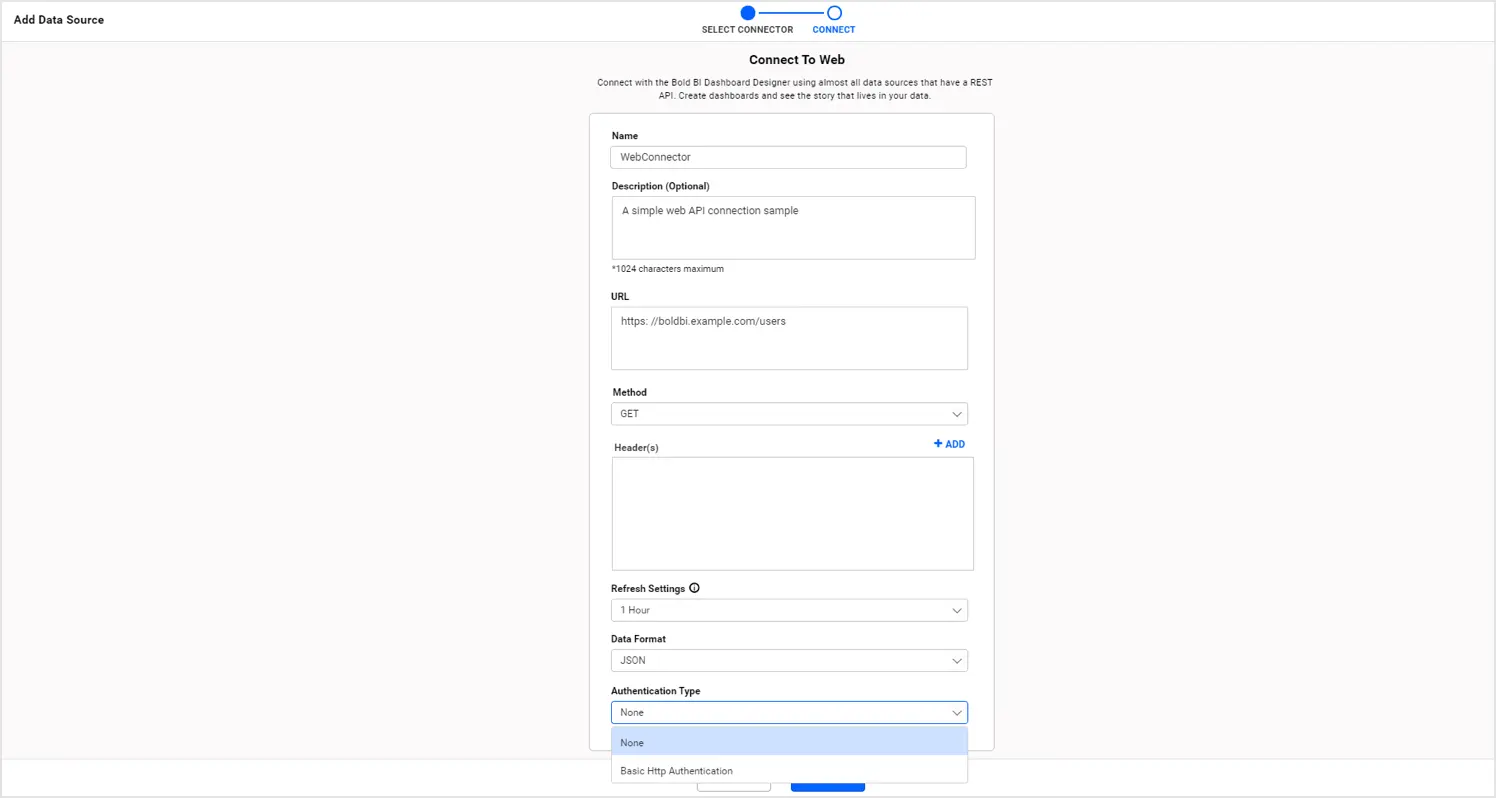
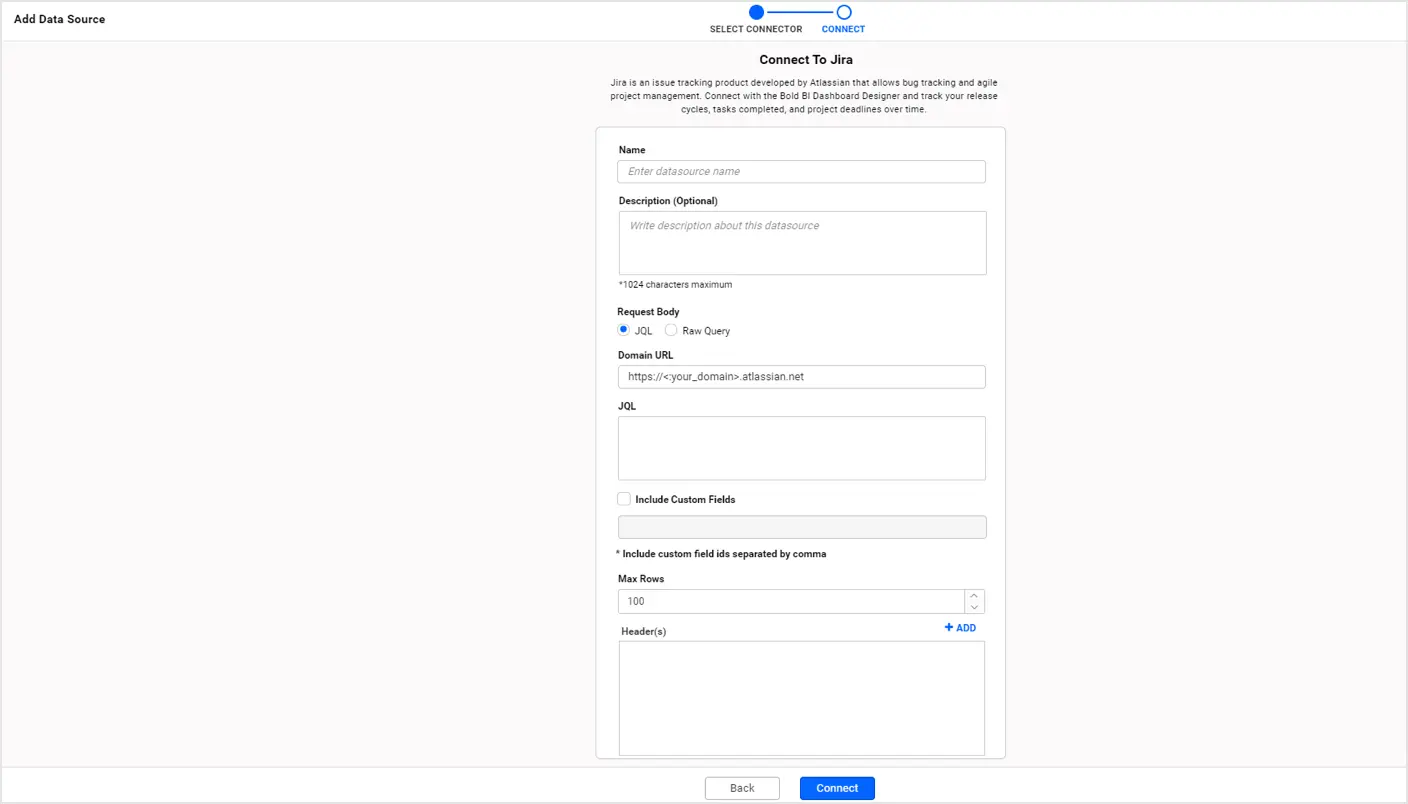
Make sure you always have the latest data in your data source by configuring the Refresh Settings to the desired time interval. For other known connections, such as Salesforce or Zendesk, you can use the native connectors available in the wizard. The native connectors are specifically designed for the connection and come with preconfigured headers, URLs, and parameters wherever applicable.
Creating an OAuth connection
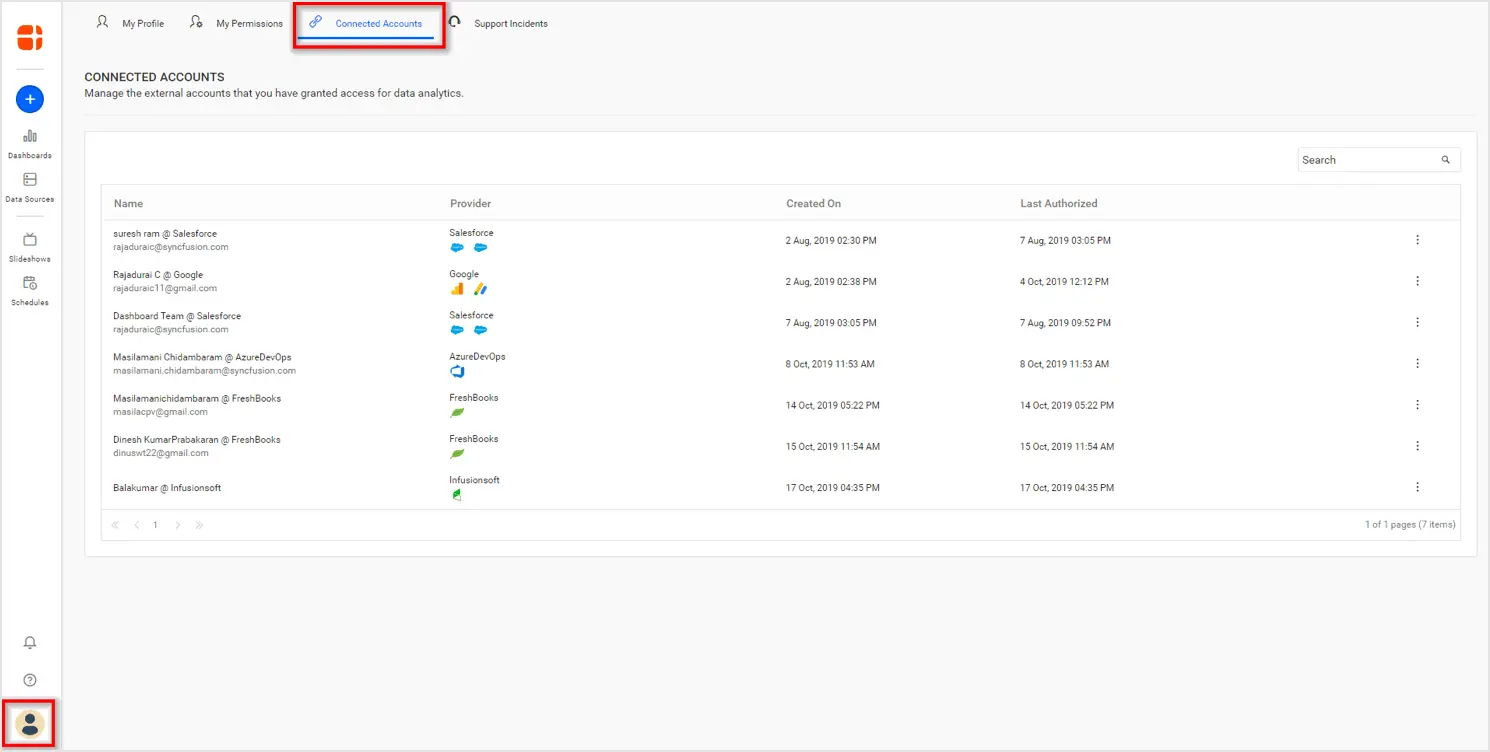
Bold BI provides SSO (Single Sign-On) support for web connections such as Salesforce and Smartsheet. This requires OAuth authentication. To create a data source from an OAuth connection, just select the required connection from the list and enter your login credentials. Once the authentication is successful, the application will navigate to the wizard where you can add your REST API (SOQL query for Salesforce), refresh settings, etc., and create a connection just like the other Web API connections. Additionally, Bold BI preserves your authentication (access token and refresh token) details in the application securely to help you build more dashboards from it without having to sign in again. You can access these authentication details from the profile page of your application as shown in the following image.
For a token expiration or password change, you can re-authorize the connections from here. Click the menu on the right side of your connection and choose the option Reauthorize.
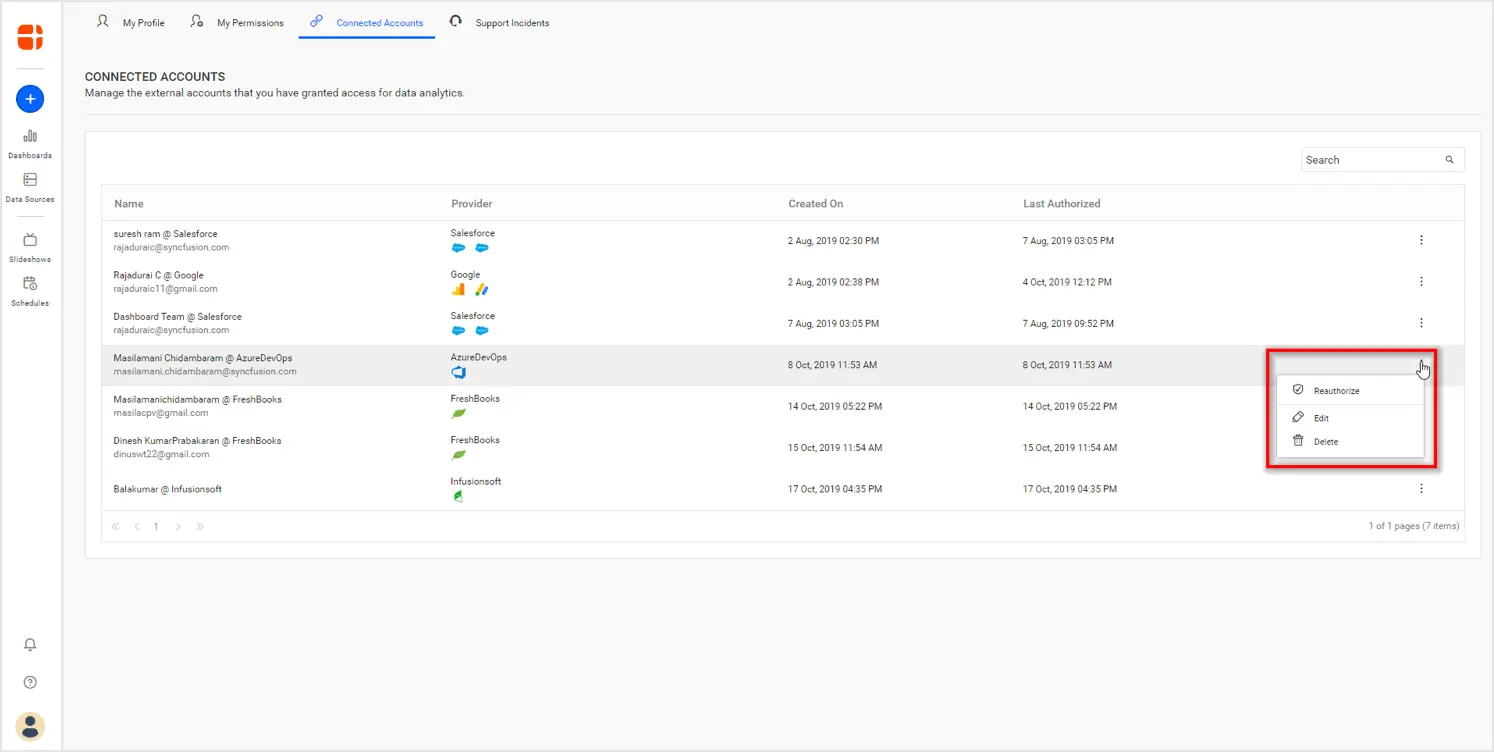
By reauthorizing the connection, all the dashboards that use the connection will be refreshed in a single action and the dashboard can show the metrics without any disruption.
Combining multiple data sources
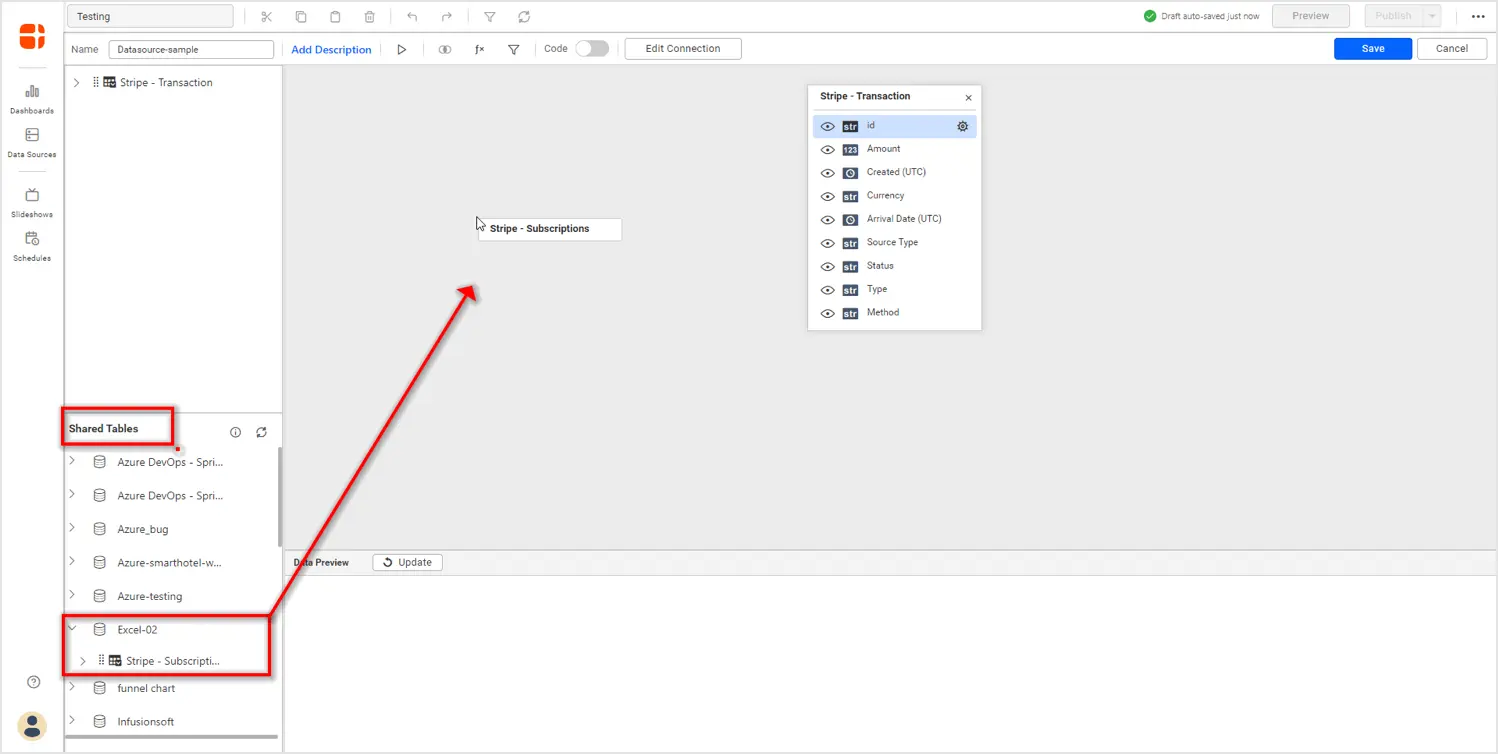
Combining data from multiple sources is a major requirement with the usage of various online applications. A good example is measuring email campaign performance using data from Mailchimp and Salesforce. Bold BI allows you to combine multiple data sources when they are in extract mode. The extracted tables can be joined to build interactive dashboards. To combine multiple data sources, use the Shared Tables panel at the bottom of the data source designer. All the extracted tables you own and those shared with you are listed in the Shared Tables panel. You can drag them to the canvas, as shown in the image, to join them.
Sharing data sources
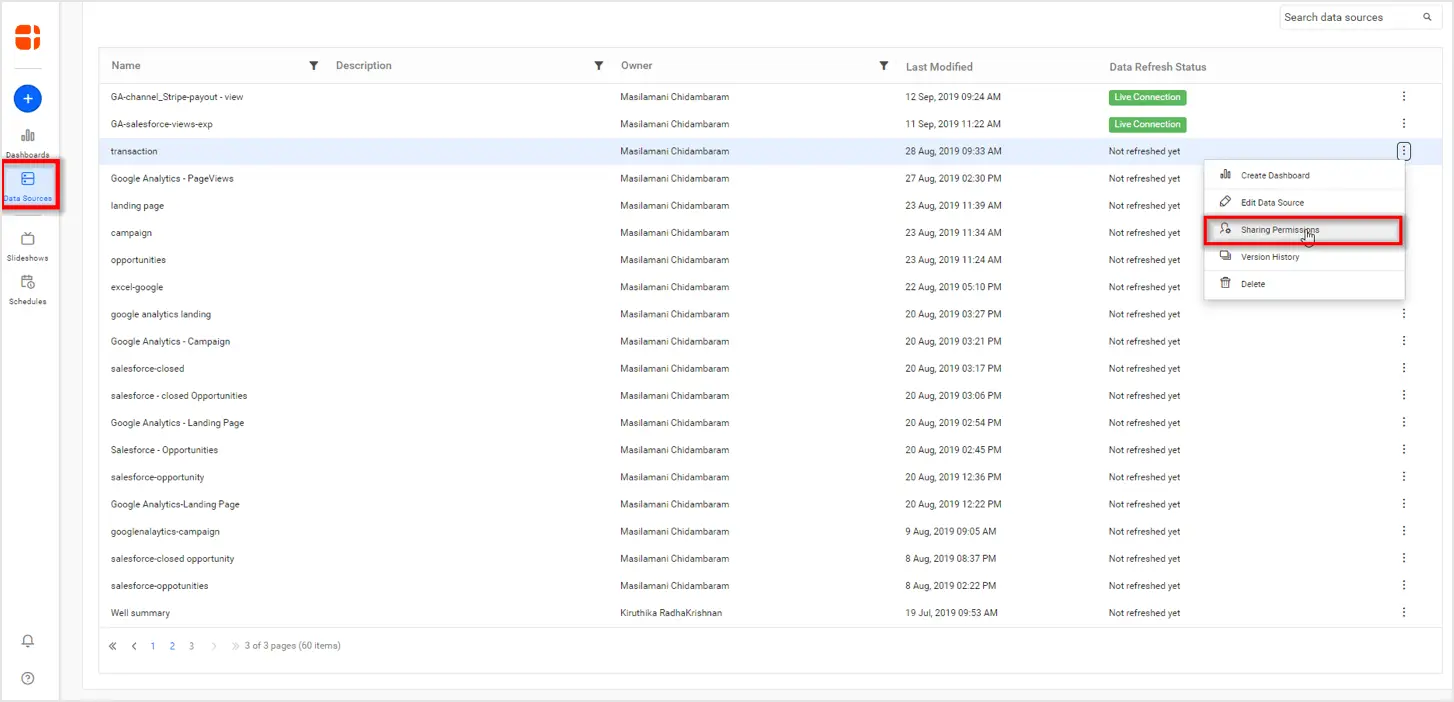
You can share your data sources with other users in the application to let them build dashboards from them. To share a data source with another user, go to the data sources listing and choose Sharing Permissions from the menu, as shown in the following image.
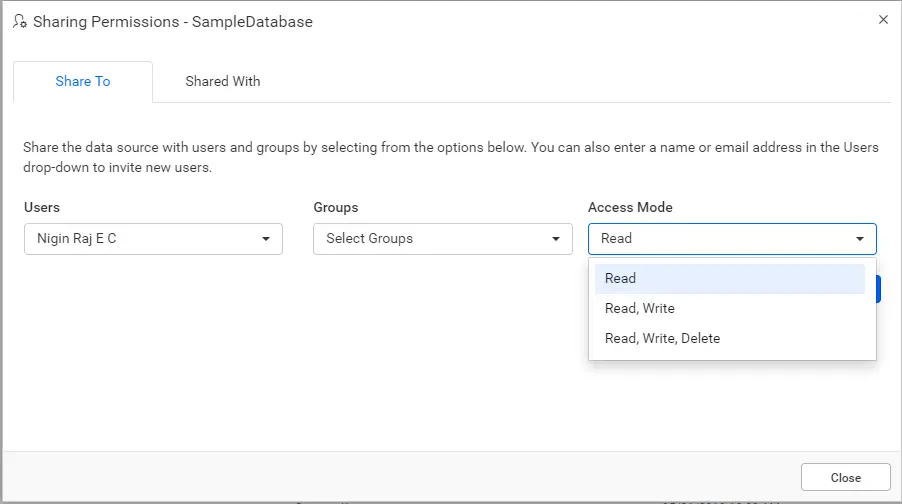
In the Sharing Permissions dialog, you can choose users or groups with whom to share the data source and specify the access permissions. For example, you can be the owner for the data source and not let others edit it, but allow them to build dashboards from it using the Read access mode.
Editing a data source
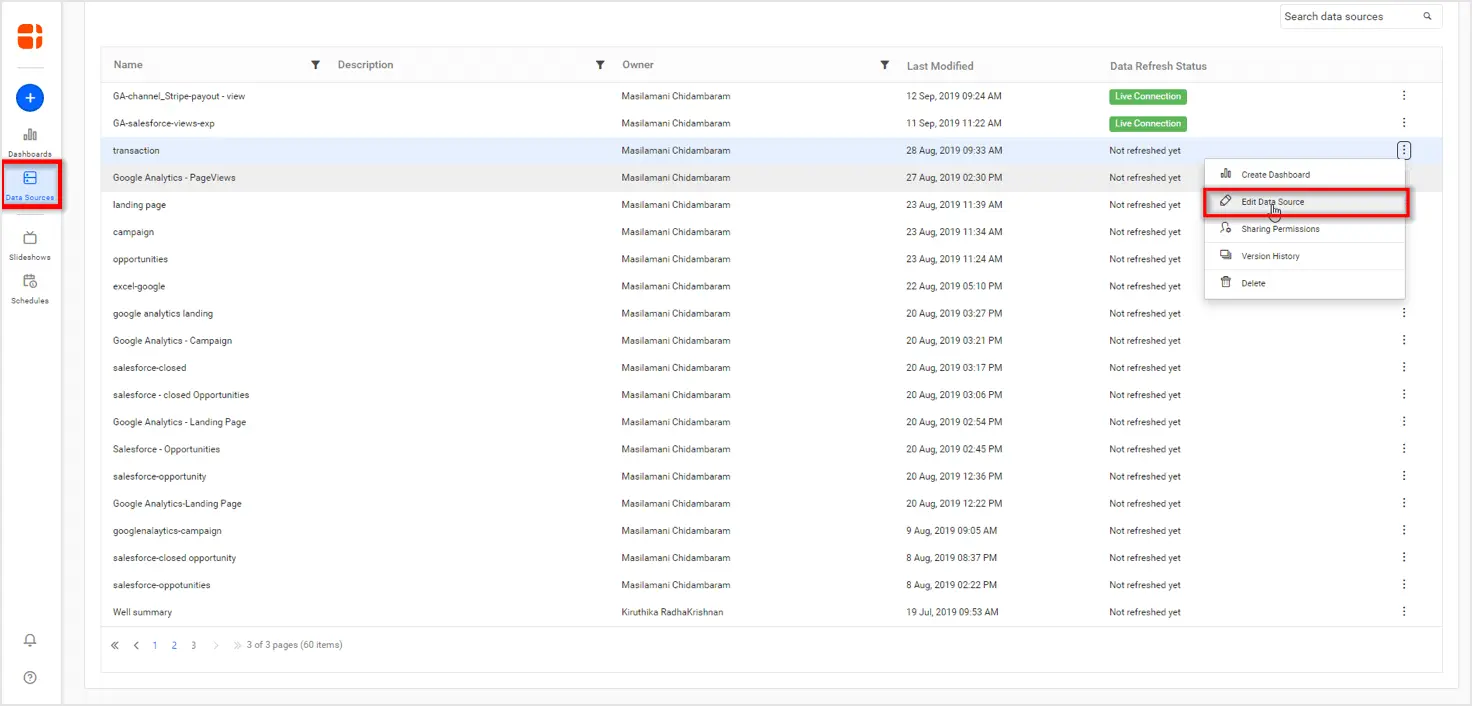
To edit a data source, choose Edit Data Source from the listing menu, as shown in the following image. Keep in mind, once you edit and resave the data source, the changes will affect all the dashboards that use the data source in a shared mode.
Conclusion
We hope this article helped you to kick-start building your own dashboard with the data you have. If you have any questions on this blog, please feel free to post them in the following comment section. Get started with Bold BI by signing up for a free 30-day trial and create more interactive business intelligence dashboards. You can also contact us by submitting your questions through the Bold BI website or, if you already have an account, you can log in to submit your support question.


