


In today’s data-driven landscape, transforming raw information into actionable insights is pivotal to decision-making. Self-service business intelligence (BI) embedding enables IT professionals to deliver BI services to end users in their companies through the apps they already use. In this blog, we delve into the transformative role of embedded self-service BI, spotlighting how it democratizes analytics. We’ll look at how administrators of healthcare application systems can set up self-service BI tools like Bold BI® to help their coworkers improve patient outcomes.
The significance of embedded self-service BI tools
Embedded self-service business intelligence allows end users to access and interact with BI tool features within existing workflows without switching programs. Using embedded BI brings several advantages to companies.
Enhanced user experience and adoption
Integrating data insights directly into the applications users rely on provides a seamless and familiar experience. It reduces the need for context switching and keeps the metrics in front of them, leading to faster adoption and broader engagement with BI tools.
Improved customer insights
Businesses can gain relevant insights into customer behavior and choices by embedding self-service BI tools into applications. This empowers them to personalize interactions, improve customer service, and drive loyalty.
Improved efficiency and productivity
By empowering employees to analyze data independently, self-service BI tools free up IT teams from BI tasks. This allows them to work on more complex projects, boosting their productivity.
Reduced costs
Embedding self-service BI eliminates the need for additional software and dedicated personnel, reducing costs associated with traditional BI solutions. Additionally, increased efficiency and productivity lead to further cost savings.
How to leverage Bold BI in a healthcare app
Bold BI provides a unique blend of capabilities and features that allow businesses to democratize data analytics. A practical example of this is within healthcare applications. Bold BI enables healthcare professionals to monitor real-time department and patient metrics within a healthcare application by securely connecting to data sources like electronic health records (EHRs), billing systems, and patient satisfaction surveys in real time.
Let’s go through the steps the IT administrator at a healthcare facility would perform to set up a dashboard in their JavaScript healthcare application once it’s integrated with Bold BI.
Create a data source
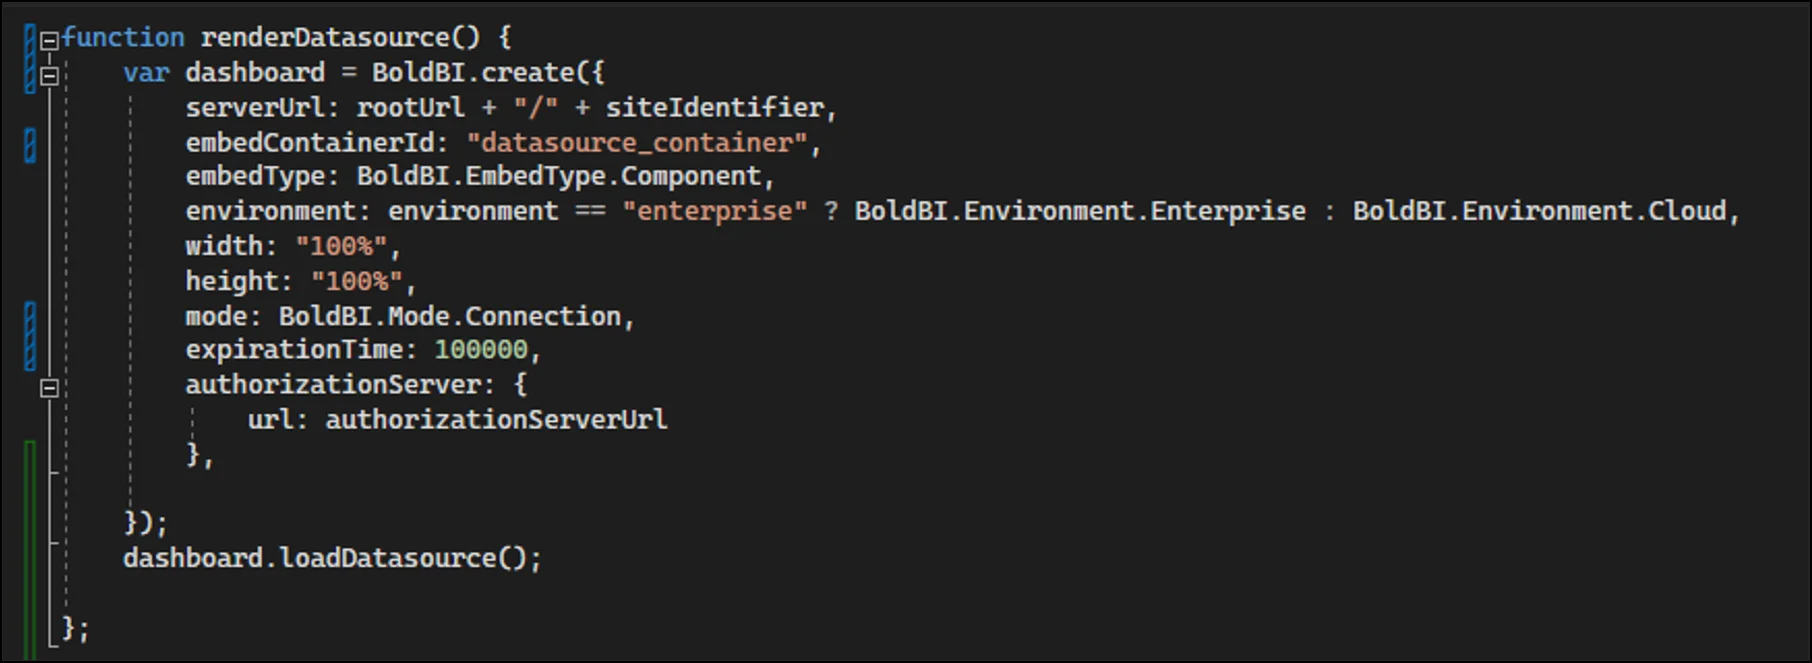
The application administrator would first need to create a data source. To make this happen, they should connect to the relevant data platform. This is achievable in the embedded Bold BI application through the following code example. The Connection mode and the loadDatasource function call show the connectors window in the embedded view for the admin, followed by the data source creation process.
function renderDatasource() {
    var dashboard = BoldBI.create({
        serverUrl: rootUrl + "/" + siteIdentifier,
        embedContainerId: "datasource_container",
        embedType: BoldBI.EmbedType.Component,
        environment: environment == "enterprise" ? BoldBI.Environment.Enterprise : BoldBI.Environment.Cloud,
        width: "100%",
        height: "100%",
        mode: BoldBI.Mode.Connection,
        expirationTime: 100000,
        authorizationServer: {
            url: authorizationServerUrl
        },
    })
    dashboard.LoadDatasource();
}
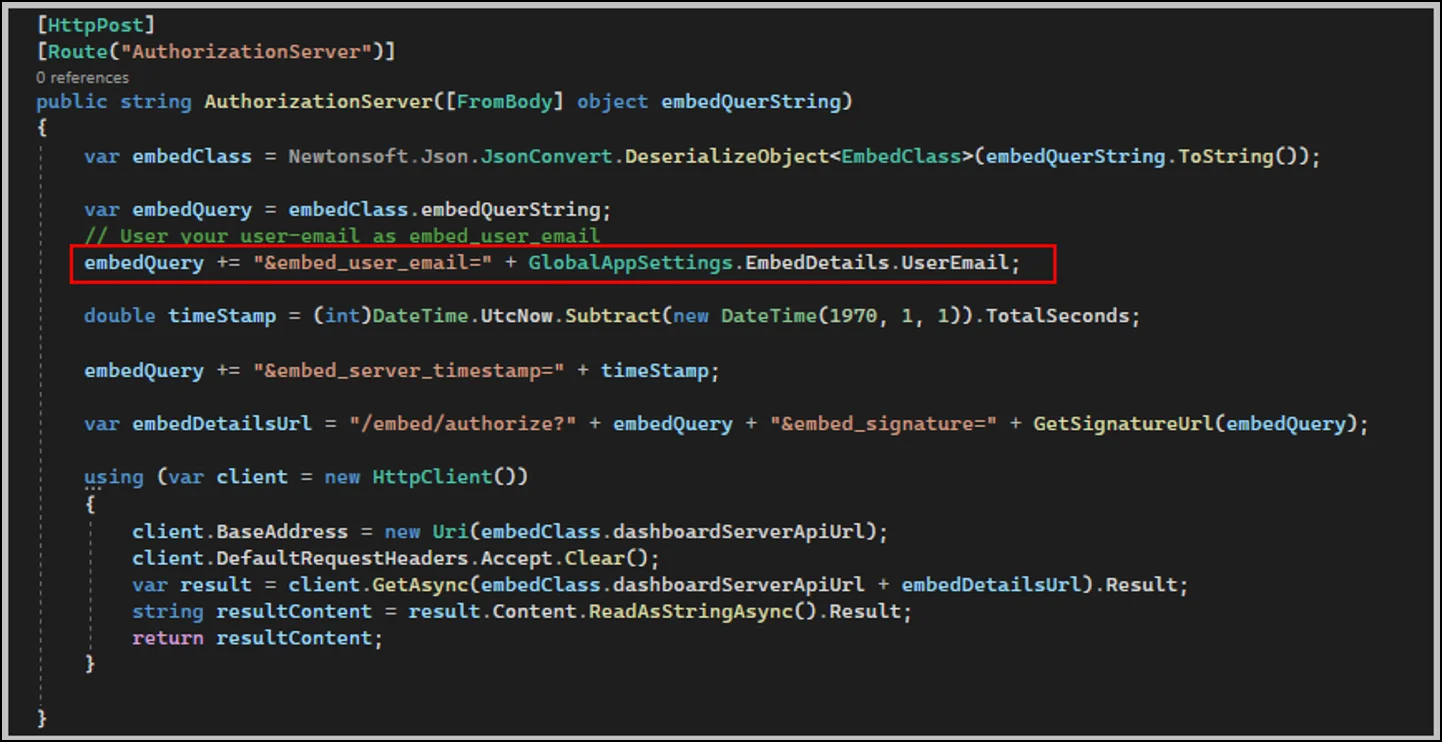
Setting up authorized access is an optional step, but one that is commonly needed when access to the embedded modules needs to be restricted to authorized users. An authorization endpoint can be incorporated into the application, connecting the healthcare application and the Bold BI server. The administrator should set security details, like email-based or group-based access.
[HttpPost]
[Route("AuthorizationServer")]
public string AuthorizationServer([FromBody] object embedQuerString)
{
    var embedClass = Newtonsoft.Json.JsonConvert.DeserializeObject < EmbedClass > (embedQuerString.ToString());
    var embedQuery = embedClass.embedQuerString;
    // User your user-email as embed user email
    embedQuery += "&embed_user_email=" + GlobalAppSettings.EmbedDetails.UserEmail;
    double timeStamp = (int)DateTime.UtcNow.Subtract(new DateTime(1970, 1, 1)).TotalSeconds;
    embedQuery += "&embed_server_timestamp=" + timeStamp;
    var embedDetailsUrl = "/embed/authorize?" + embedQuery + "&embed_signature=" + GetSignatureUrl(embedQuery);
    using(var client = new HttpClient())
        {
    client.BaseAddress = new Uri(embedClass.dashboardServerApiUrl);
    client.DefaultRequestHeaders.Accept.Clear();
    var result = client.GetAsync(embedClass.dashboardServerApiUrl + embedDetailsUrl).Result;
    string resultContent = result.Content.ReadAsStringAsync().Result;
    return resultContent;
}
}
The data source listing panel will be displayed for creating a new data source in the healthcare application that allows the end user to select the required data and save the source within the application at runtime, as shown in the following image.
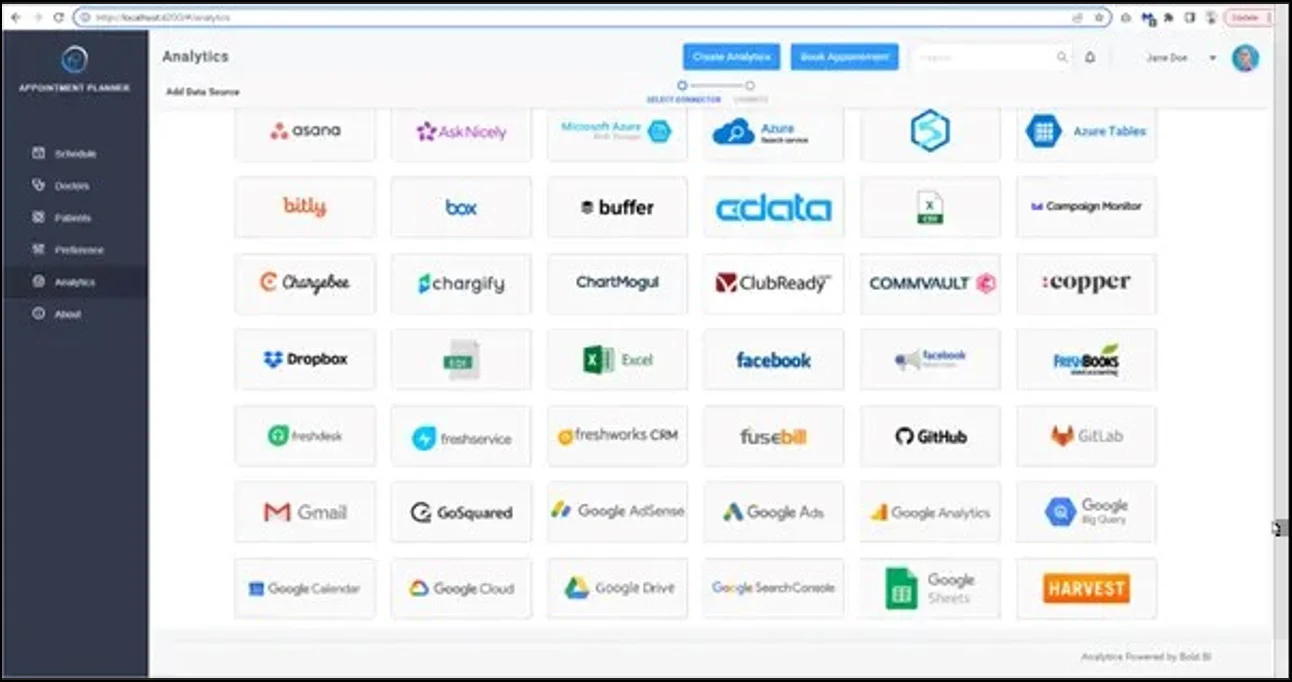
With this setup, the data source is connected. To learn more about creating data sources in embedded Bold BI, check out this documentation.
Create a dashboard
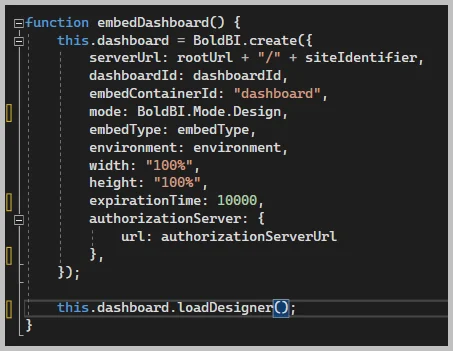
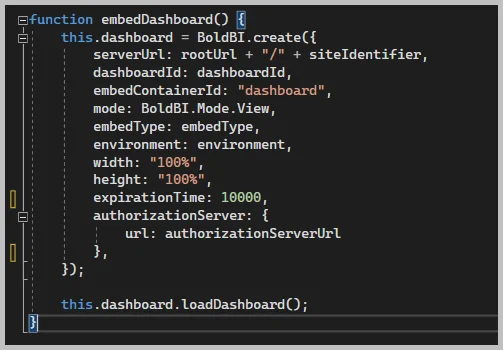
Next, the administrator would create a dashboard including the healthcare-related metrics. So, the following code example needs to be integrated into the embedded application to show the user the dashboard design view at runtime.
function embedDashboard() {
    this.dashboard = BoldBI.create({
        serverUrl: rootUrl + "/" + siteIdentifier,
        dashboardId: dashboardId,
        embedContainerId: "dashboard",
        mode: BoldBI.Mode.Design,
        embedType: embedType,
        environment: environment,
        width: "100%"
        height: "100%",
        expirationTime: 10000,
        authorizationServer: {
            url: authorizationServerUrl
        },
    });
    this.dashboard.loadDesigner();
}
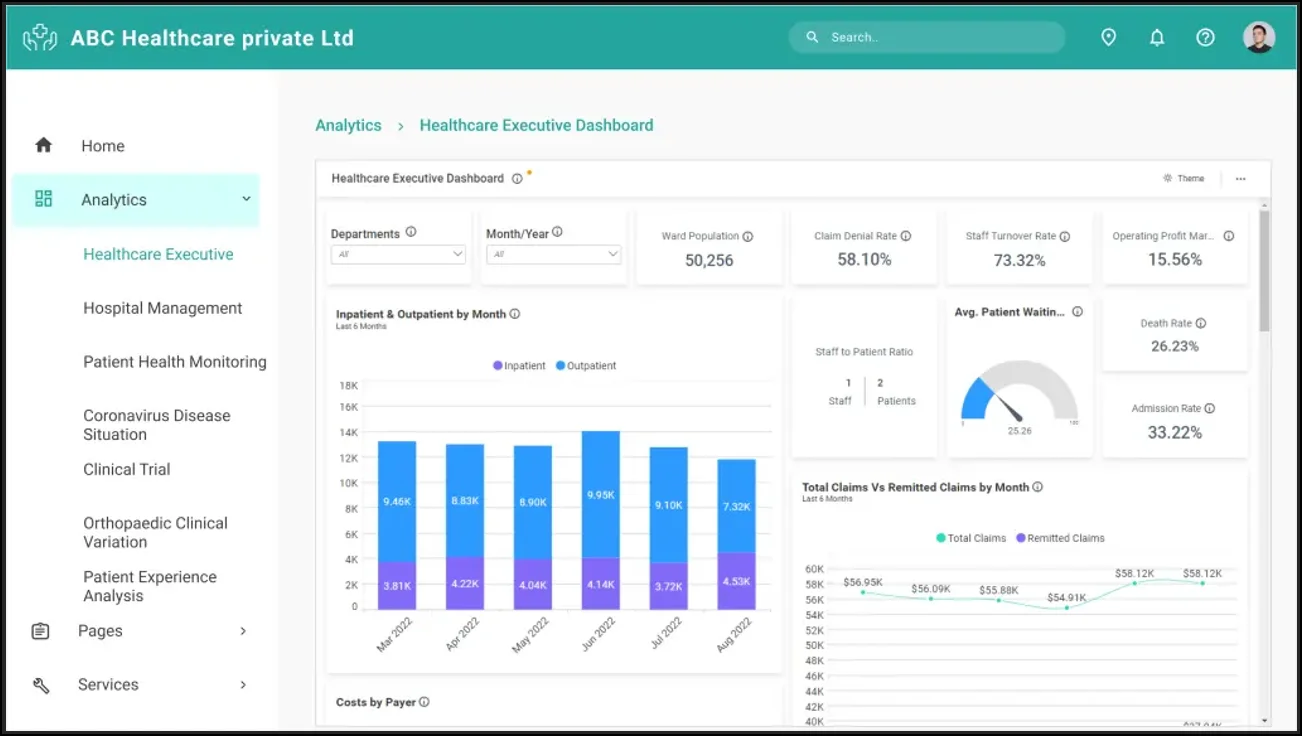
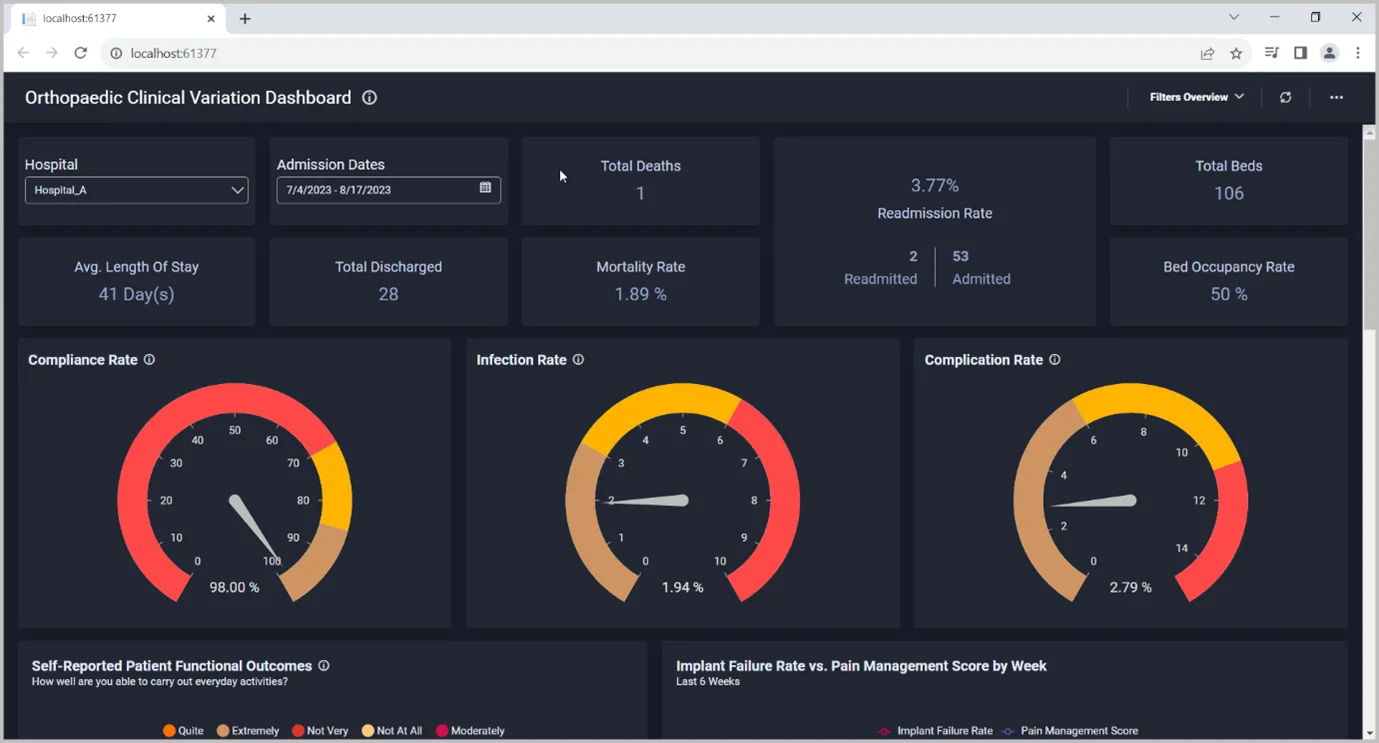
Now, employees can create a dashboard like the healthcare executive dashboard, which showcases metrics related to the quality of patient care, operational effectiveness, and financial health of a healthcare facility.
Alternatively, the admin can load a dashboard they have created into the embedded view for their coworkers to use. See the following code example.
function embedDashboard() {
    this.dashboard = BoldBI.create({
        serverUrl: rootUrl + "/" + siteIdentifier,
        dashboardId: dashboardId,
        embedContainerId: "dashboard",
        mode: BoldBI.Mode.View,
        embedType: embedType,
        environment: environment,
        width: "100%"
        height: "100%"
        expirationTime: 10000,
        authorizationServer: {
            url: authorizationServerUrl
        },
    });
    this.dashboard.LoadDashboard();
}
After this code execution, the dashboard will be rendered like the following.
Add widgets
If dashboard creation is left up to facility employees, they can at this point add widgets to the designer through simple drag-and-drop actions from the toolbox at the left.
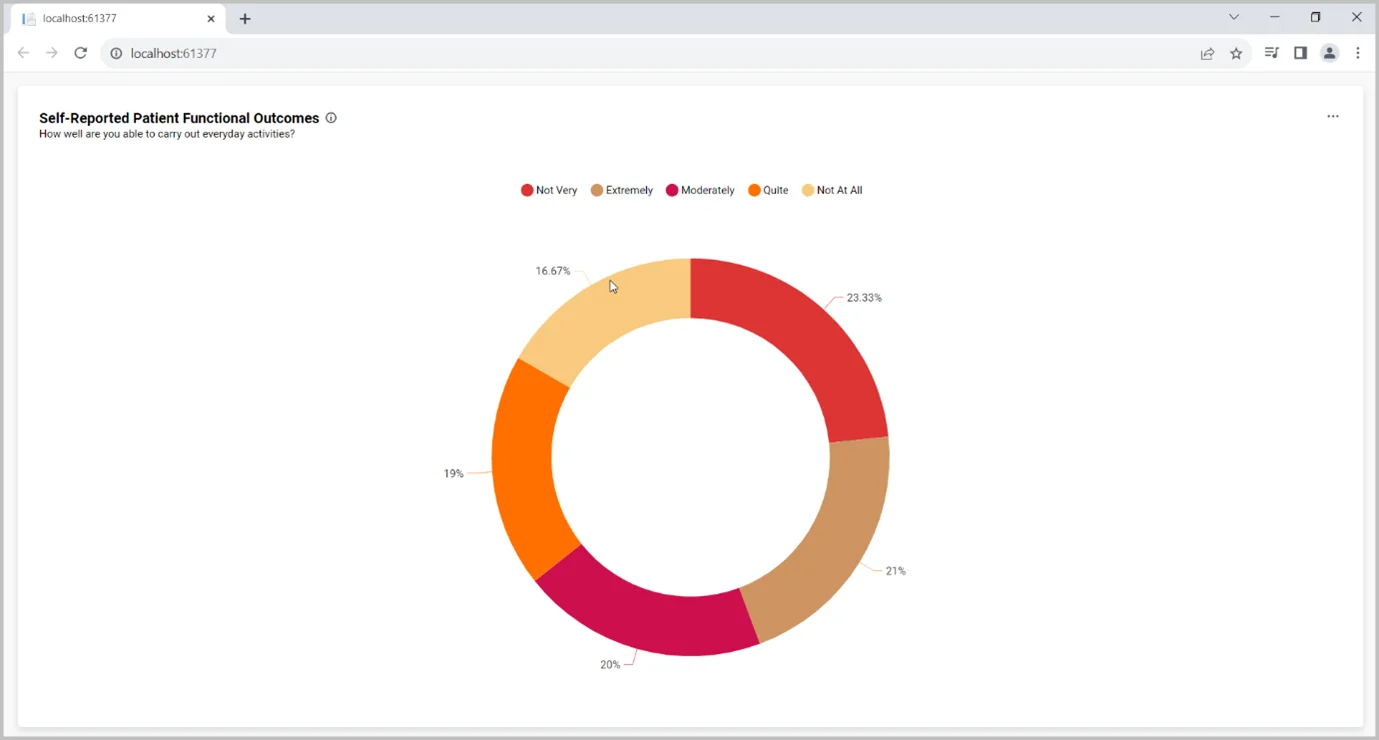
If the application administrator would instead like to insert a widget by itself in an application page, they would add a code sample like the following. It embeds a preconfigured widget from an existing dashboard. In this code, the loadDashboardWidget function call renders the corresponding widget from the newly created dashboard and embeds it in a specific place in the application.
function embedSample() {
    var boldbiEmbedInstance = BoldBI.create({
        serverUrl: "http://localhost:51777/bi/site/site1"
        dashboardId: "9a4b8ddb-606f-4acd-8c53-8ccdcaa92a87",
        embedContainerId: "dashboard-container",// This should be the container id where you want to embed the dashboard designer
        embedType: BoldBI.EmbedType.Component,
        environment: BoldBI.Environment.Enterprise,
        mode: BoldBI.Mode.View,
        height: "800px",
        width: "1200px",
        authorizationServer: {
            url: "http://example.com/embeddetail/get"
        },
        expirationTime: "100000",
    });
    boldbiEmbedInstance.loadDashboardWidget("749e68ee-30b5-464f-93d3-412b1a6c9d20"); // Pass widget name as argument to loadDashboard
}
To learn more about how to embed widgets into a dashboard, check out this documentation. The embedded widget will be rendered as shown in the following.
Creating a pinboard
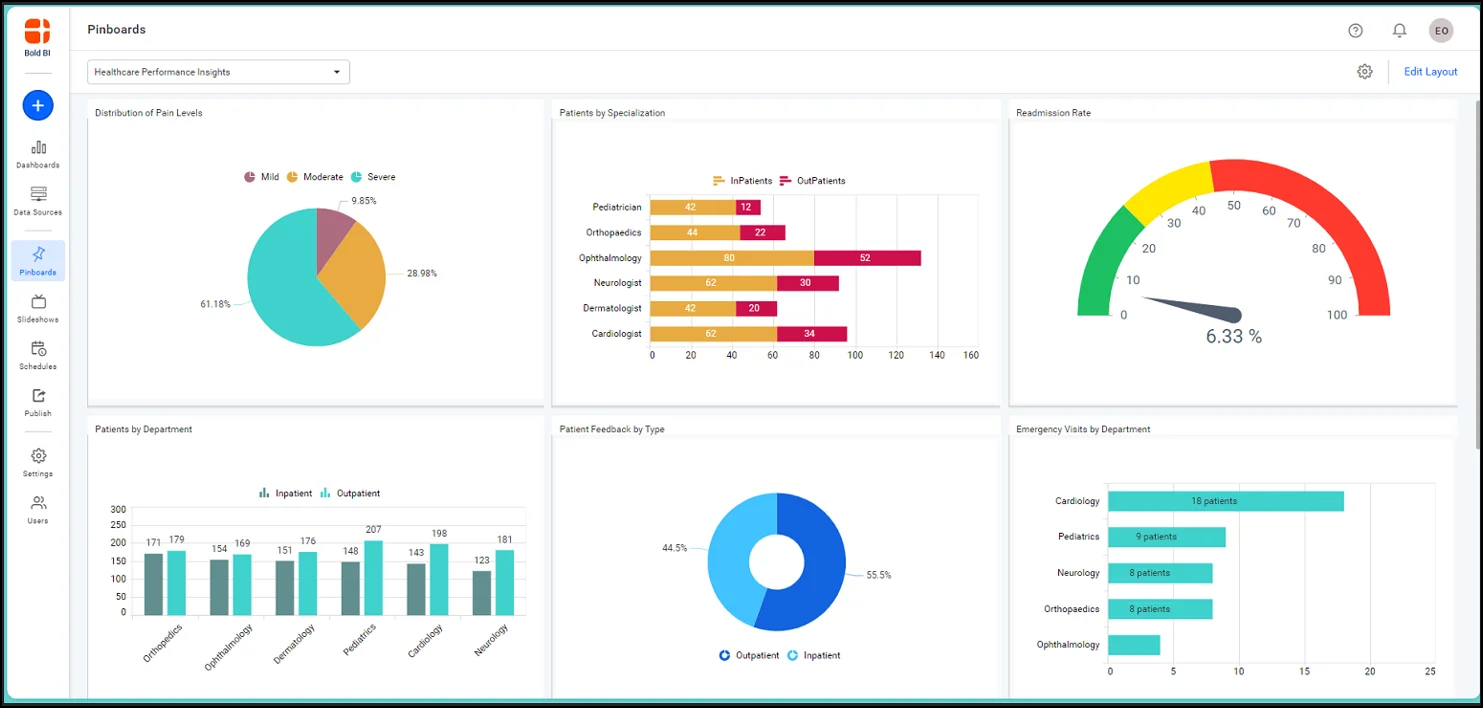
The application administrator can display a pinboard to track key metrics as part of their application default view. Pinboards let users pin widgets from multiple dashboards, their own and their coworkers’ (to which they have access), to build a comprehensive board more quickly. Healthcare administrators can pin the widgets they need regularly or just to answer specific questions.
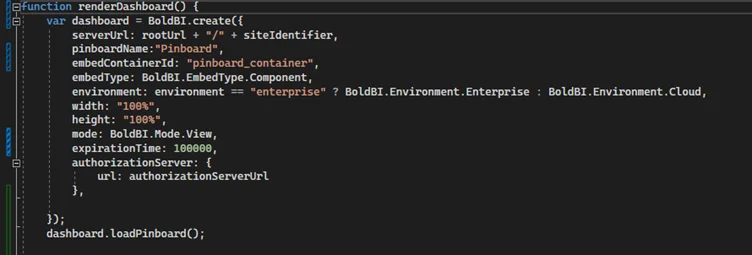
To add a pinboard, create a Bold BI instance with required properties in the body tag. Then, use the onload attribute to call the loadPinboard() method, as illustrated in the following snippet.
function renderDashboard() {
    var dashboard = BoldBI.create({
        serverUrl: rootUrl + "/" + siteIdentifier,
        pinboardName: "Pinboard",
        embedContainerId: "pinboard_container",
        embedType: BoldBI.EmbedType.Component,
        environment: environment == "enterprise" ? BoldBI.Environment.Enterprise : BoldBI.Environment.Cloud,
        width: "100%",
        height: "100%",
        mode: BoldBI.Mode.View,
        expirationTime: 100000,
        authorizationServer: {
            url: authorizationServerUrl
        }
    });
    dashboard.loadPinboard();
}
To learn more on pinboards, check out this tutorial video.
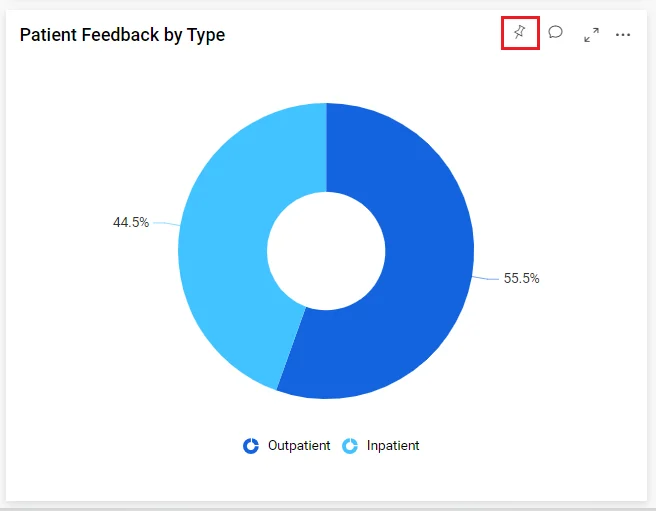
To add widgets to the selected pinboard, follow these steps:
- To add a widget from a dashboard to your pinboard, click the pin icon in the widget’s upper-right corner.

Creating a pinboard - Then select Existing next to Pinboard. Click Pin.
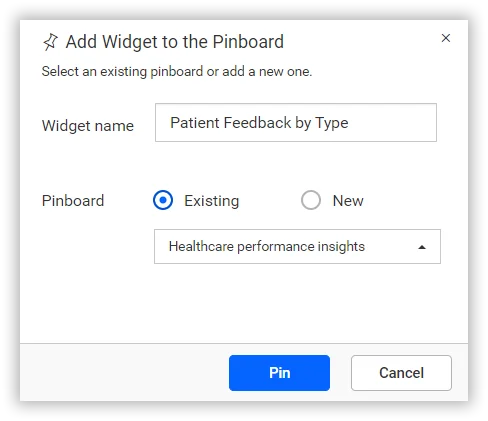

Adding widgets to a pinboard
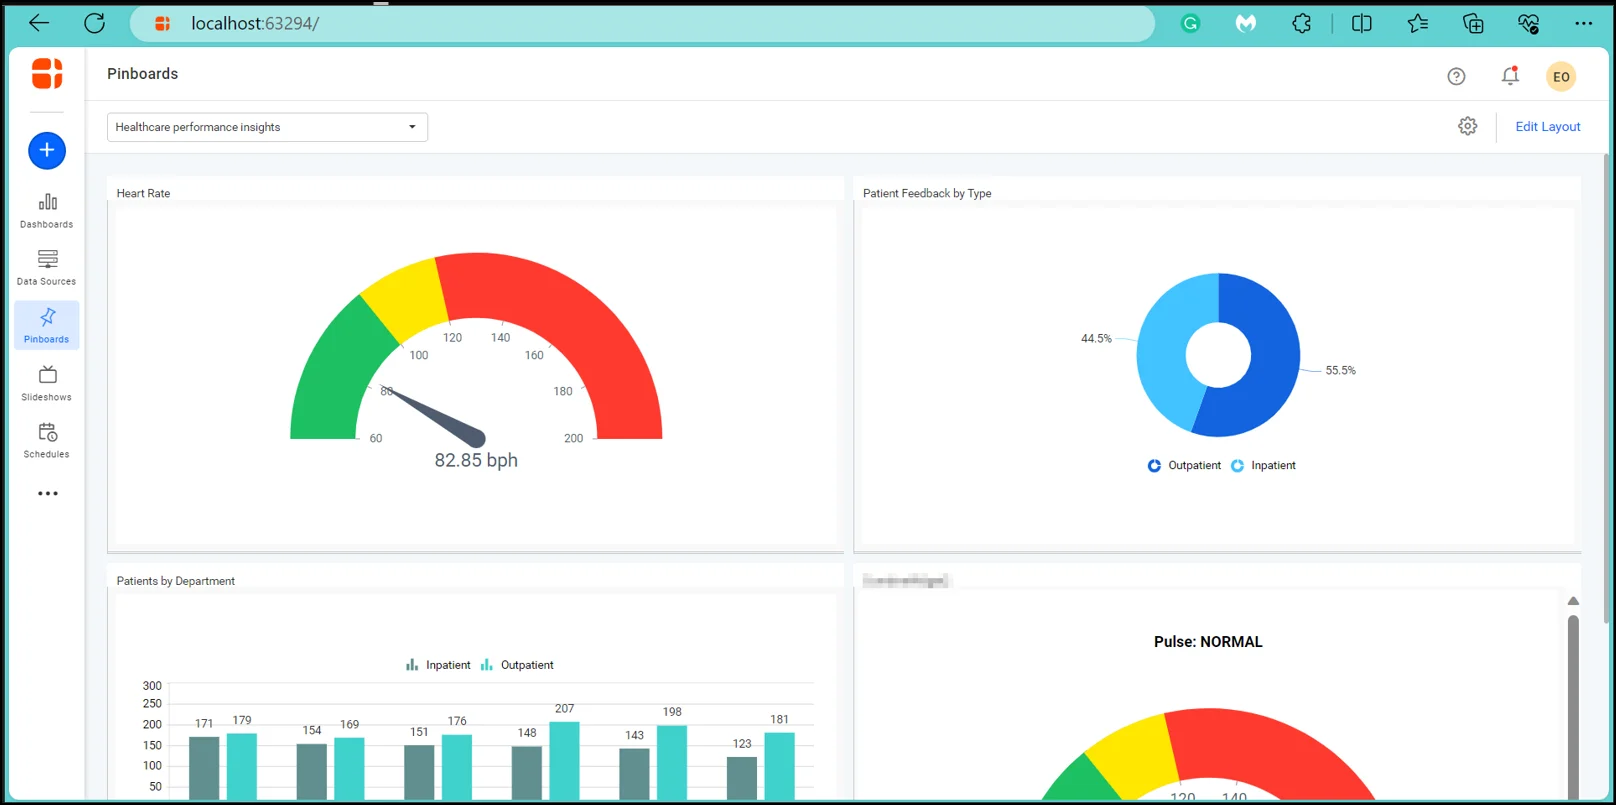
The embedded pinboard will render the added widget, as shown in the image.
Changing the theme of the dashboard
Once the dashboard is embedded in the application, the application administrator can customize the dashboard theme to match the application and their organization’s branding. This can be done by creating a BoldBI instance to call that function in the body using the onload attribute as shown in the following code sample.
function renderDashboard(dashboardId) {
    this.dashboard = BoldBI.create({
        serverUrl: rootUrl + "/" + siteIdentifier,
        dashboardId: dashboardId,
        embedContainerId: "dashboard",
        mode: BoldBI.Mode.View,
        embedType: embedType,
        environment: environment,
        width: "100%",
        height: "100%"
        expirationTime: 10000,
        authorizationServer: {
            url: authorizationServerUrl
        },
        dashboardSettings: {
            themeSettings: {
                appearance: "dark"
            }
        }
    });
    this.dashboard.loadDashboard();
}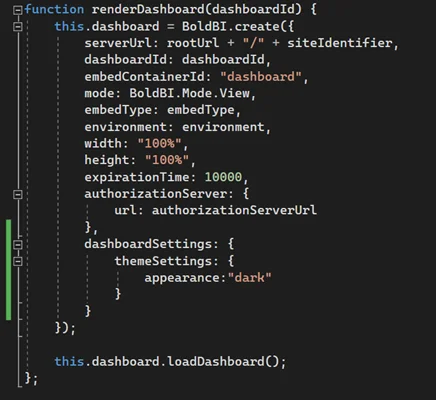
The custom-themed dashboard will render in the application as shown.
The Bold BI®application also lets healthcare administrators personalize their application visual aesthetics through application theme customization in the Look and Feel settings section. The application’s theme settings include branding, typography, backgrounds, buttons, and interface elements. The theme files must be uploaded to the Bold BI server to work.
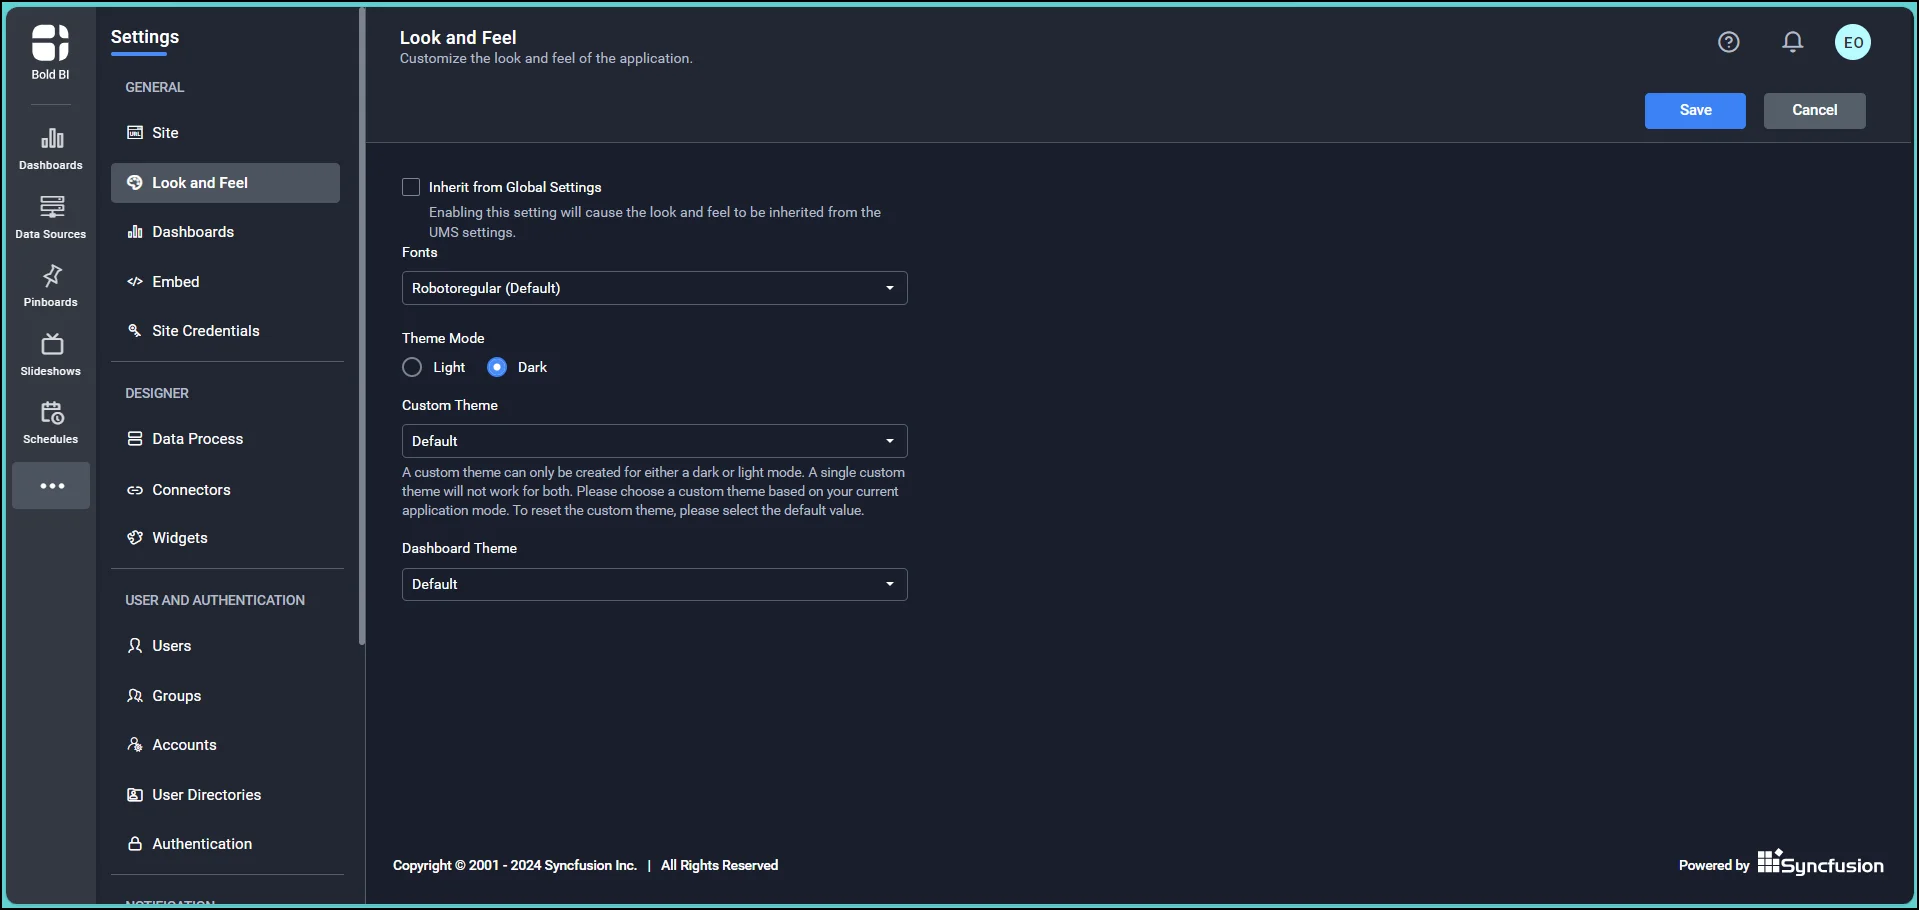
The administrator can also create a custom application theme or a dashboard theme. Creating a custom application theme in Bold BI involves navigating to the settings page and selecting the Themes tab. There, customize the primary, secondary, text, and background colors and add elements like a header, footer, sidebar, and widgets.
To create a custom dashboard theme in Bold BI, we use variable values to define visual elements and styling attributes. This ensures a cohesive and consistent style across multiple dashboards, thereby simplifying maintenance and application within the platform.
Explore more Bold BI features, such as layout settings, row-level filtering, and event handling in our samples.
In conclusion, IT specialists can embed self-service BI in their company’s everyday applications once and make data analytics accessible to their coworkers of all backgrounds and skill levels. This shift empowers individuals throughout an organization to harness the power of data for better decision-making.
If you have any questions or need assistance, don’t hesitate to reach out through the Bold BI website; simply log in to submit your inquiries if you already have an account. If you’re not yet a customer, get started with Bold BI now by signing up for a free trial!


