


Introduction
In sales management, tracking key metrics is crucial for understanding market trends and making informed business decisions. This is especially true when using a CRM like Copper, where data-driven insights can significantly impact your bottom line. With a comprehensive sales opportunities dashboard, you can visualize and analyze essential metrics to streamline your sales processes. In this blog, we will delve into the Copper Sales Opportunities Dashboard, highlight its configuration, discuss best practices for leveraging its features, and identify the five key metrics you should be tracking.
What is the Copper Sales Opportunities Dashboard?
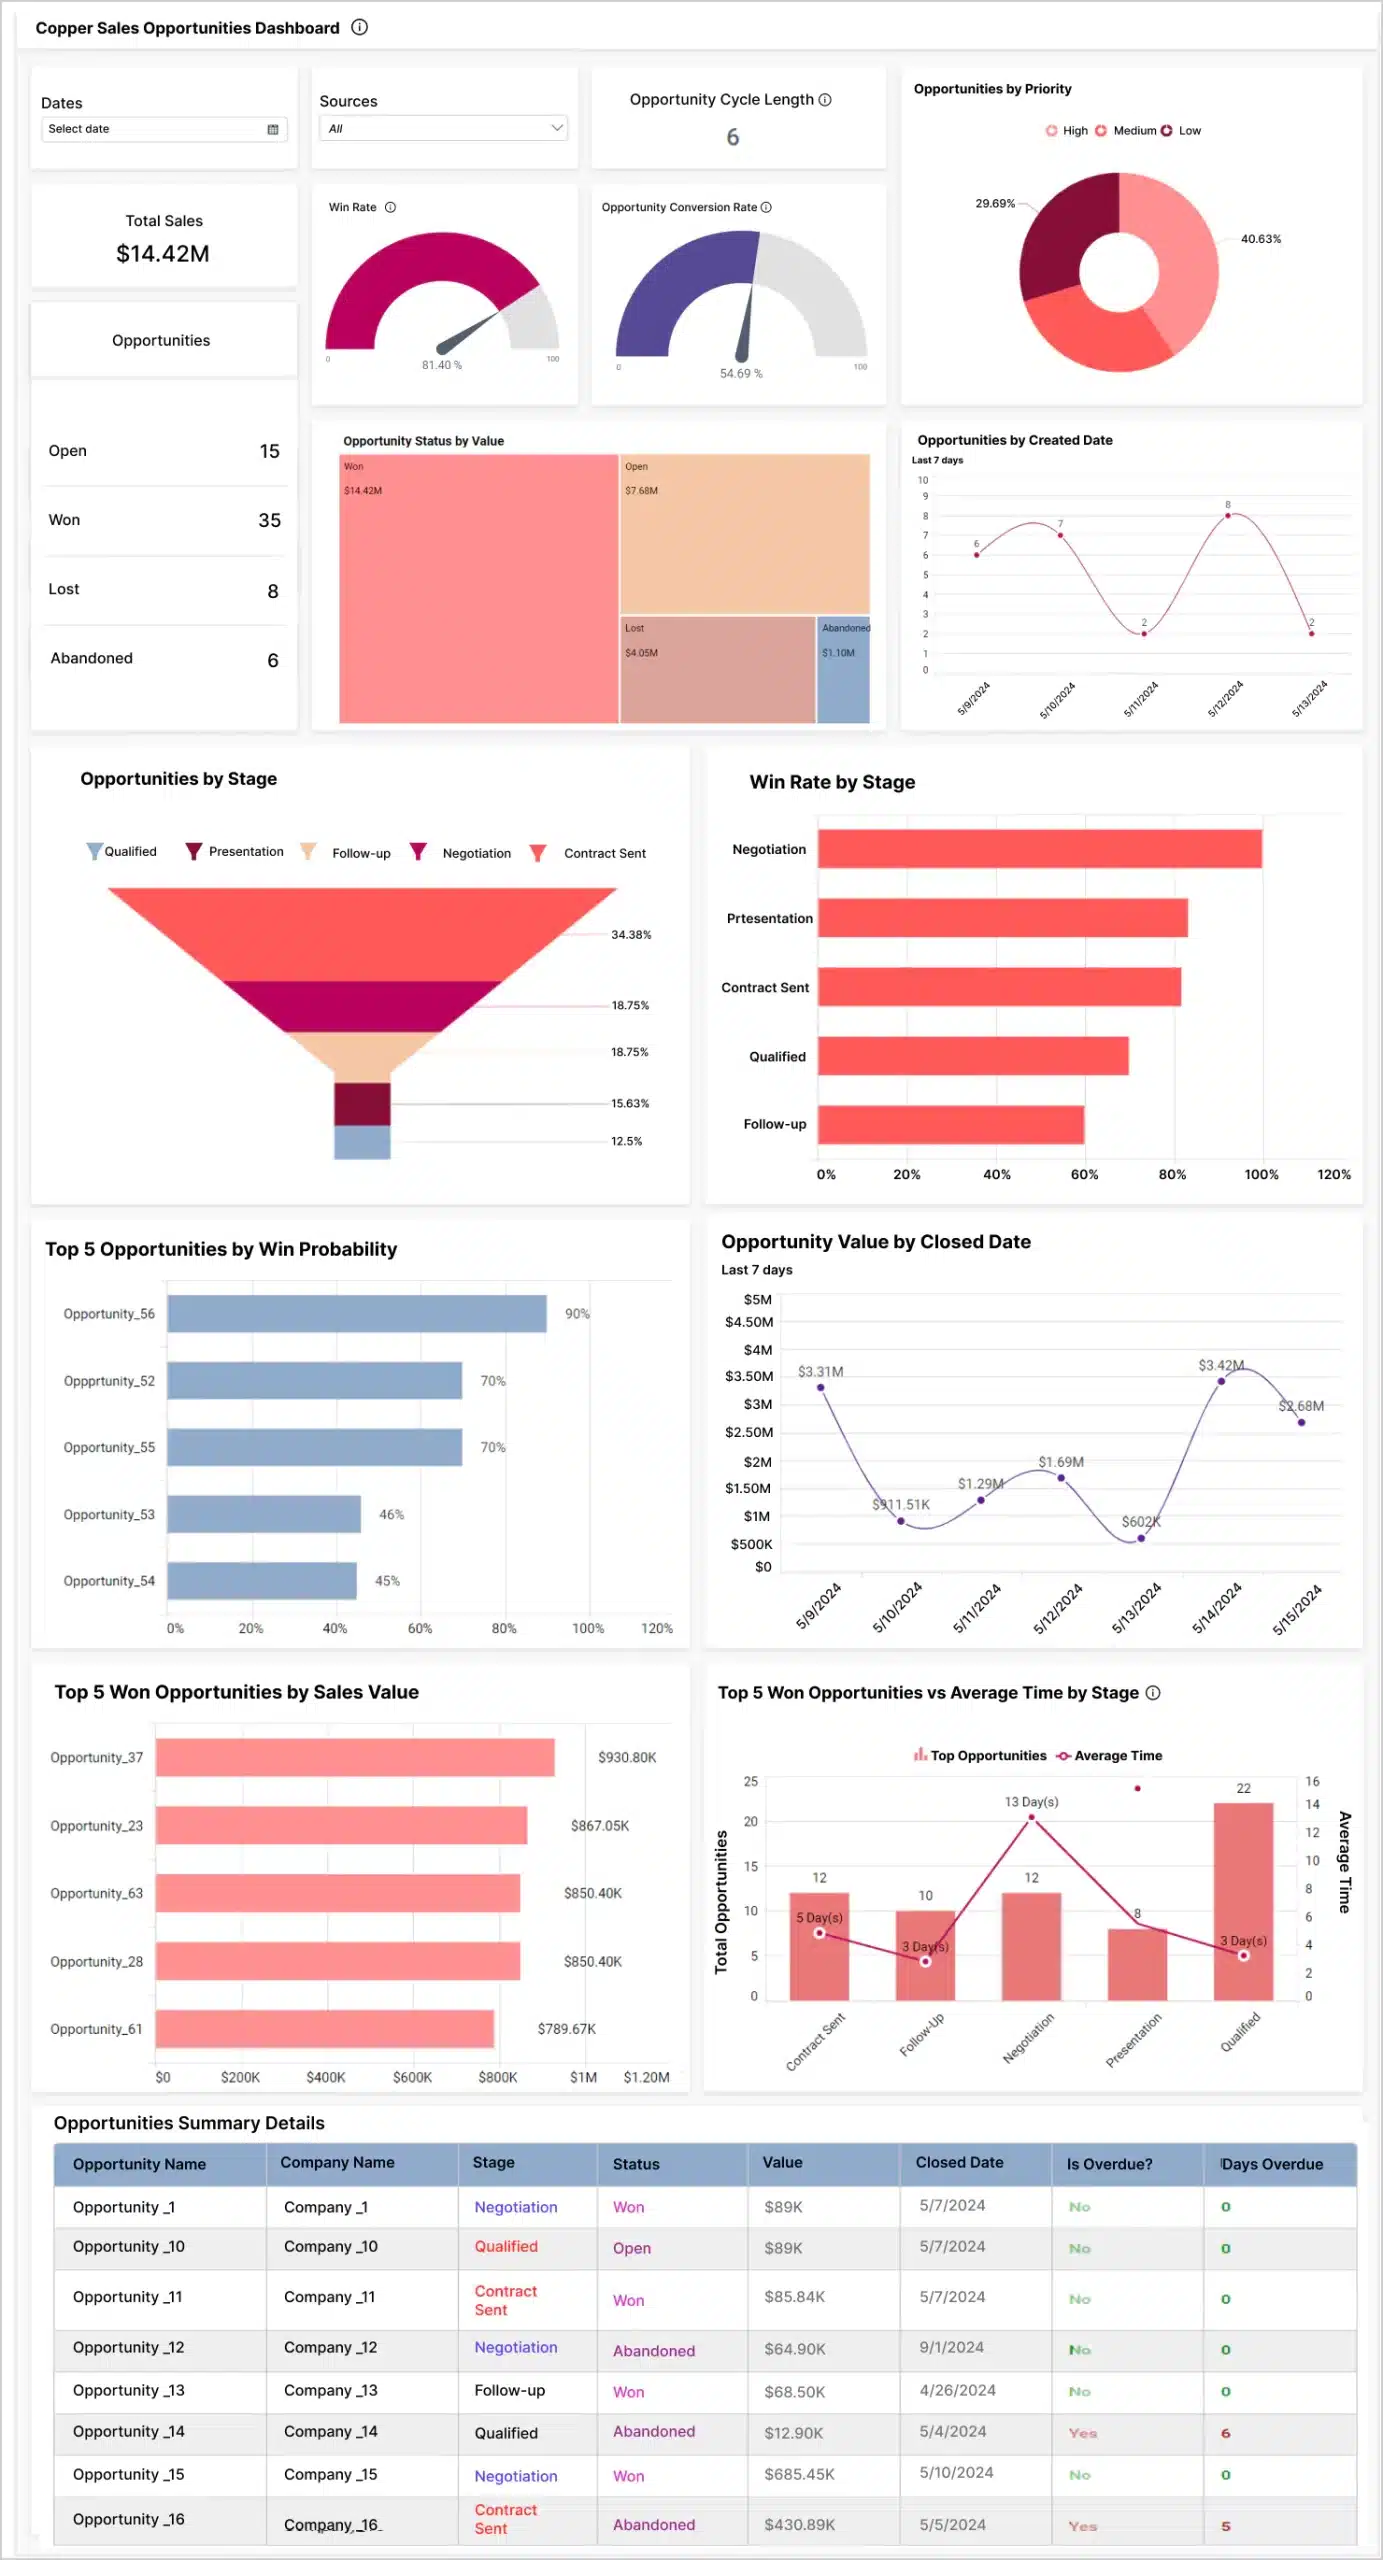
The Copper Sales Opportunities Dashboard enables sales managers and business owners to monitor their company’s sales performance by presenting and visualizing various KPIs and metrics, including total opportunities, sales, open opportunities, won opportunities, lost opportunities, abandoned opportunities, and summary details.
5 important key metrics to track in sales opportunities
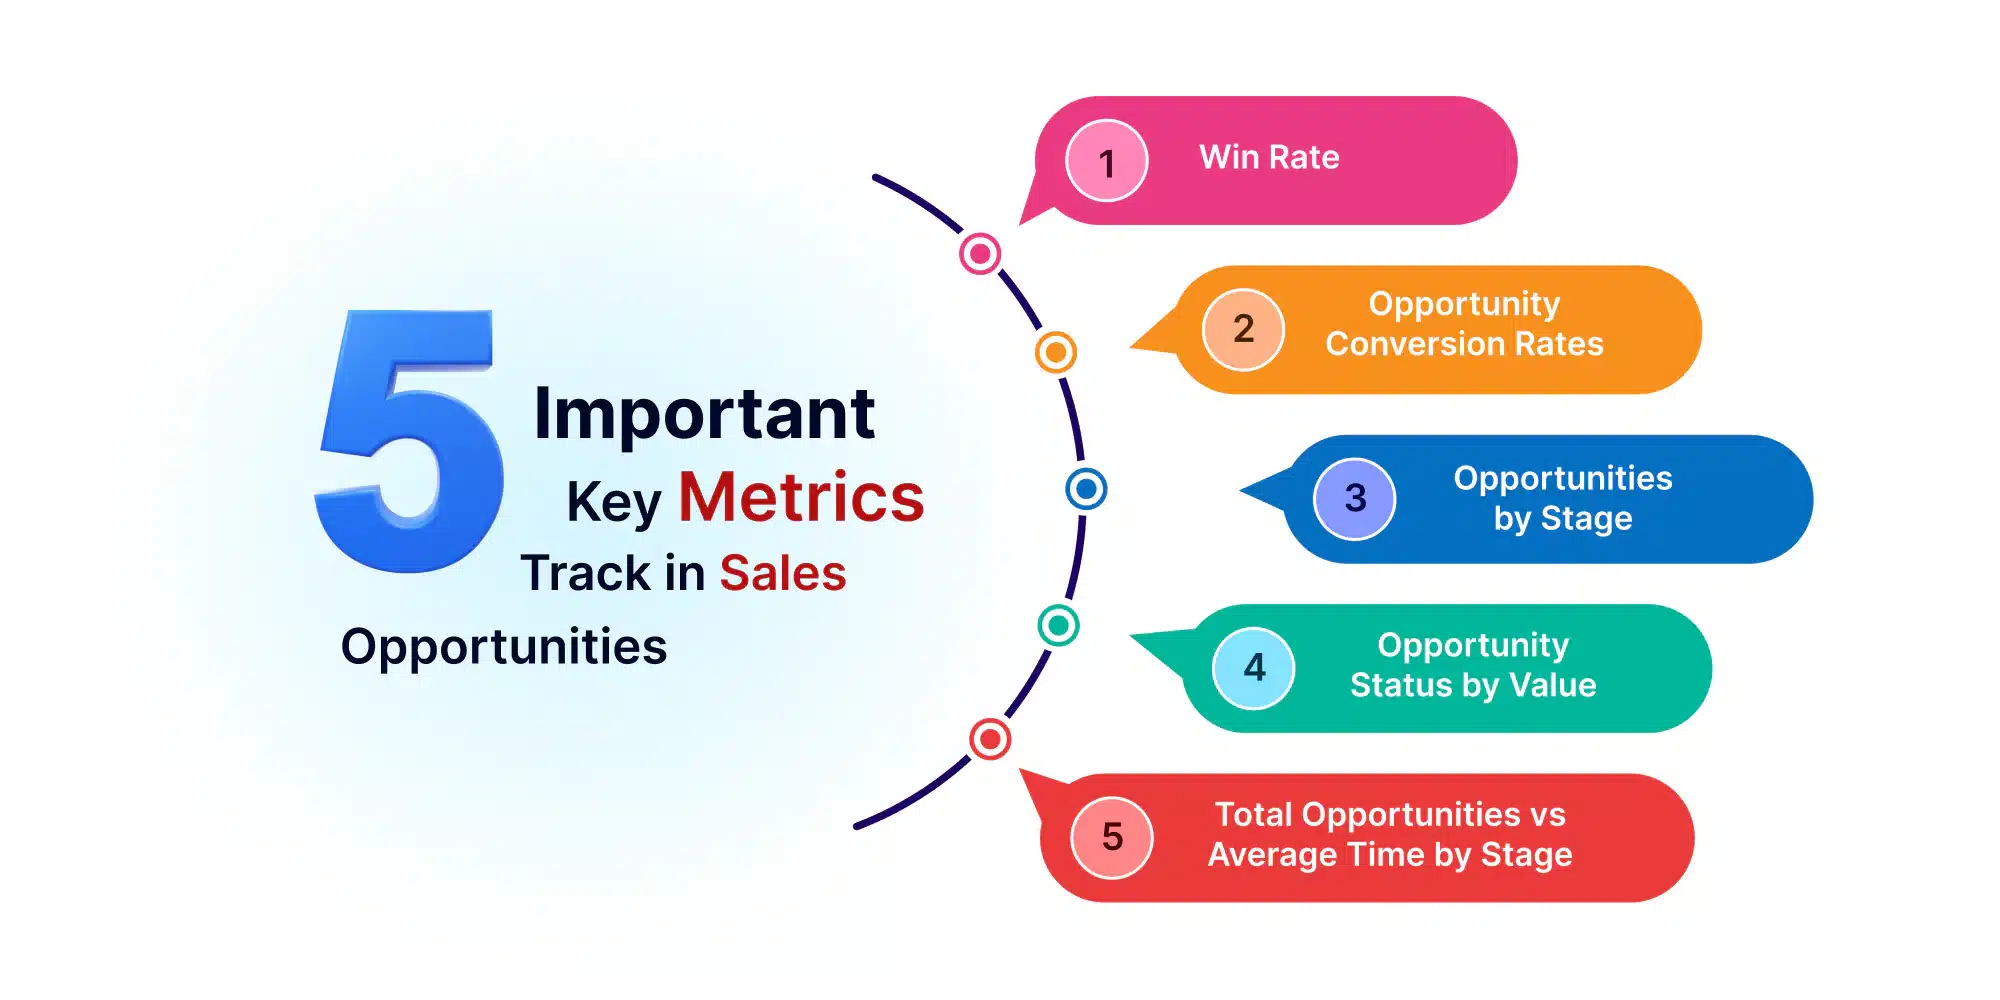
To effectively manage and optimize sales opportunities using your own Copper sales opportunities dashboard, it is crucial to track certain key metrics. Here are five important metrics to focus on:
Win rate
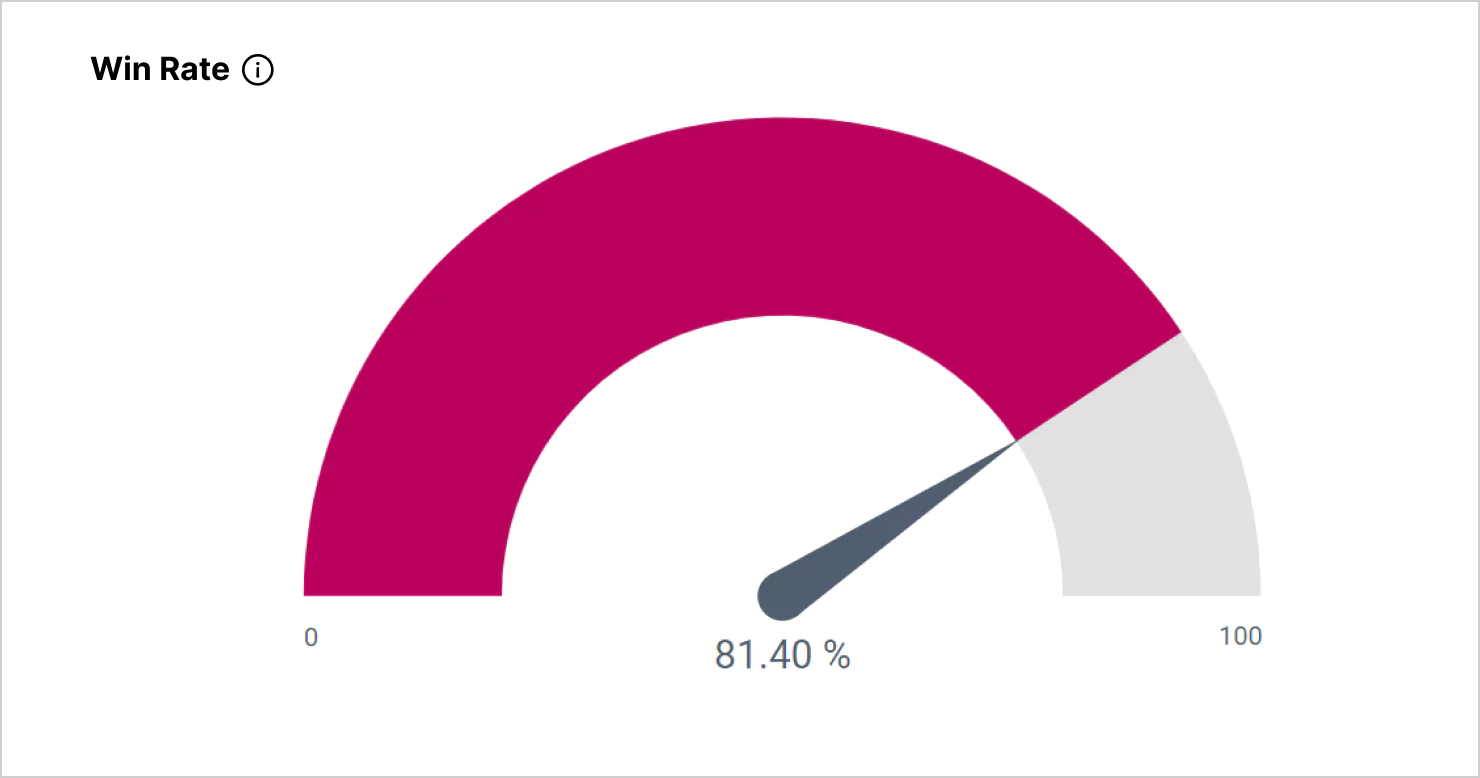
The win rate metric measures the percentage of closed deals out of total opportunities, aiding in the evaluation of sales performance, strategy, resource allocation, and revenue goals.
Opportunity conversion rate
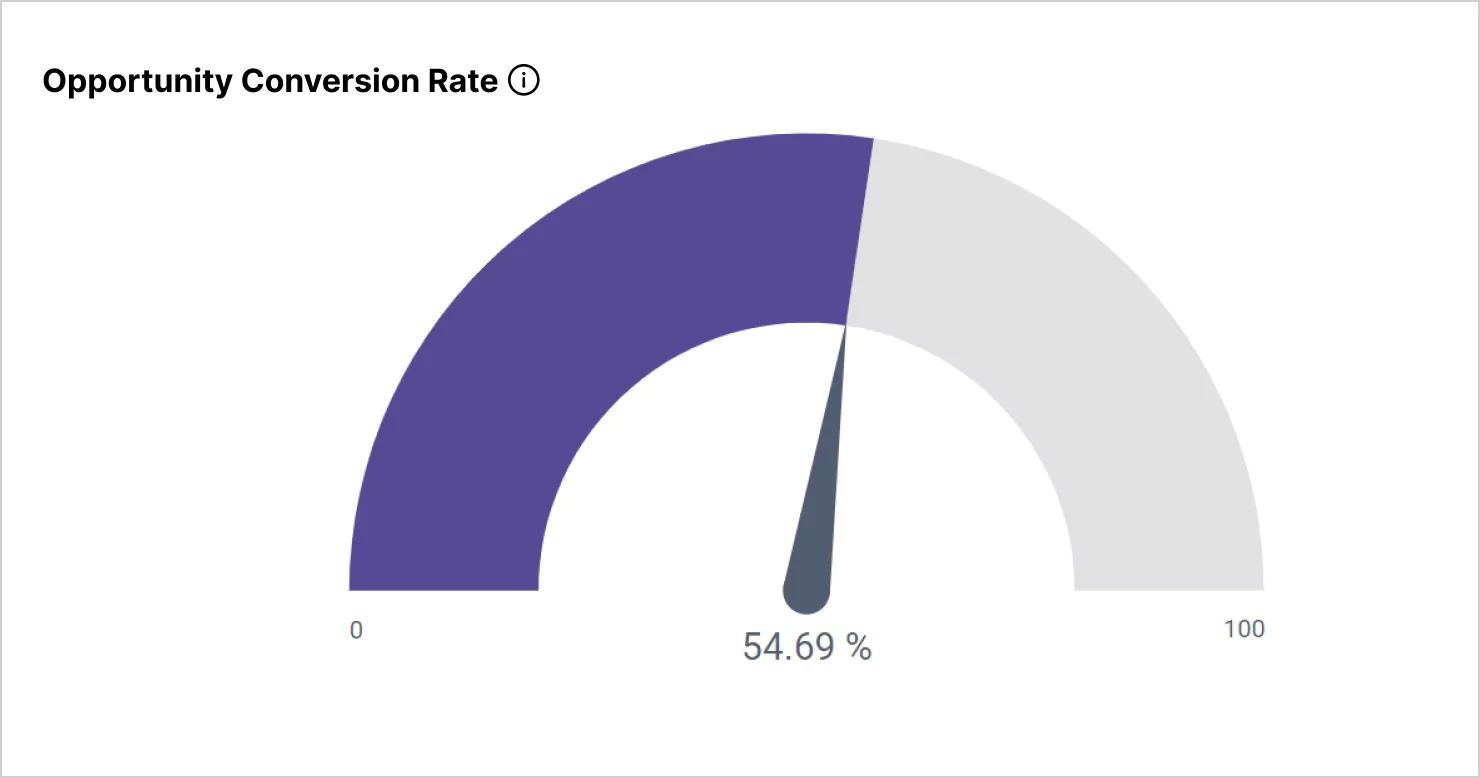
The opportunity conversion rate measures the percentage of sales opportunities that move from one stage to another. It provides insight into sales process effectiveness, informing sales teams whether their sales funnel is progressing healthily and informing managers whether strategies need to change.
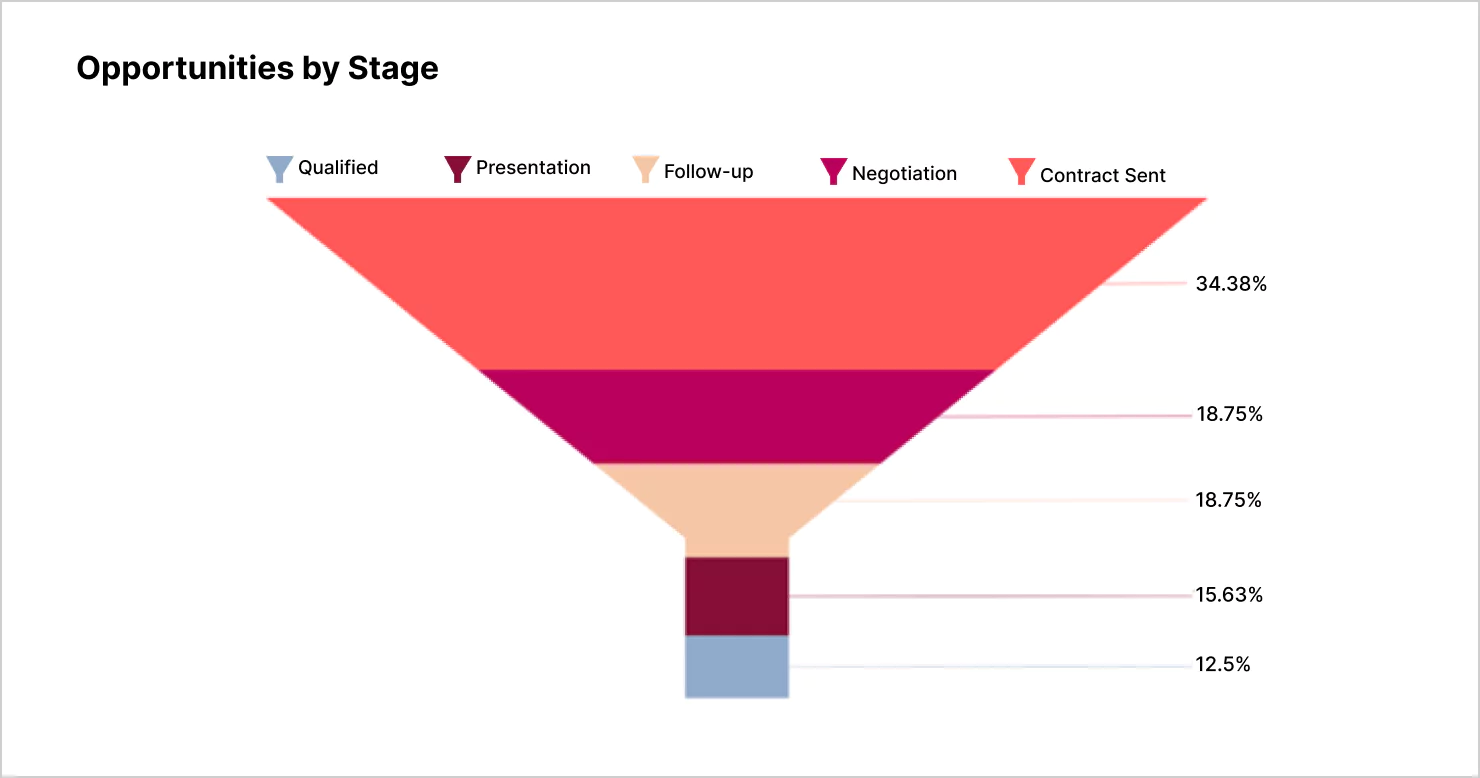
Opportunities by stage
The opportunities by stage metric categorizes sales opportunities based on their current stage in the sales pipeline. This enables sales teams to prioritize efforts and identify stages requiring more resources and focus, thereby improving sales performance.
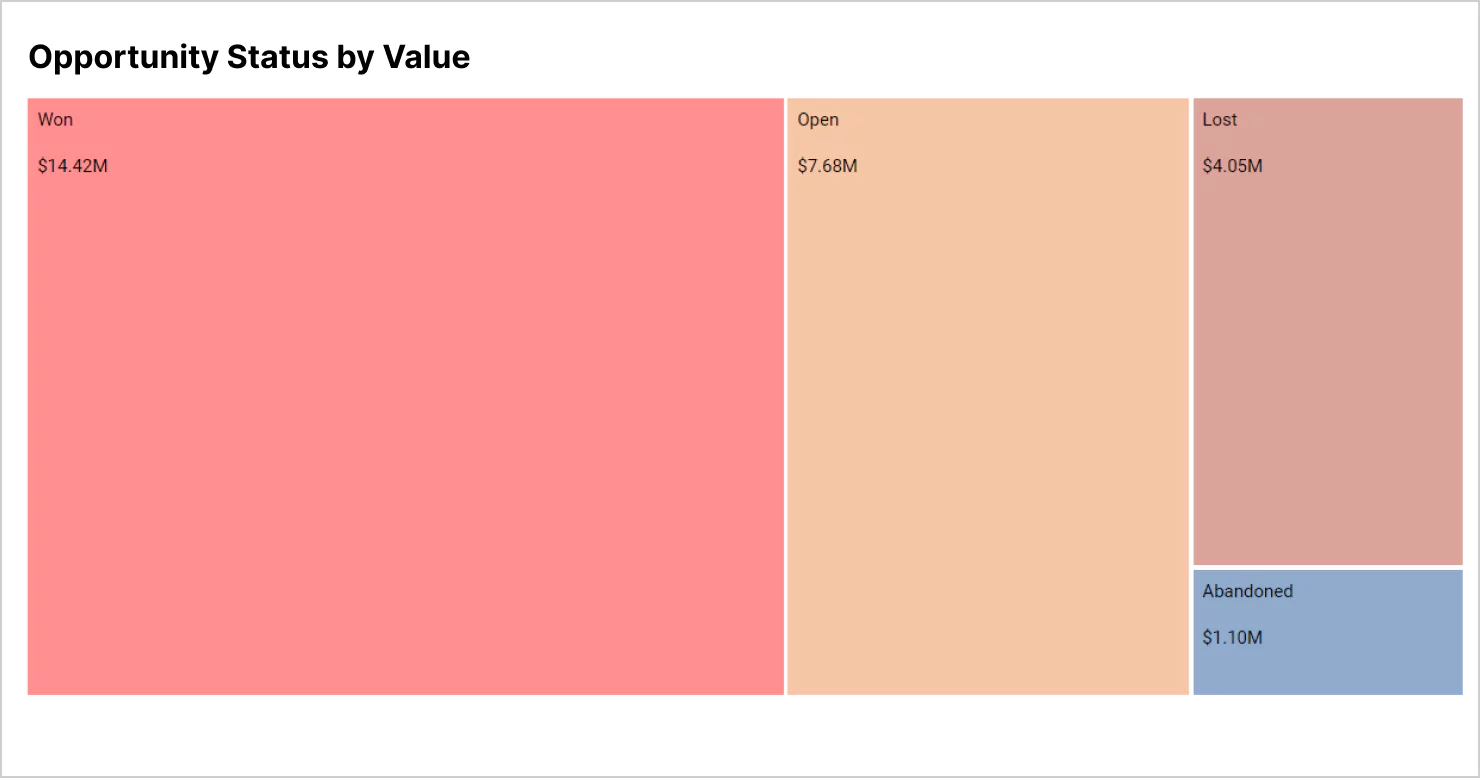
Opportunity status by value
The opportunity status by value metric provides a high-level financial perspective on sales opportunities. It enables sales teams to see how much revenue they have won and could still win from open opportunities, as well as how much revenue has been missed from lost and abandoned opportunities.
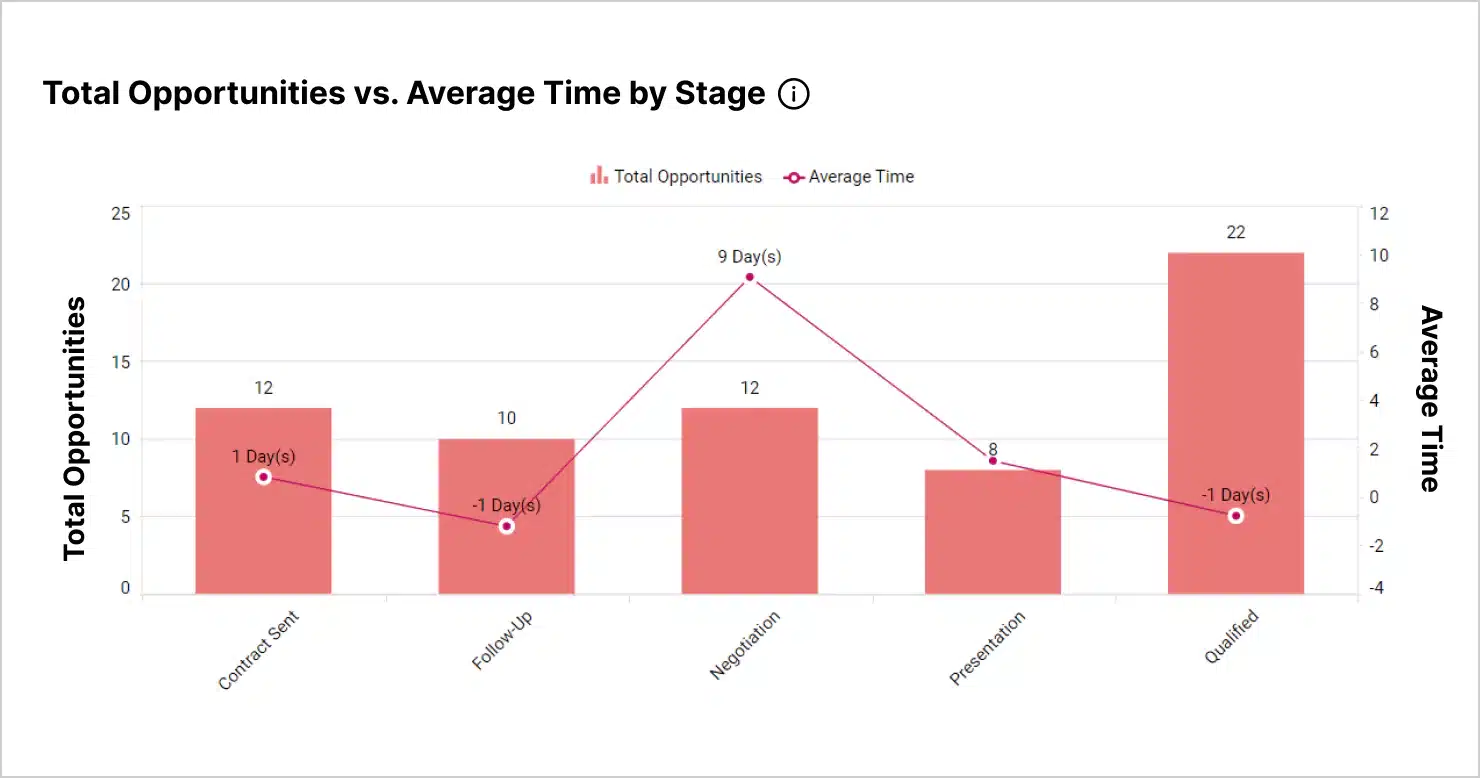
Total opportunities vs. average time by stage
The total opportunities versus average time by stage metric helps businesses identify stagnant deals and process inefficiencies, enabling them to streamline their sales process, reduce the average time spent in each stage, and accelerate the sales cycle.
How to design a Copper Sales Opportunities Dashboard in Bold BI
Designing a Copper sales opportunities dashboard in Bold BI® requires just a few key steps to ensure it effectively tracks and visualizes your team’s sales metrics for informed decision-making. Here’s how to design it:
- Navigate to the dashboard designer page, click the data source icon, and follow these steps to create the Copper integration data source.
- Next, drag and drop the widgets to the dashboard designer and design the dashboard with the available Copper sales data and metrics.
- Apply advanced settings to the widgets by adding filters, drill-down options, linking, and sorting features according to your requirements.
- Finally, preview and publish the Copper sales opportunities dashboard. You can view our sample Copper dashboard on our website.
Benefits and use cases of the Copper Sales Opportunities Dashboard
Monitor sales effectiveness
Understanding the win rate helps organizations measure the effectiveness of their sales strategy and the performance of their sales team. Higher win rates indicate a successful sales approach. Sales managers can identify the winning aspects of deals and replicate them across the team. Training programs can be tailored to improve areas with lower win rates.
Improved funnel efficiency
Opportunity conversion rate indicates the percentage of opportunities that are converted into sales. It helps identify the effectiveness of the sales strategy and pinpoint where prospects drop off. Sales teams can focus on improving the sales process to increase conversions. Marketing efforts can be aligned to generate more qualified leads with a higher likelihood of conversion.
Enhanced pipeline visibility
Tracking opportunities by stage provides visibility into the sales pipeline and helps identify bottlenecks. Sales teams can prioritize efforts on stages with more opportunities to move them forward, and resources can be allocated more efficiently to stages that require more attention.
Accurate revenue forecasting
By analyzing the value of opportunities at different stages or statuses, companies can forecast revenue more accurately and manage cash flow more effectively. Financial planning and budgeting become more informed. Sales strategies can be adjusted to focus on higher-value opportunities to maximize revenue.
Streamlined sales cycle
The total opportunities versus average time by stage comparison helps teams understand how long opportunities typically remain at each stage and provides insight into the length of the sales cycle. Sales processes can be streamlined by identifying stages that cause delays and implementing measures to expedite movement through the pipeline. Training can be provided to improve the speed of progression at each stage.
Conclusion
A Copper sales opportunities dashboard provides businesses valuable insights into their sales performance and pipeline health by tracking key metrics like win rate, opportunity cycle length, and opportunity conversion rate. Ready to harness the power of data-driven sales management? Start tracking these metrics today with Copper CRM and Bold BI®. Sign up for a free trial of Bold BI to explore our dashboard capabilities. For more information, visit our website or contact our support team for more assistance. Drive your sales success with actionable insights from Bold BI.


