Introduction
Monitoring team performance in call centers is crucial for delivering exceptional customer service. Key performance indicators (KPIs) offer valuable insights into operational effectiveness and customer satisfaction. In this blog, we’ll explore the top 6 call center KPIs that empower managers to optimize performance, enhance service quality, and drive continuous improvement.
What are Call Center KPIs?
Call center KPIs are measurable metrics that evaluate a call center’s performance in achieving its objectives. These indicators help assess various aspects of call center operations, including efficiency, productivity, customer satisfaction, and service quality. Common call center KPIs include metrics such as first call resolution (FCR), customer satisfaction score (CSAT), service level, abandonment rate, and more.
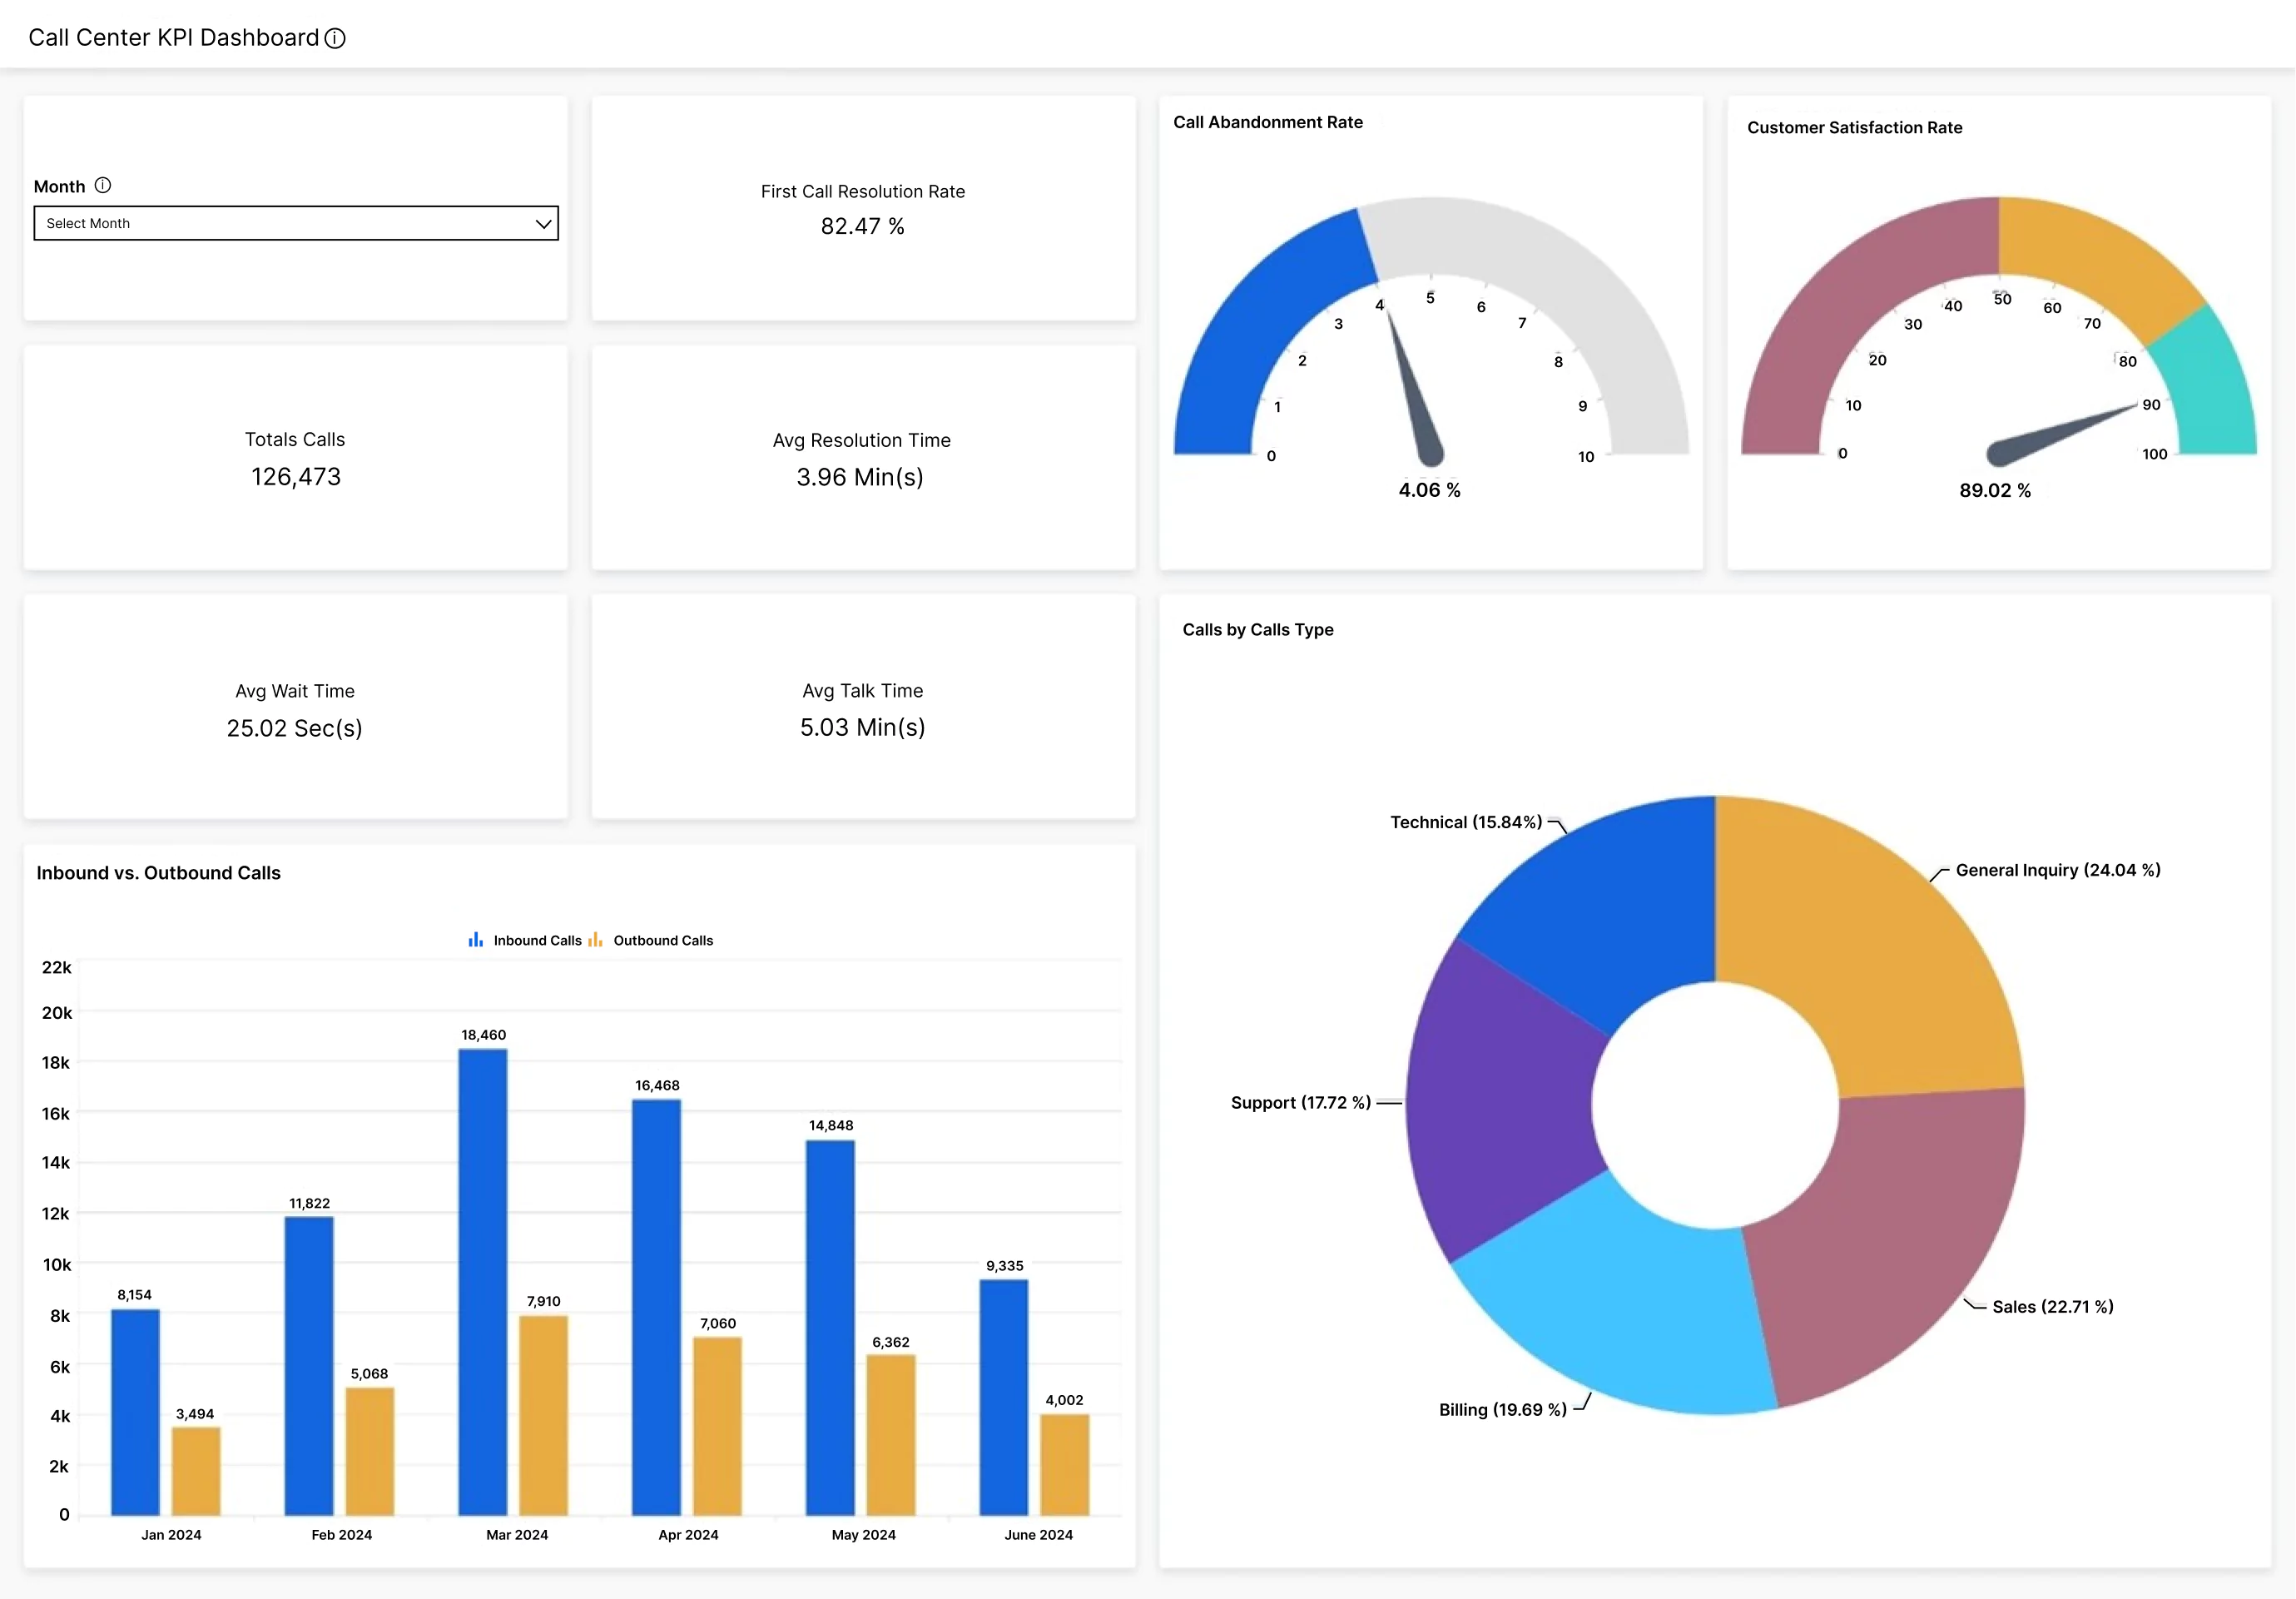
To learn more, check out our Call Center KPI Dashboard. Explore additional call center dashboards on our website to enhance your team’s efficiency and customer satisfaction.
Why is it important to track call center KPIs?
Performance monitoring: KPIs provide a clear view of how well a call center is performing, identifying strengths and weaknesses.
Operational efficiency: Metrics like average handling time (AHT) optimize resource allocation and improve call handling efficiency.
Customer satisfaction: KPIs such as first call resolution (FCR) and customer satisfaction score (CSAT) directly measure and improve customer experience.
Employee performance: Tracking KPIs helps evaluate individual and team performance, guiding training and development efforts.
Strategic decision-making: KPI trends inform decisions on staffing, technology investments, and process improvements to effectively meet business objectives.
Top 6 call center KPIs you should track
Tracking key performance indicators (KPIs) in a call center is crucial for monitoring team performance and improving customer satisfaction. Here are six important KPIs to consider:
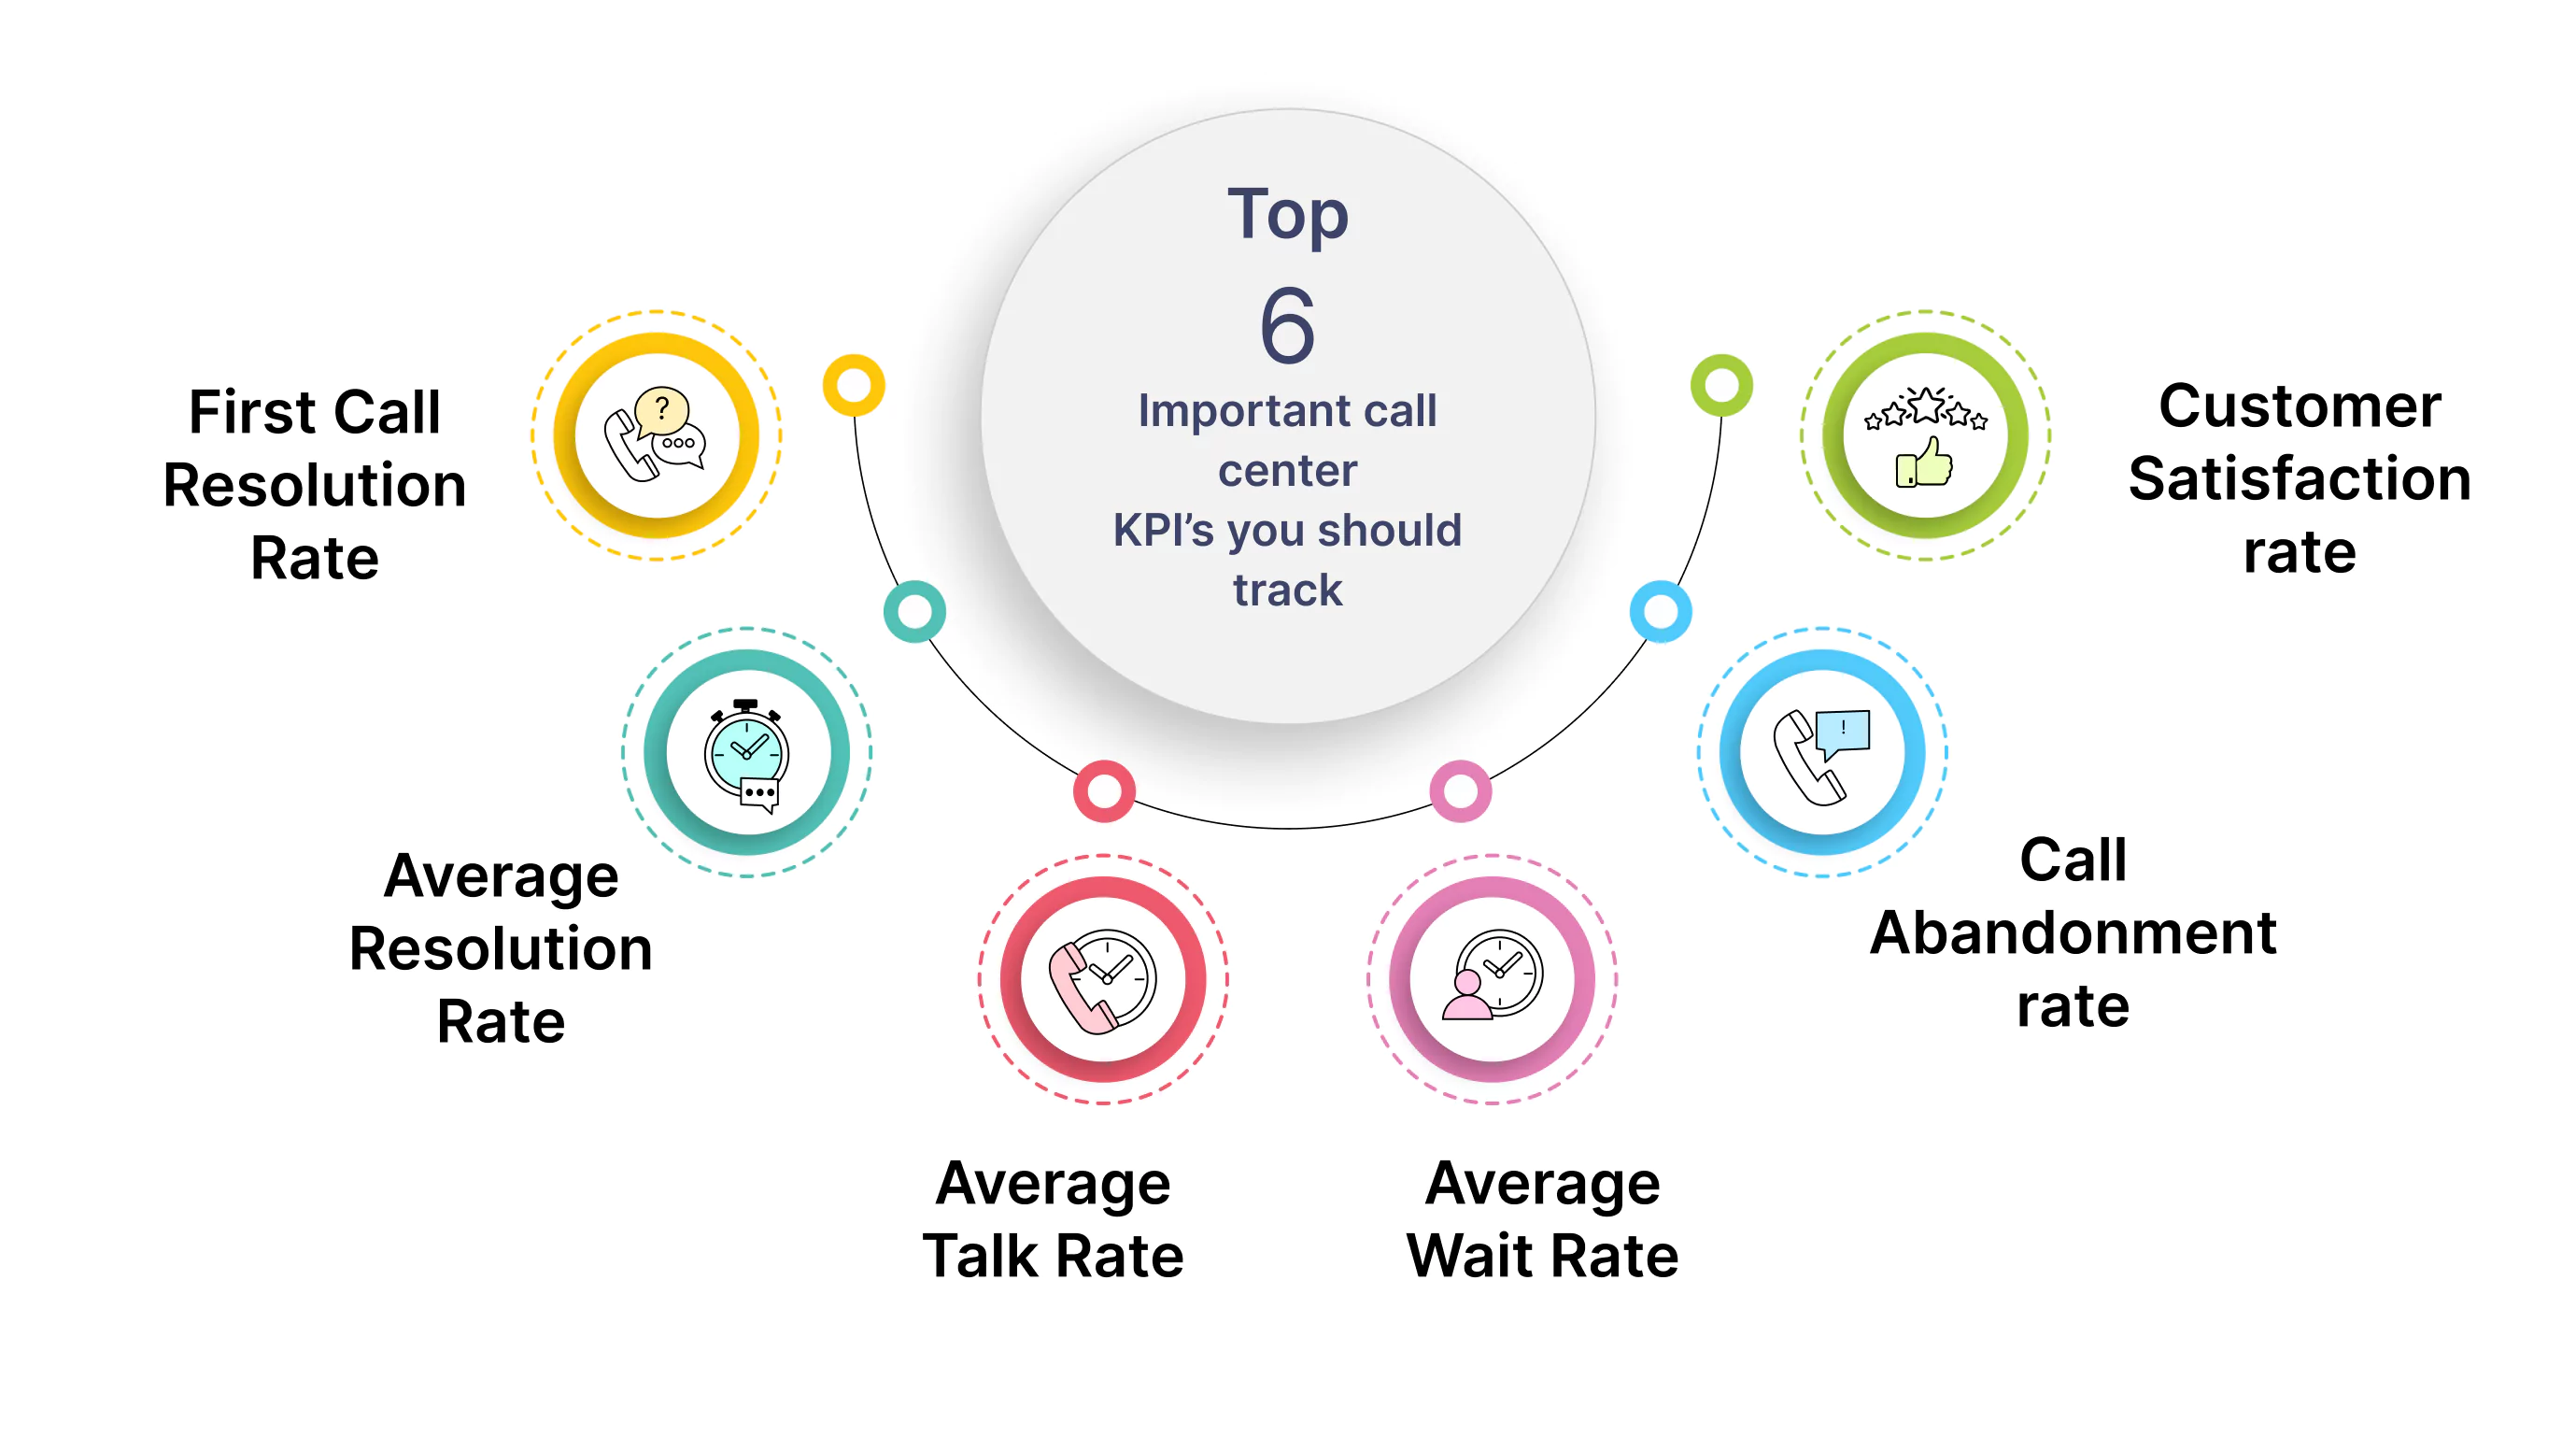
First call resolution (FCR) rate
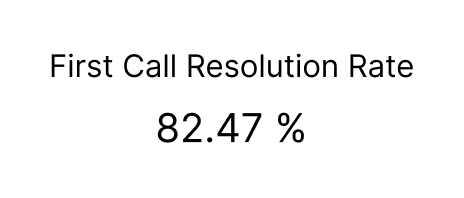
This metric measures the percentage of calls that are resolved on first interaction without the need for follow-up. High FCR rates indicate effective problem-solving, leading to higher customer satisfaction and reduced operational costs. The formula is:
FCR Rate = (Number of Calls Resolved on First Contact/Total Number of First Contacts) X 100
Example:
If a call center received 1,000 calls in a month and 850 of those calls were resolved on the first contact, the FCR rate would be:
FCR Rate = (850/1000) X 100 = 85%
Average resolution time (ART)
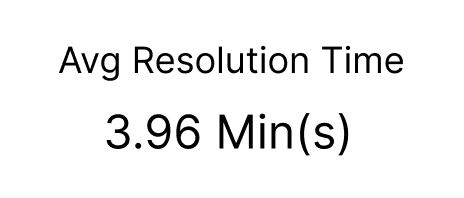
This is the average time taken to resolve a customer’s issue, from the initial contact to the final resolution. Shorter resolution times typically indicate efficient handling of customer issues, improving customer satisfaction and operational efficiency. It is calculated as:
Average Resolution Time = Total Time to Resolve All Issues/Total Number of Issues Resolved
Example:
If a call center resolved 500 issues in a month and the total time taken to resolve these issues was 1,000 minutes, the ART would be:
Average Resolution Time = 1000/500 = 2 mins
Average talk time
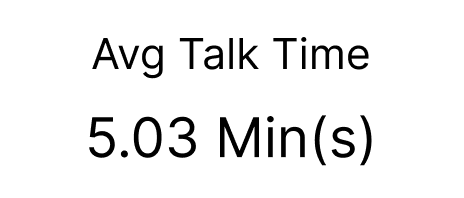
This metric measures the average duration an agent spends talking to a customer during a call. It assesses agent efficiency and identifies areas where agents may need additional training or support to handle calls more effectively. It is calculated as:
Average Talk Time = Total Talk Time/Total Number of Calls
Example:
If a call center had a total talk time of 25,000 minutes in a month and handled 2,000 calls, the ATT would be:
Average Talk Time = 25000/2000 = 12.5 mins
Average wait time
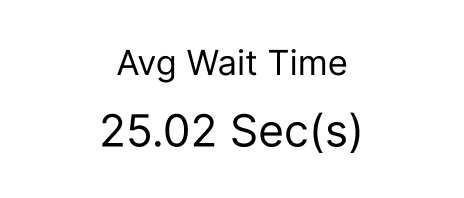
This metric shows the average time a customer waits on hold before being connected to an agent. Lower wait times are crucial for maintaining customer satisfaction and reducing call abandonment rates. The formula is:
Average Wait Time = Total Wait Time/Total Number of Calls
Example:
If a call center had a total wait time of 10,000 minutes in a month and handled 5,000 calls, the AWT would be:
Average Wait Time = 10000/5000 = 2 mins
Customer satisfaction rate (CSAT)
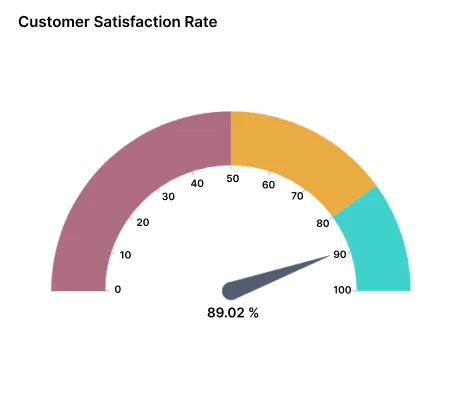
Customer satisfaction rate measures the satisfaction level of customers after their interaction with the call center based on customer feedback surveys. It directly reflects the quality of service provided and highlights areas for improvement to enhance customer experience. It is calculated as:
CSAT Rate = (Number of Satisfied Customers/Total Number of Survey Responses) X 100
Example:
If a call center received 1,000 survey responses in a month and 800 of those customers indicated they were satisfied with the service, the CSAT rate would be:
CSAT Rate = (800/1000) X 100= 80%
Call abandonment rate
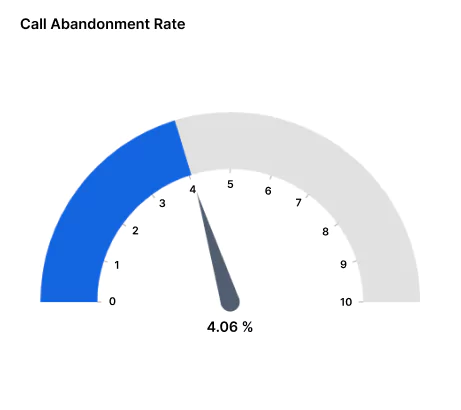
The call abandonment rate shows the percentage of callers who hang up before reaching an agent. A high abandonment rate can indicate issues such as long wait times or insufficient staffing, negatively impacting customer satisfaction and potential business outcomes. Its formula is:
Call Abandonment Rate = (Number of Abandoned Calls/Total Number of Incoming Calls) X 100
Example:
If a call center received 10,000 calls in a month and 1,000 of those calls were abandoned, the Call Abandonment Rate would be:
Call Abandonment Rate = (1000/10000) X 100= 10%
Tips for effective call center KPI tracking
Effective tracking of call center KPIs and metrics is crucial for optimizing performance and ensuring high levels of customer satisfaction. Here are some tips for effective KPI tracking:
- Align KPIs with business goals: Ensure the KPIs you track align with the broader objectives of the organization.
- Prioritize critical KPIs: Focus on the most critical KPIs that have the most significant impact on customer satisfaction and operational efficiency.
- Real-time monitoring: Monitor KPIs in real-time to quickly identify and address issues as they arise.
- Train and engage your team: Continuously train agents on the importance of KPIs and how their performance impacts overall goals.
- Conduct root cause analysis: Conduct root cause analysis to understand the underlying reasons behind KPI performance to identify areas for improvement.
- Incorporate customer feedback: Regularly gather and analyze customer feedback to complement KPI data and gain a comprehensive view of performance.
- Regular review and adjustment: Periodically review the effectiveness of your KPIs and adjust them as needed to reflect changing business priorities or market conditions.
Real-time benefits and use cases of call center KPIs
Accelerated issue resolution
Monitoring resolution times in real-time allows call centers to make swift adjustments, speeding up problem resolution. Quick fixes enhance customer satisfaction by minimizing the time customers spend waiting for solutions. This proactive approach ensures that issues are resolved efficiently, leading to a smoother and more pleasant customer journey.
Minimized wait times
Real-time wait time tracking enables quick adjustments to staffing and processes, reducing customer hold times. Faster connections lead to happier customers and improve their overall experience. By addressing wait times proactively, call centers can prevent frustration and keep callers engaged.
Reduced call drops
Monitoring abandonment rates in real-time allows call centers to adjust staffing levels or call routing to reduce dropped calls. Customers bene
fit from more timely assistance, and the organization experiences improved retention rates and customer satisfaction.
Boost customer satisfaction
Real-time first call resolution tracking empowers call centers to instantly tackle unresolved issues, significantly enhancing customer satisfaction. Customers directly benefit by having their issues resolved on the first call, while the organization saves costs by reducing the need for follow-up interactions and streamlining operations.
Try out all the features of Bold BI with 30-day free trial.Start Embedding Powerful Analytics
Conclusion
Comprehensive call center KPI tracking offers invaluable insights into your team’s performance by monitoring essential metrics like FCR rate, average resolution time, and customer satisfaction.
Ready to transform your call center operations with data-driven strategies? Start monitoring these KPIs today with Bold BI® dashboard solutions. Sign up for a free trial to explore our cutting-edge features and see how real-time insights can drive your team’s success.
For more information, visit our website or reach out to our support team for personalized assistance. Elevate your call center performance with actionable insights now.


