


Introduction
Advancements in artificial intelligence (AI) have ushered in an era of significant change across various industries. Integrating AI features for embedded analytics is particularly transformative, and Bold BI® is actively leading the charge in this transformation. By harnessing generative AI models equipped with natural language capabilities, Bold BI users will be able to automatically address queries, synthesize data trends, and generate more actionable insights, faster.
Bold BI recently unveiled a preview version of its first AI features: the Q&A widget and AI assistant. These features comprehend natural language input from users and subsequently generate Bold BI charts in response. To learn more about Bold BI’s Q&A widget, refer to this documentation.
In this blog, we’ll explore the roadmap of Bold BI’s AI assistant feature for embedded analytics. Read on for detailed insights.
Bold BI’s conversational AI assistant
Bold BI has launched a conversational AI assistant to address the growing need for quick, adaptable data analysis. This innovative system enhances dashboard creation and interaction by using natural language to generate relevant visualizations within the dashboard designer, viewer, and embedded application, making data exploration accessible and intuitive.
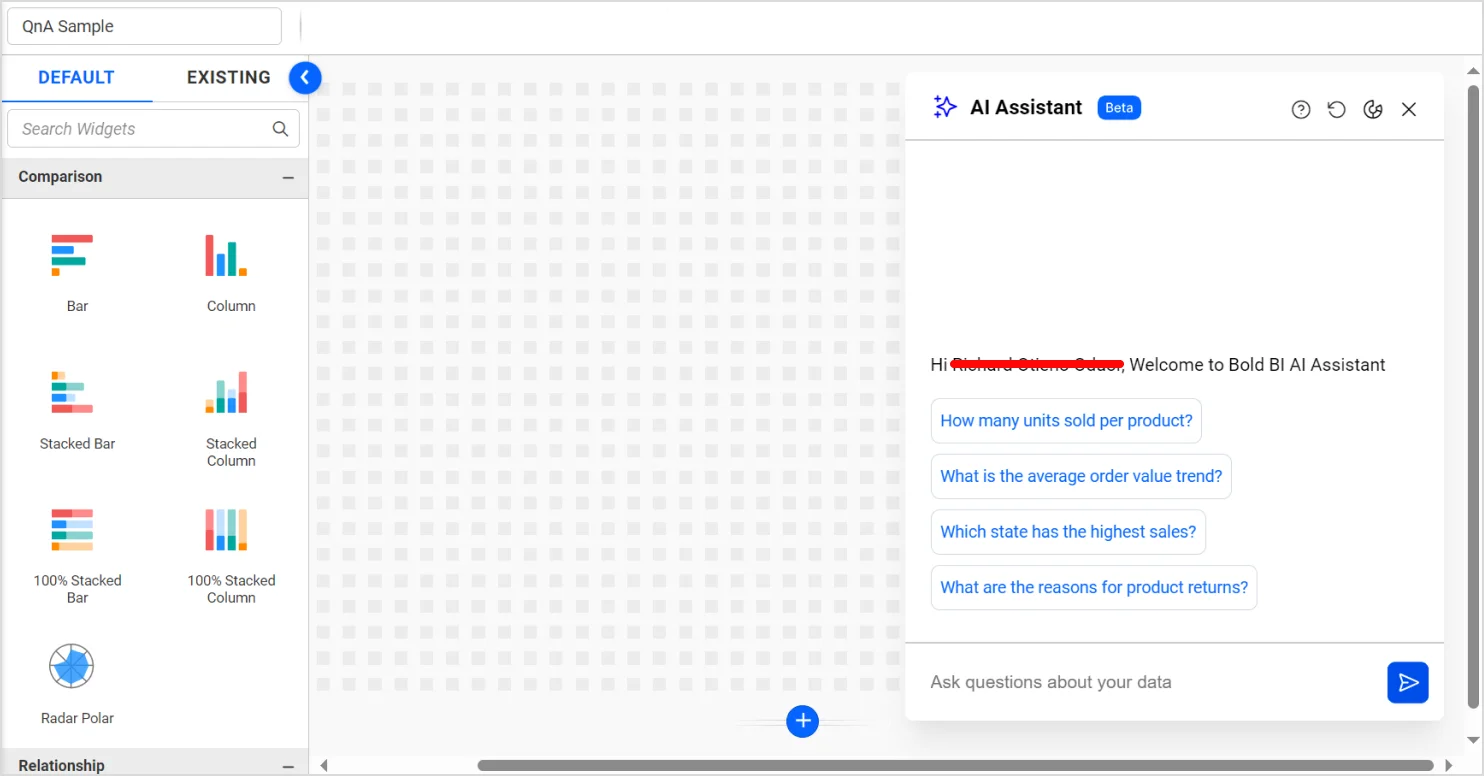
With this feature, you can:
a. Visualize prompts
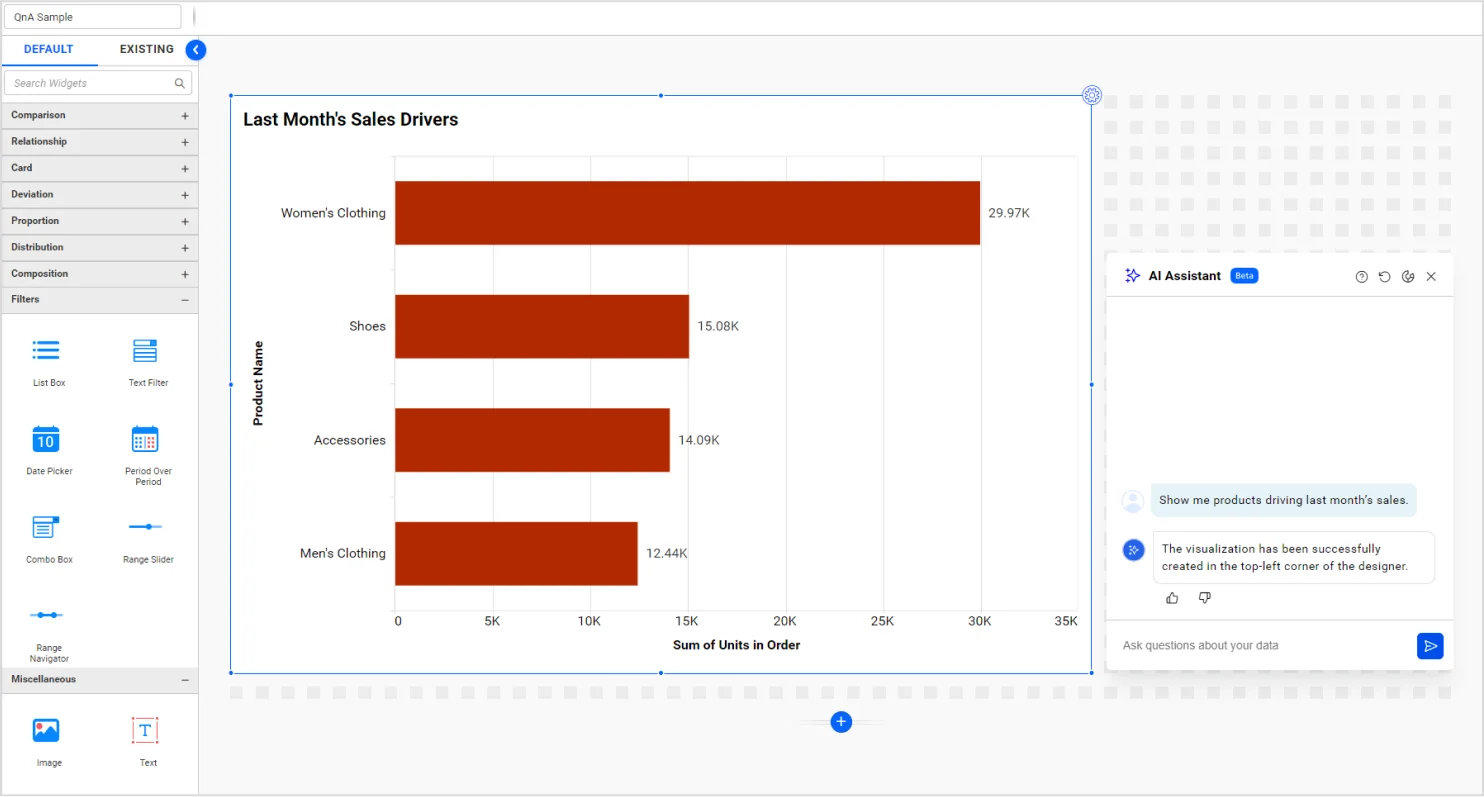
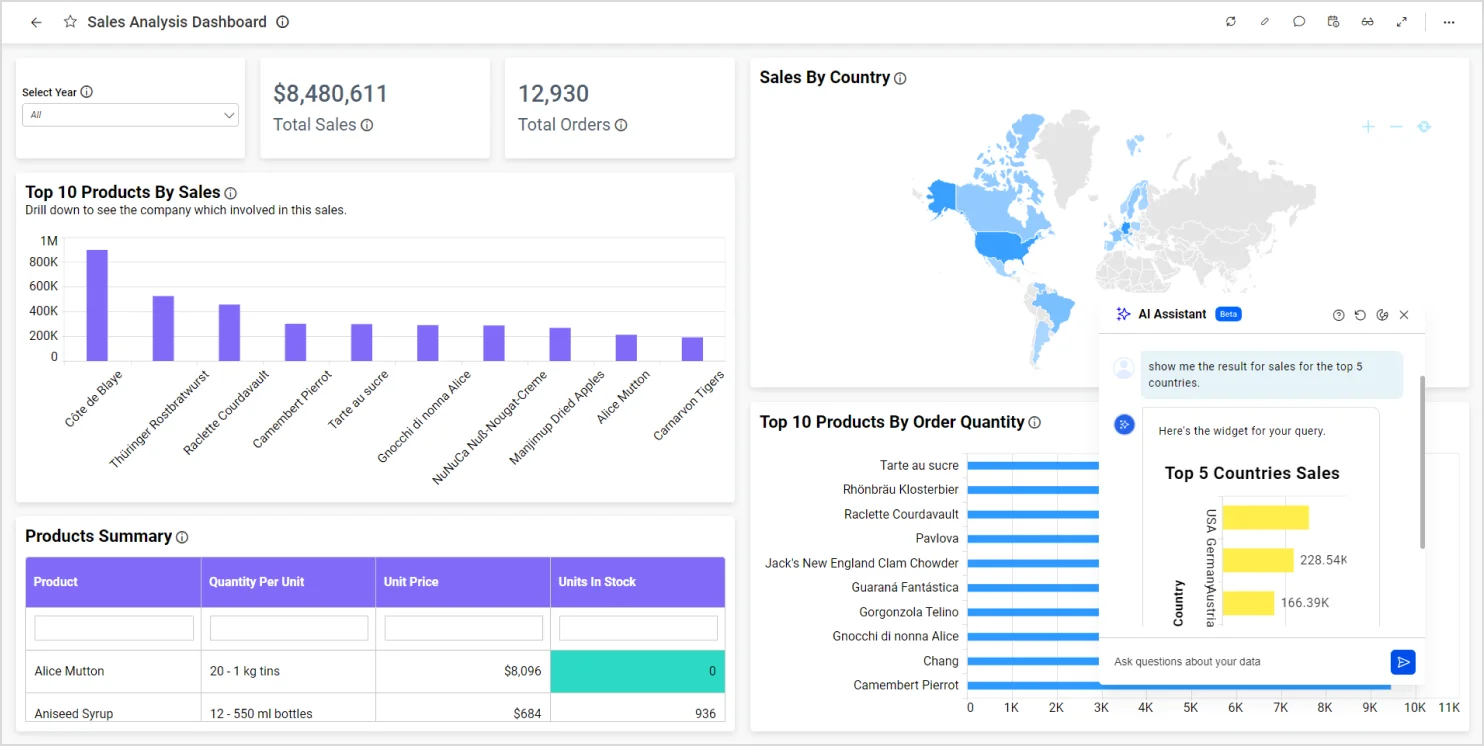
In dashboard designer mode, the AI assistant lets you create visualizations simply by typing queries in natural language, significantly speeding up the design process. In viewer mode, while you can’t create or edit visuals, you can analyze trends in your existing data by asking questions in plain language. The result will be available in a dialog, allowing you to gain insights without altering your dashboards or metrics. This simplifies complex data interpretation and enables easy chart creation based on your prompts.
Query: “Show me the top 5 products driving last month’s sales.”
Response:
Query: “Show me the sales result for the top 5 countries.”
Response:
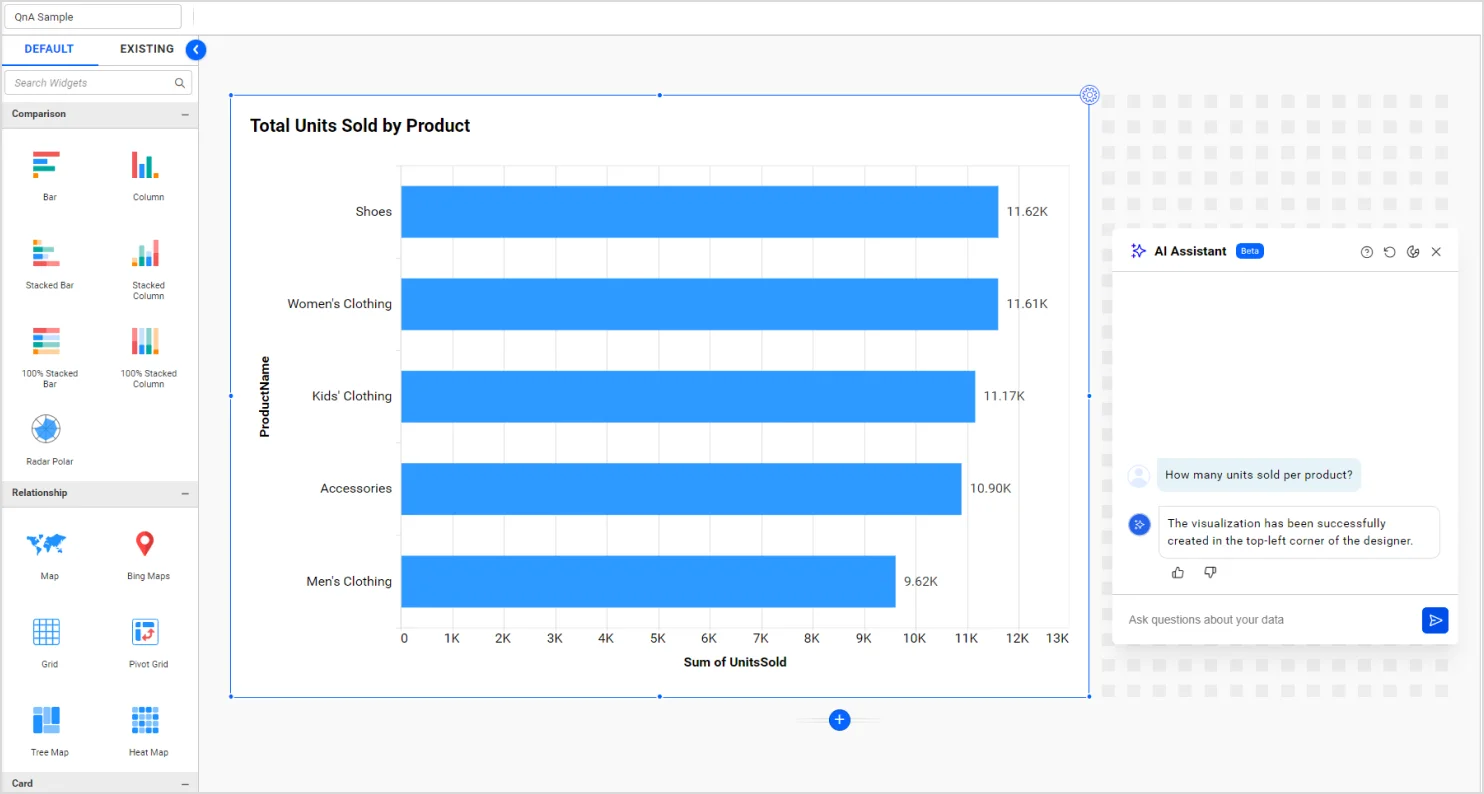
Query: “How many units sold per product?”
Response:
Query: “How many conversions per campaign type.”
Response:
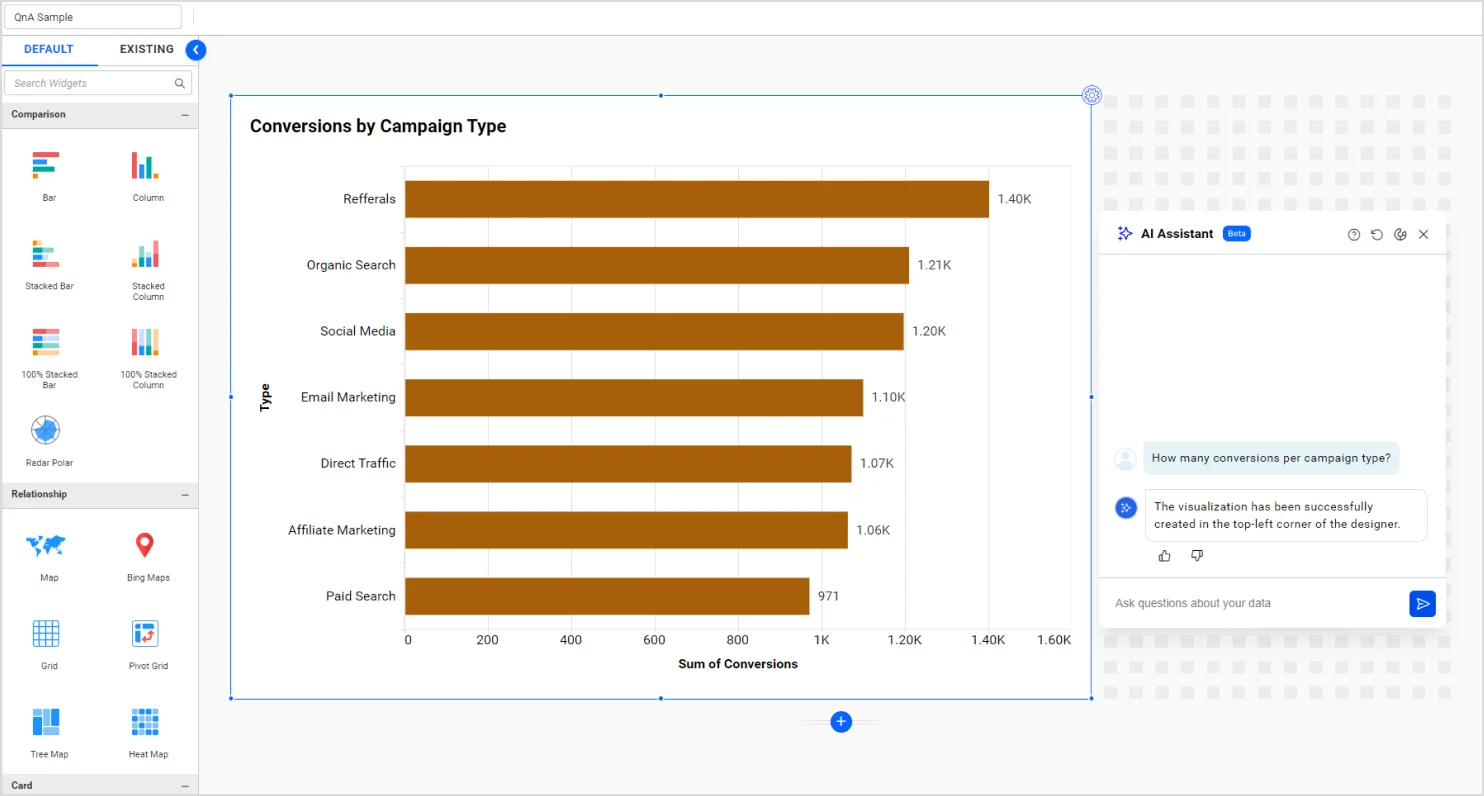
This user-friendly approach eliminates the need for extensive data analysis skills, empowering non-technical professionals to independently derive actionable insights and expedite decision-making.
b. Customization prompts for dashboards and visualizations
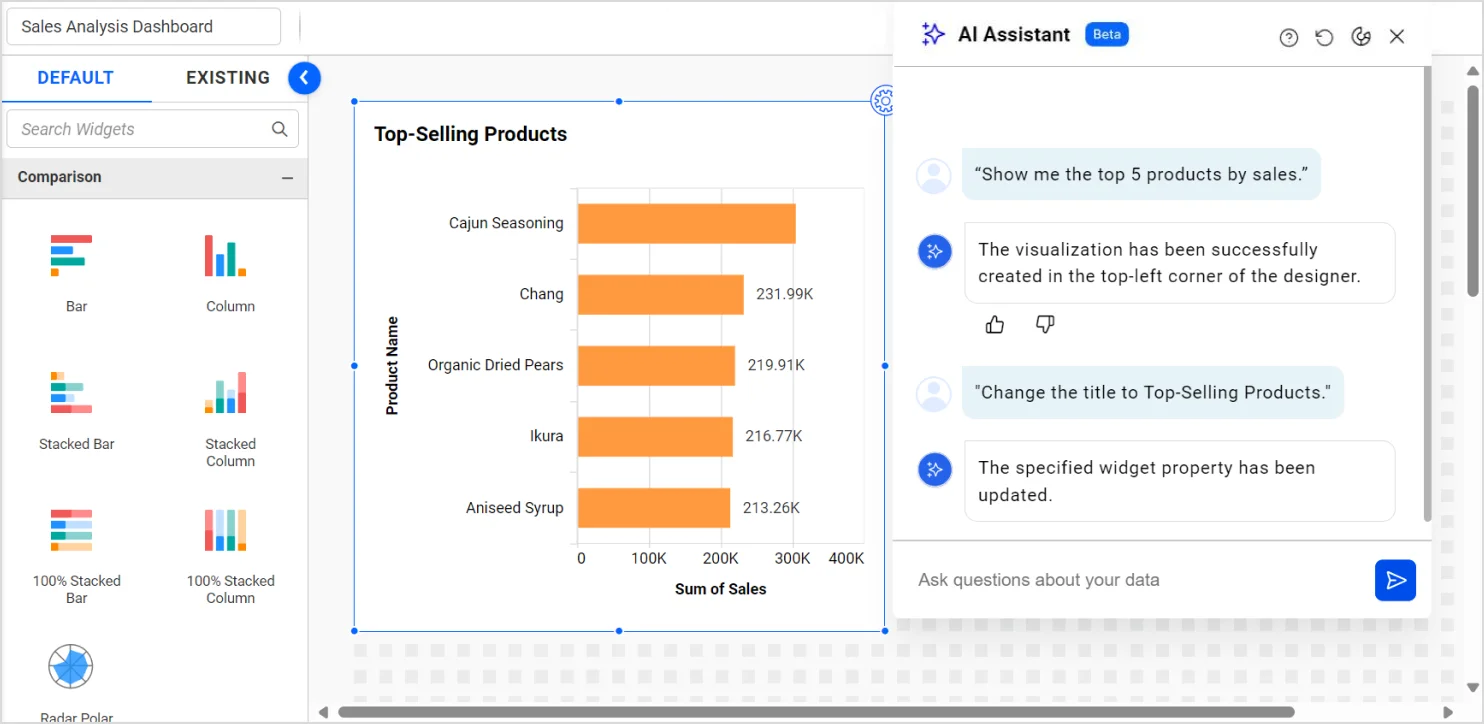
While Bold BI’s AI assistant can generate visualizations from natural language prompts, you may also customize these outputs to meet design and style requirements. In designer mode, you can adjust visuals with just a click—resizing charts, changing color schemes, and repositioning widgets—making it faster and more efficient than manual adjustments.
Query: “Change the title to ‘Top-Selling Products’.”
Response:
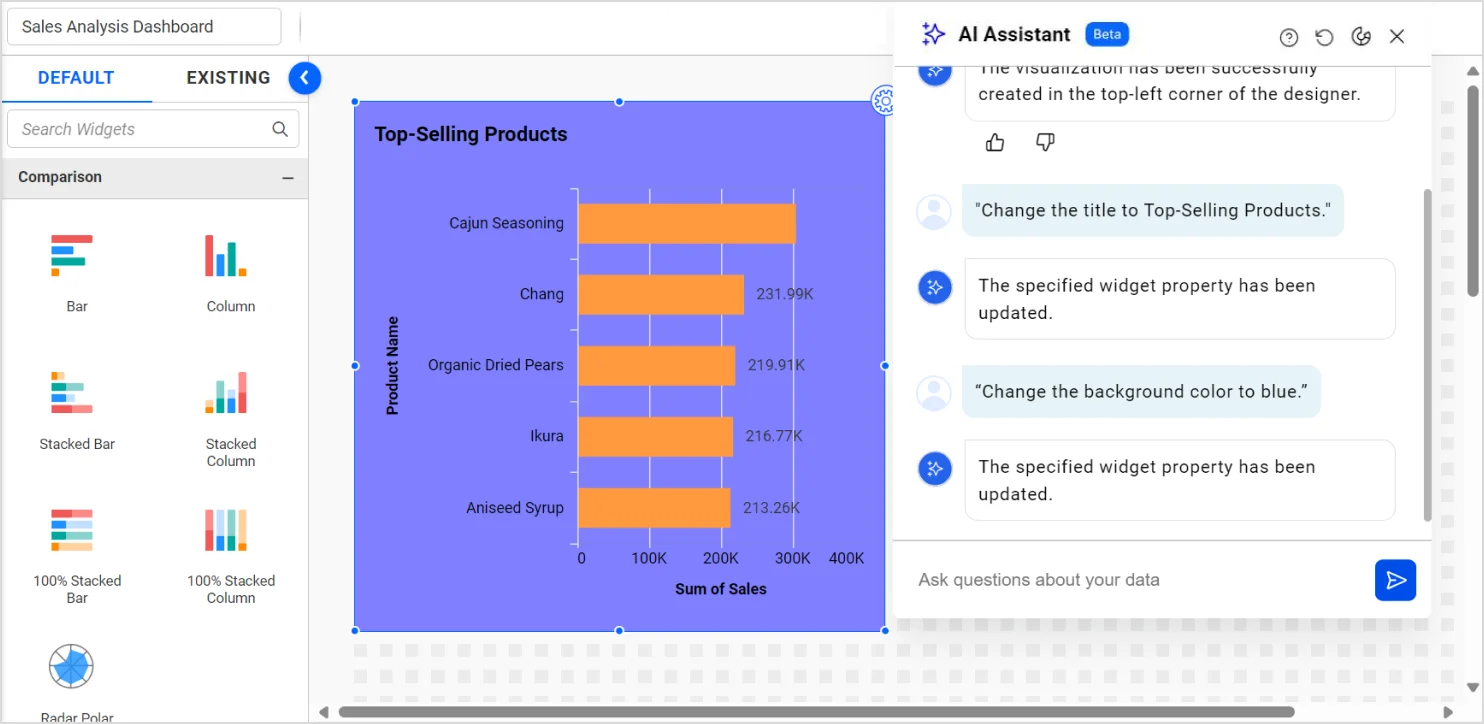
Query: “Change the background color to blue.”
Response:
Query: “Change the bar color to red.”
Response:
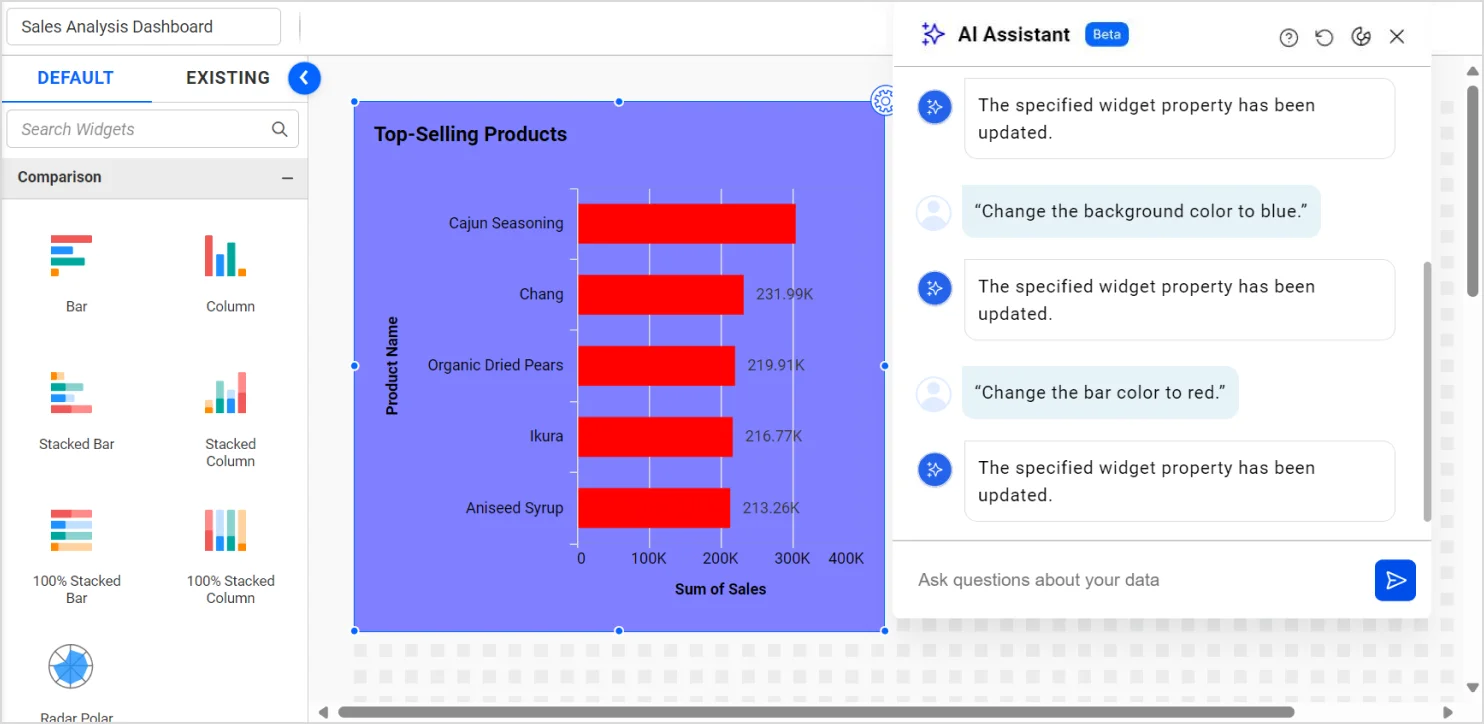
If you are a Bold BI user, you will not need to understand chart properties; the AI assistant will adjust them for you based on your natural language input. In the dashboard designer mode, you will iteratively modify a visualization until your requirements are met. This speeds up turnaround times for dashboard publishing by reducing manual effort, thus boosting productivity.
c. Direct queries
In addition to visualizations and queries, there are instances where textual responses prove more meaningful, such queries include:
- Which country produced the greatest profit last week?
- How many customers didn’t purchase product X?
- Is revenue higher compared to last week?
For questions like these, a text response is enough.
Bold BI’s conversational AI assistance will cater to a diverse range of queries, providing answers in both text and chart formats as needed. By providing multiformat responses, Bold BI enables its users to extract insights efficiently, enhancing decision-making processes in data analysis. To learn more about Bold BI’s AI feature, refer to our documentation.
d. AI-driven textual reports
Converting chart insights into textual summaries enhances comprehension and adds a professional touch to reports. Bold BI plans to utilize a large language model (LLM) for chart comprehension and data analysis, which will enable businesses to generate concise textual summaries. This feature virtually eliminates the effort required for manual analysis and report creation.
By leveraging this advanced feature, Bold BI users can:
- Generate accurate textual summaries of dashboard insights.
- Reduce the risk of errors inherent in manual analysis processes.
- Schedule the regular generation of textual summaries and deliver them via email.
By automating the composition and delivery of dashboard summaries, users can focus on critical tasks while staying up to date on key metrics. This seamless process reduces the need for constant monitoring, optimizing time management and improving overall productivity.
Conclusion
Bold BI® is using AI to improve the dashboard design and analysis experience, saving users time and effort. With conversational AI support, users can create and modify charts using simple language, accelerating dashboard design. This AI can also answer data questions with text responses, helping users understand their data without extensive chart analysis. Furthermore, AI-generated textual summaries alert users to important insights, cutting down on manual monitoring time. These AI-driven advancements are poised to shape Bold BI’s future, empowering smarter decision-making and success in a data-centric world.
What are you waiting for? Get started now by signing up for a free trial and create more interactive business intelligence dashboards with just a click. You can contact us by submitting questions through the Bold BI website or, if you already have an account, you can log in to submit your support question.


